The same plot in 14 other libraries — JavaScript: D3.js, Apache ECharts, Highcharts, MUI X Charts; Python: Altair, Bokeh, lets-plot, Matplotlib, Plotly, plotnine, Pygal, Seaborn; R: ggplot2; Julia: Makie.jl. Compare all 15 side by side: Hierarchical Network Graph with Tree Layout in Python, R, Julia and JavaScript.
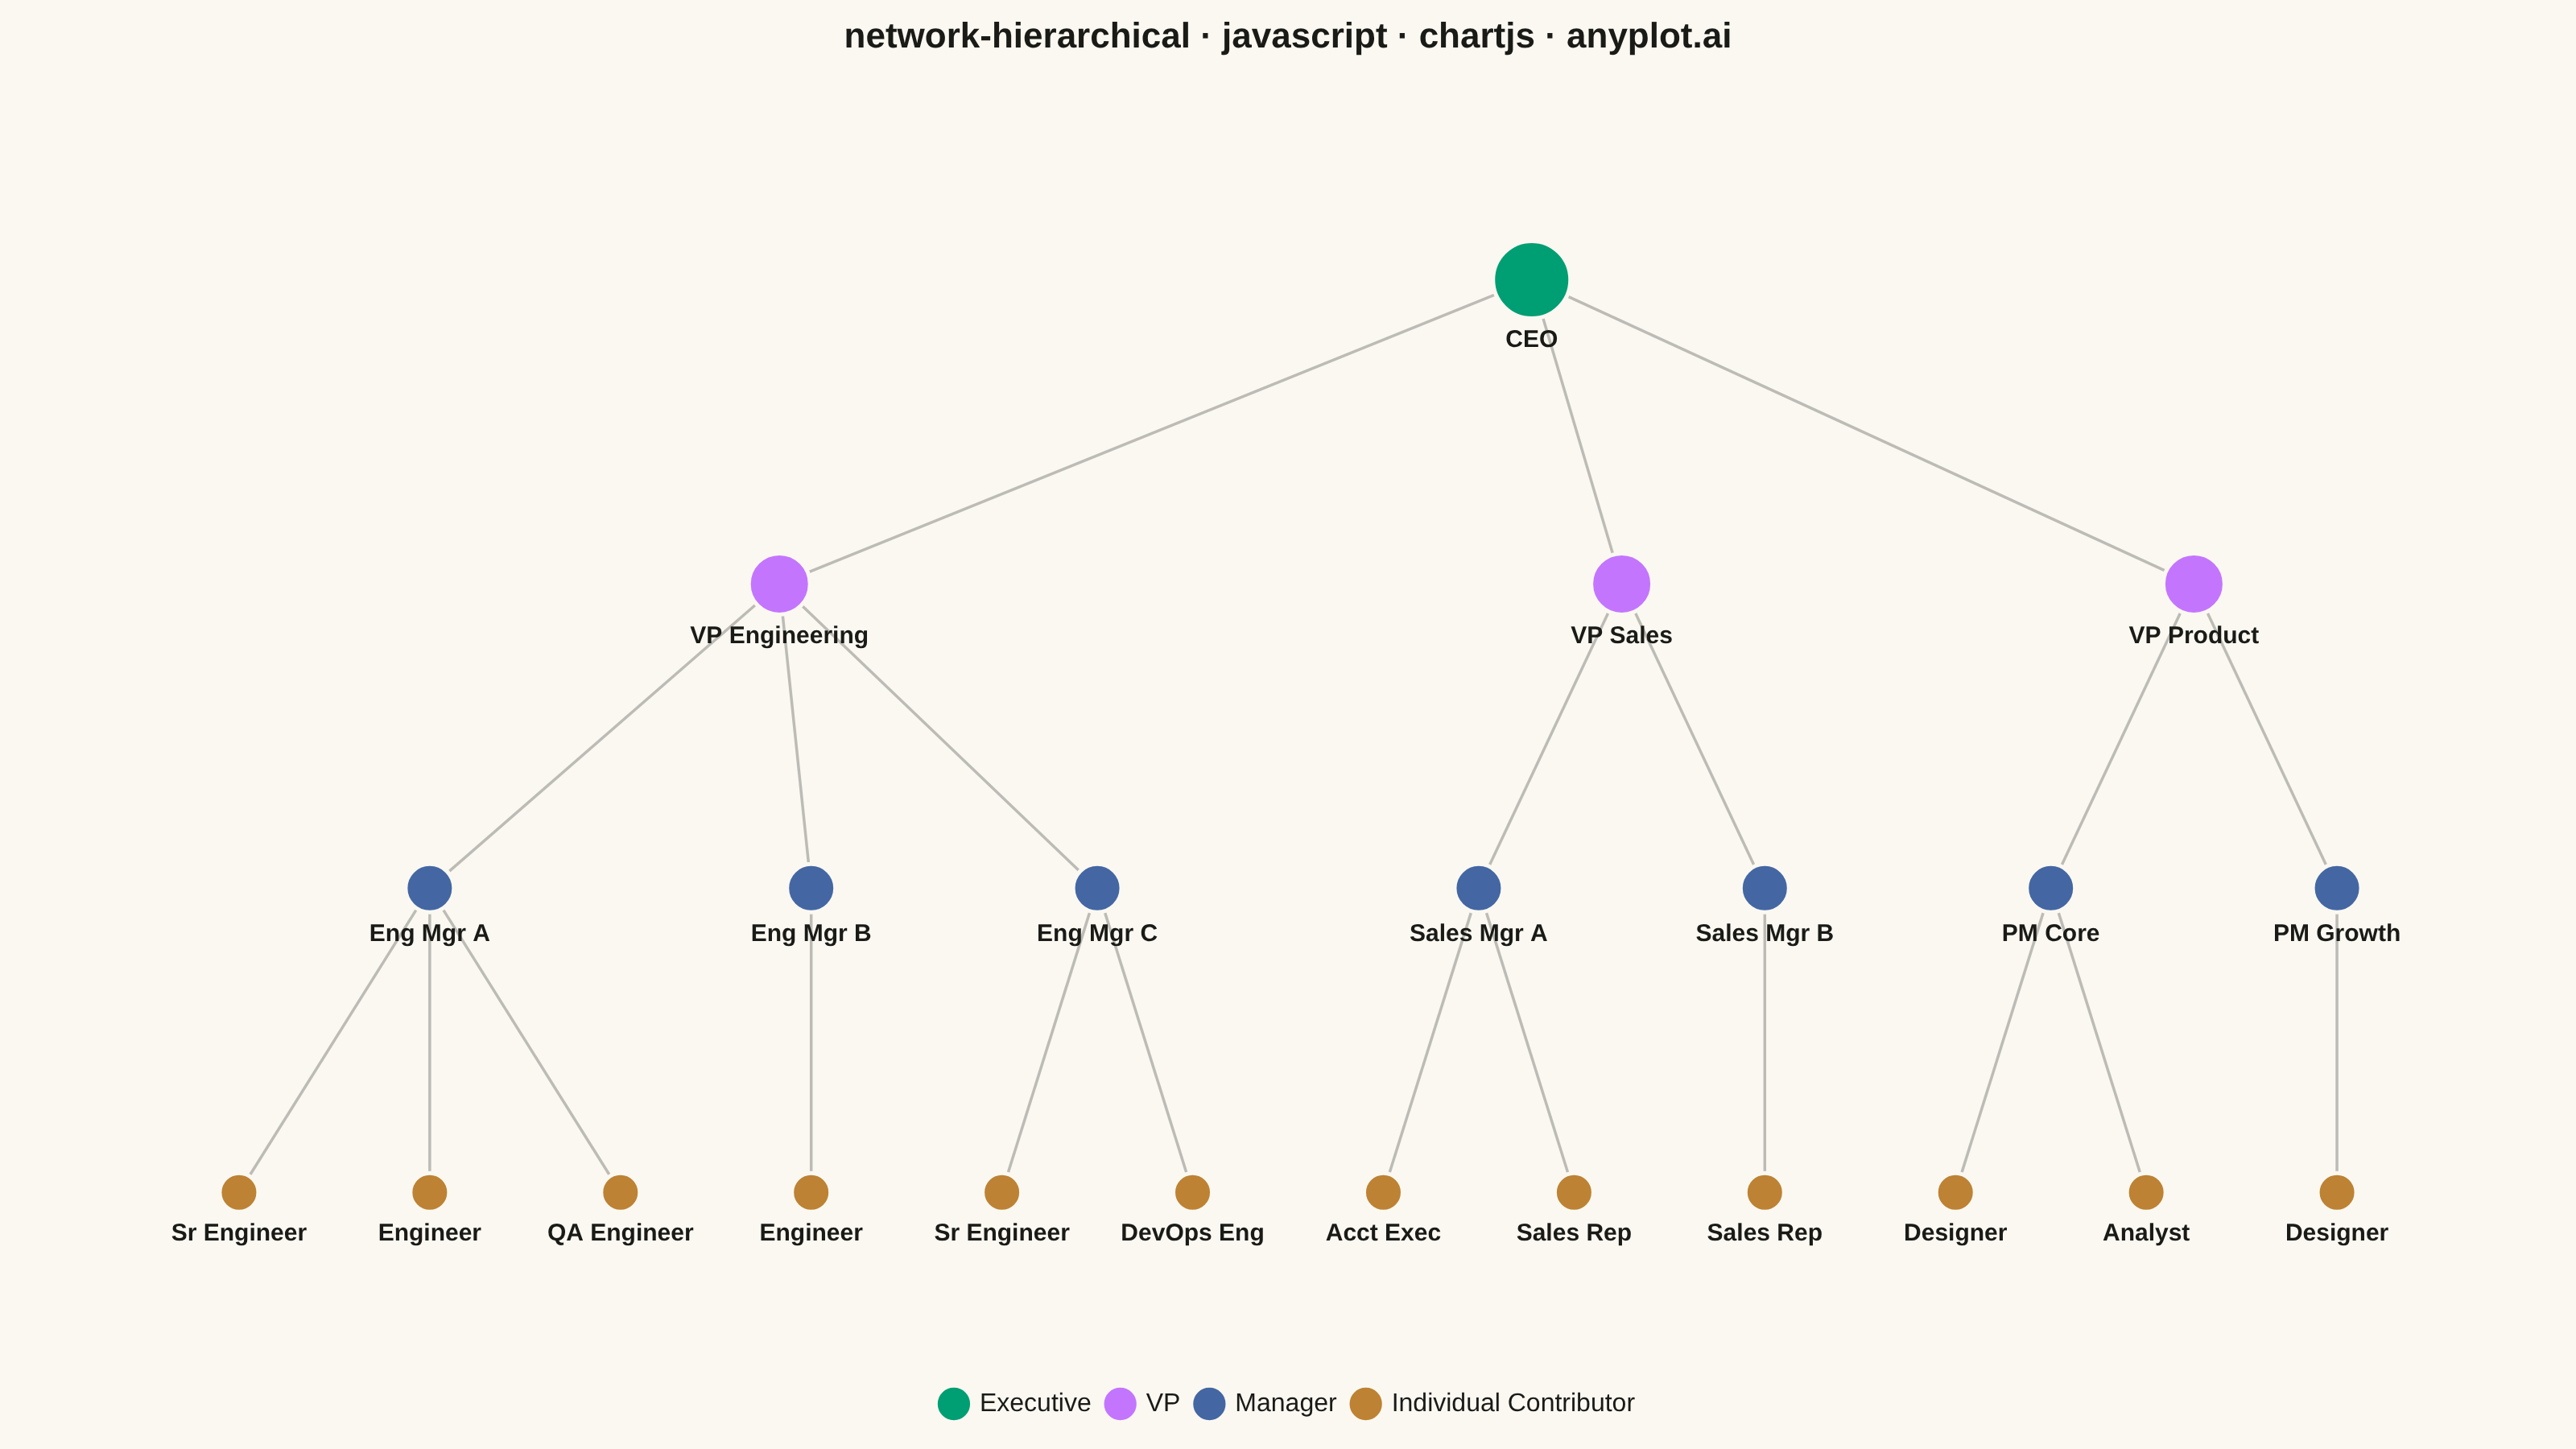
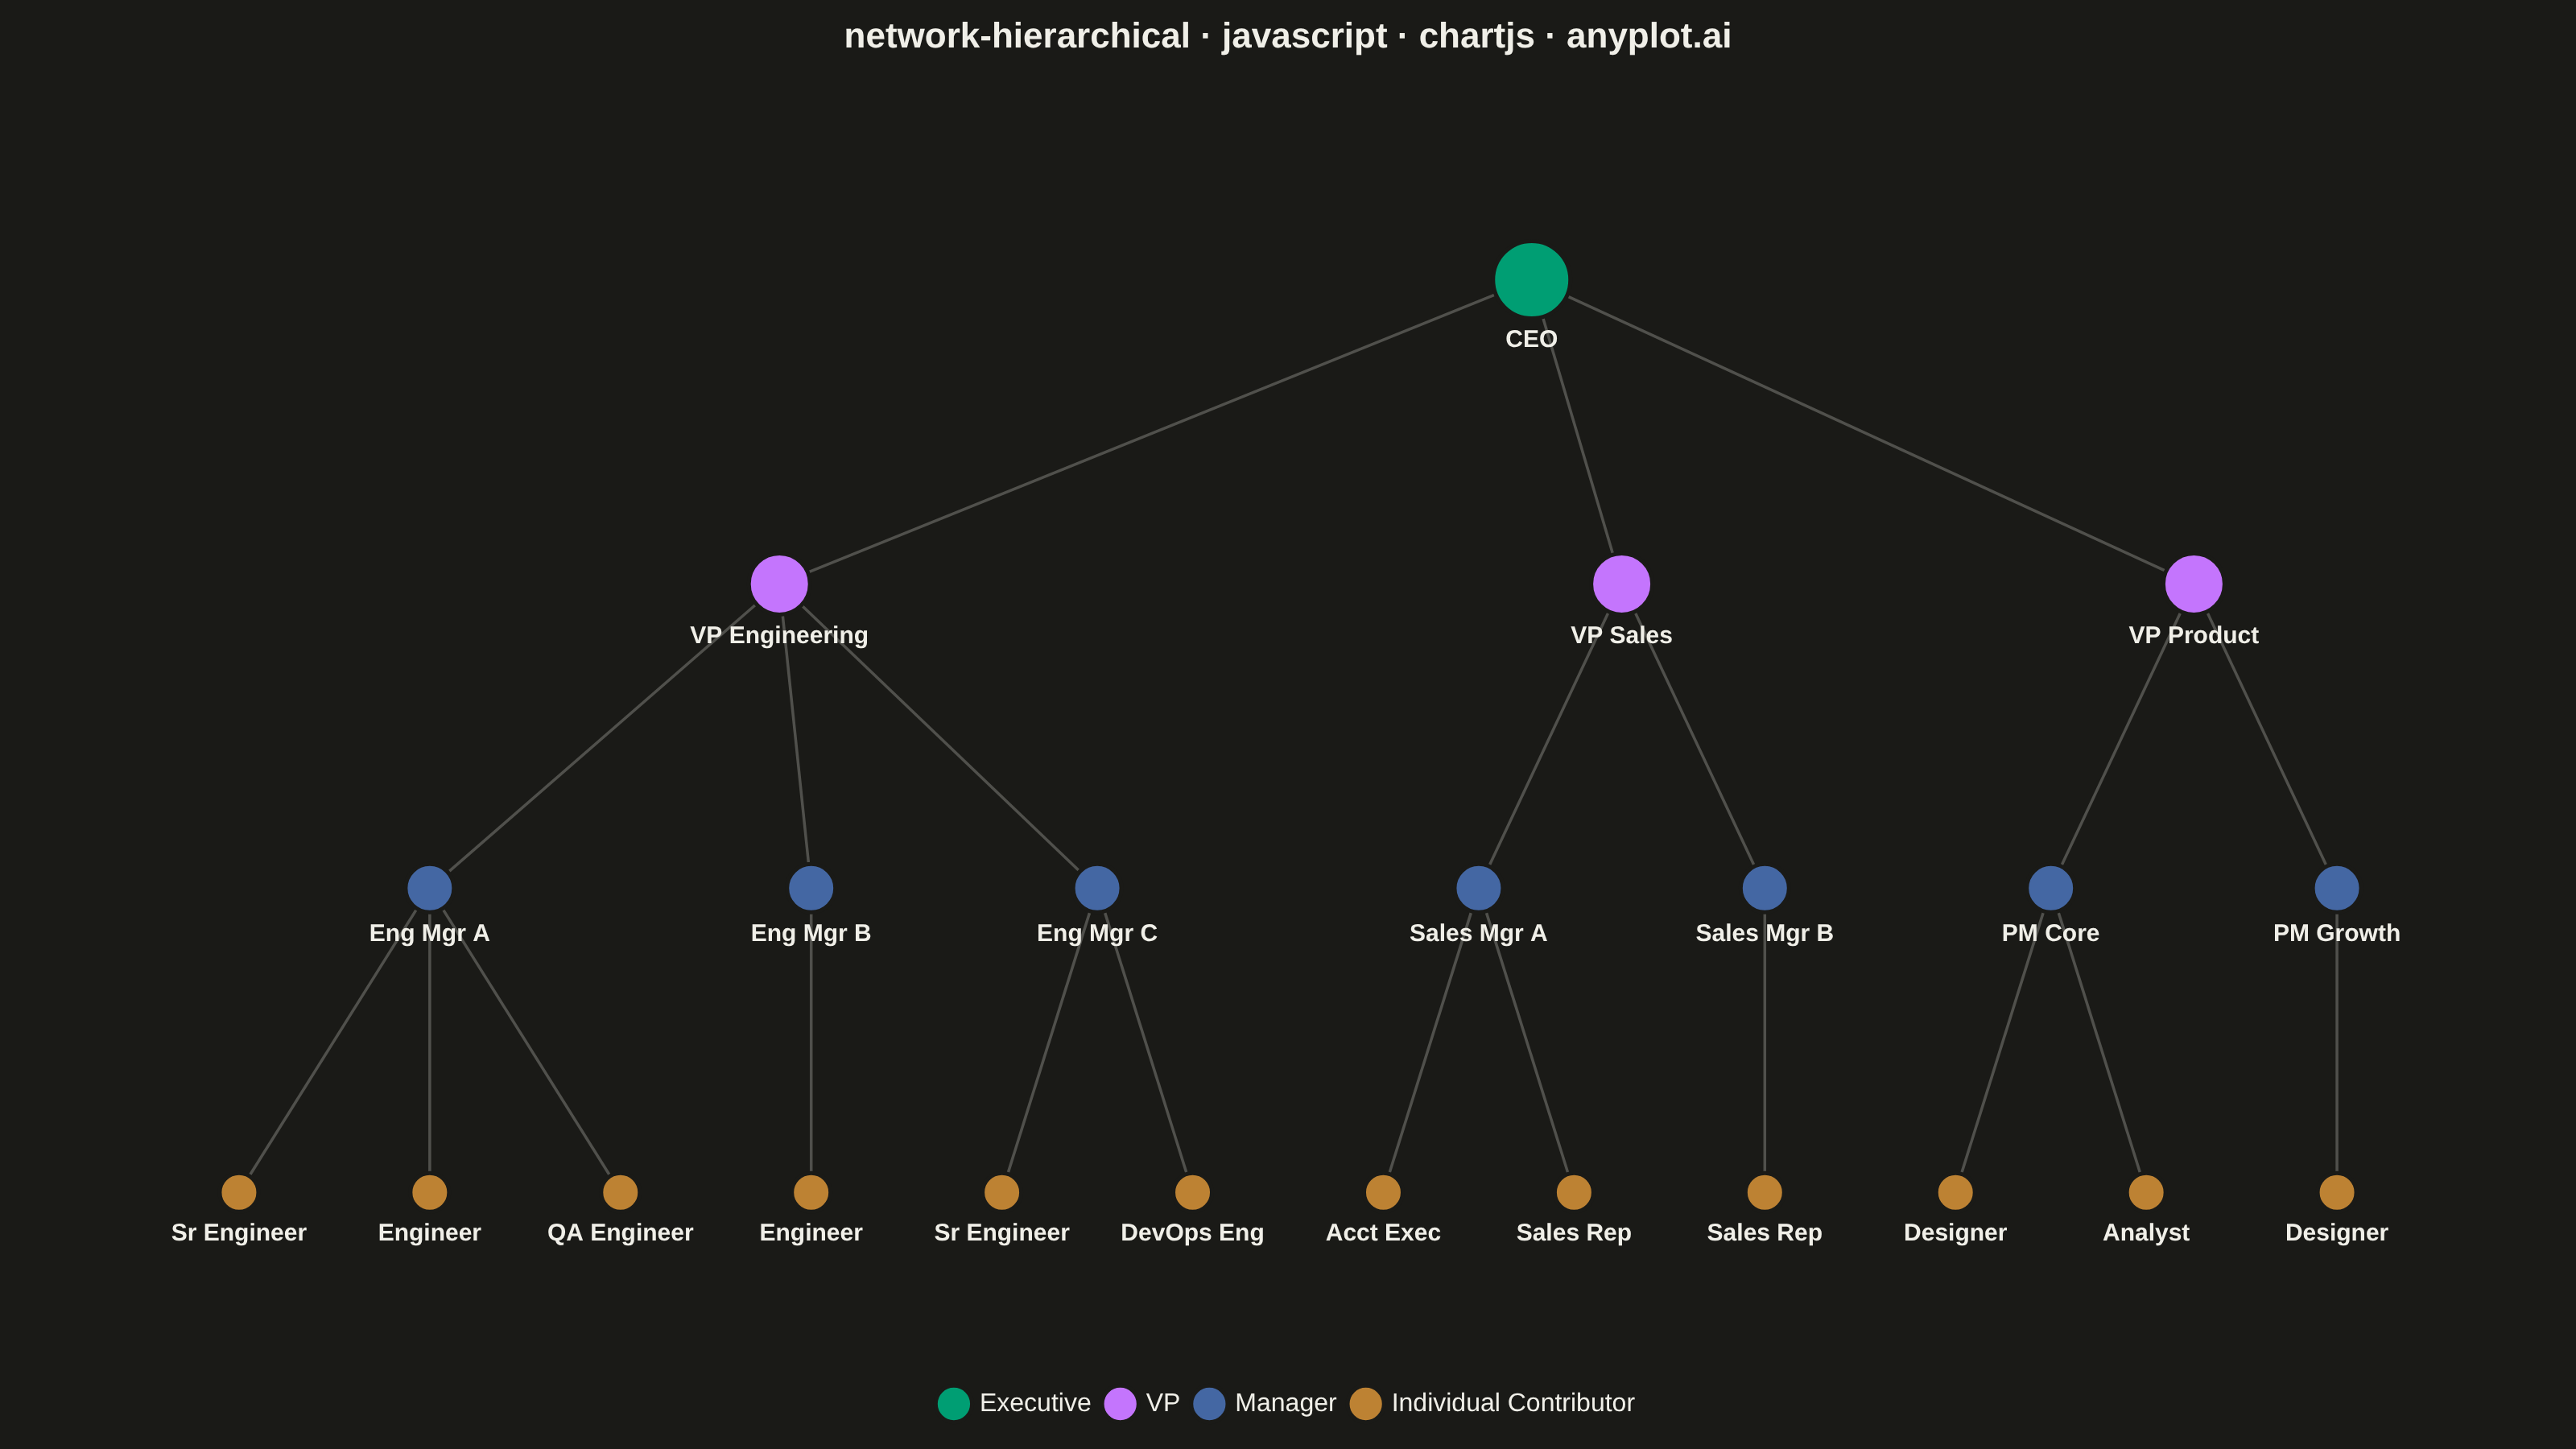
A hierarchical network graph organizes nodes in distinct levels from root to leaves, with edges showing parent-child relationships between levels. Unlike force-directed layouts that optimize for aesthetic spacing, hierarchical layouts explicitly encode tree structure by positioning nodes at fixed vertical or horizontal levels. This visualization reveals organizational depth, branching patterns, and the overall tree structure at a glance.
// anyplot.ai
// network-hierarchical: Hierarchical Network Graph with Tree Layout
// Library: chartjs 4.4.7 | JavaScript 22.23.2
// Quality: 91/100 | Created: 2026-09-02

const t = window.ANYPLOT_TOKENS;

// --- Data: a small org chart, 4 management levels, asymmetric branching ---
const orgTree = {
  label: "CEO",
  children: [
    {
      label: "VP Engineering",
      children: [
        {
          label: "Eng Mgr A",
          children: [
            { label: "Sr Engineer" },
            { label: "Engineer" },
            { label: "QA Engineer" },
          ],
        },
        { label: "Eng Mgr B", children: [{ label: "Engineer" }] },
        {
          label: "Eng Mgr C",
          children: [{ label: "Sr Engineer" }, { label: "DevOps Eng" }],
        },
      ],
    },
    {
      label: "VP Sales",
      children: [
        {
          label: "Sales Mgr A",
          children: [{ label: "Acct Exec" }, { label: "Sales Rep" }],
        },
        { label: "Sales Mgr B", children: [{ label: "Sales Rep" }] },
      ],
    },
    {
      label: "VP Product",
      children: [
        {
          label: "PM Core",
          children: [{ label: "Designer" }, { label: "Analyst" }],
        },
        { label: "PM Growth", children: [{ label: "Designer" }] },
      ],
    },
  ],
};

const NUM_LEVELS = 4;
const CATEGORY_LABELS = ["Executive", "VP", "Manager", "Individual Contributor"];
const NODE_RADII = [24, 19, 15, 12];

// Post-order layout: leaves get sequential x slots, parents center over children.
let leafIndex = 0;
const assignPositions = (node, level) => {
  node.level = level;
  if (!node.children || node.children.length === 0) {
    node.x = leafIndex;
    leafIndex += 1;
  } else {
    node.children.forEach((child) => assignPositions(child, level + 1));
    node.x =
      node.children.reduce((sum, child) => sum + child.x, 0) / node.children.length;
  }
  node.y = NUM_LEVELS - 1 - level;
};
assignPositions(orgTree, 0);

const nodesByLevel = [[], [], [], []];
const edges = [];
const collect = (node, parent) => {
  nodesByLevel[node.level].push(node);
  if (parent) edges.push([parent, node]);
  (node.children || []).forEach((child) => collect(child, node));
};
collect(orgTree, null);

const leafCount = leafIndex;

// --- Helpers -----------------------------------------------------------------
const hexToRgba = (hex, alpha) => {
  const r = parseInt(hex.slice(1, 3), 16);
  const g = parseInt(hex.slice(3, 5), 16);
  const b = parseInt(hex.slice(5, 7), 16);
  return `rgba(${r}, ${g}, ${b}, ${alpha})`;
};

// --- Mount -------------------------------------------------------------------
const canvas = document.createElement("canvas");
document.getElementById("container").appendChild(canvas);

// --- Datasets ------------------------------------------------------------
// Edges first (drawn bottom), node levels after (drawn on top).
const edgeDatasets = edges.map(([parent, child]) => ({
  type: "line",
  data: [
    { x: parent.x, y: parent.y },
    { x: child.x, y: child.y },
  ],
  showLine: true,
  fill: false,
  borderColor: hexToRgba(t.inkSoft, 0.35),
  borderWidth: 1.75,
  pointRadius: 0,
  pointHoverRadius: 0,
  tension: 0,
  isEdge: true,
  order: 2,
}));

const nodeDatasets = nodesByLevel.map((nodes, level) => ({
  type: "scatter",
  label: CATEGORY_LABELS[level],
  data: nodes.map((n) => ({ x: n.x, y: n.y, label: n.label })),
  backgroundColor: t.palette[level],
  borderColor: t.pageBg,
  borderWidth: 2.5,
  pointStyle: "circle",
  pointRadius: NODE_RADII[level],
  pointHoverRadius: NODE_RADII[level] + 2,
  isNodeSet: true,
  order: 1,
}));

// --- Title (scale fontsize for the 67-char baseline) ----------------------
const TITLE = "network-hierarchical · javascript · chartjs · anyplot.ai";
const TITLE_SIZE =
  TITLE.length > 67 ? Math.max(15, Math.round(22 * (67 / TITLE.length))) : 22;

// --- Node label plugin (draws role titles below each marker) -------------
const nodeLabelPlugin = {
  id: "nodeLabels",
  afterDatasetsDraw(chart) {
    const { ctx } = chart;
    chart.data.datasets.forEach((dataset, i) => {
      if (!dataset.isNodeSet) return;
      const meta = chart.getDatasetMeta(i);
      meta.data.forEach((point, idx) => {
        ctx.save();
        ctx.fillStyle = t.ink;
        ctx.font = "600 15px sans-serif";
        ctx.textAlign = "center";
        ctx.textBaseline = "top";
        ctx.fillText(dataset.data[idx].label, point.x, point.y + dataset.pointRadius + 6);
        ctx.restore();
      });
    });
  },
};

// --- Chart -----------------------------------------------------------------
new Chart(canvas, {
  type: "scatter",
  data: { datasets: [...edgeDatasets, ...nodeDatasets] },
  plugins: [nodeLabelPlugin],
  options: {
    responsive: true,
    maintainAspectRatio: false,
    animation: false,
    layout: { padding: { top: 10, right: 30, bottom: 10, left: 30 } },
    plugins: {
      title: {
        display: true,
        text: TITLE,
        color: t.ink,
        font: { size: TITLE_SIZE, weight: "600" },
        padding: { bottom: 24 },
      },
      legend: {
        position: "bottom",
        labels: {
          color: t.ink,
          font: { size: 16 },
          usePointStyle: true,
          filter: (item, data) => !data.datasets[item.datasetIndex].isEdge,
        },
      },
    },
    scales: {
      x: { display: false, min: -1, max: leafCount },
      y: { display: false, min: -0.6, max: NUM_LEVELS - 1 + 0.6 },
    },
  },
});
Runnable source as JSON, for any HTTP client: https://api.anyplot.ai/specs/network-hierarchical/chartjs/code. Any spec id and library id listed in llms-full.txt fit the same URL shape; every URL below is complete and callable.
{
  "spec_id": "network-hierarchical",
  "language": "javascript",
  "library": "chartjs",
  "page": "https://anyplot.ai/network-hierarchical/javascript/chartjs",
  "hub": "https://anyplot.ai/network-hierarchical",
  "code_json": "https://api.anyplot.ai/specs/network-hierarchical/chartjs/code",
  "spec_json": "https://api.anyplot.ai/specs/network-hierarchical",
  "render_light_png": "https://storage.googleapis.com/anyplot-images/plots/network-hierarchical/javascript/chartjs/plot-light.png",
  "render_dark_png": "https://storage.googleapis.com/anyplot-images/plots/network-hierarchical/javascript/chartjs/plot-dark.png",
  "interactive_light_html": "https://storage.googleapis.com/anyplot-images/plots/network-hierarchical/javascript/chartjs/plot-light.html",
  "interactive_dark_html": "https://storage.googleapis.com/anyplot-images/plots/network-hierarchical/javascript/chartjs/plot-dark.html",
  "quality_score": 91.0,
  "license": "MIT",
  "guide": "https://anyplot.ai/llms.txt"
}
Part of Hierarchical Network Graph with Tree Layout on anyplot.ai.