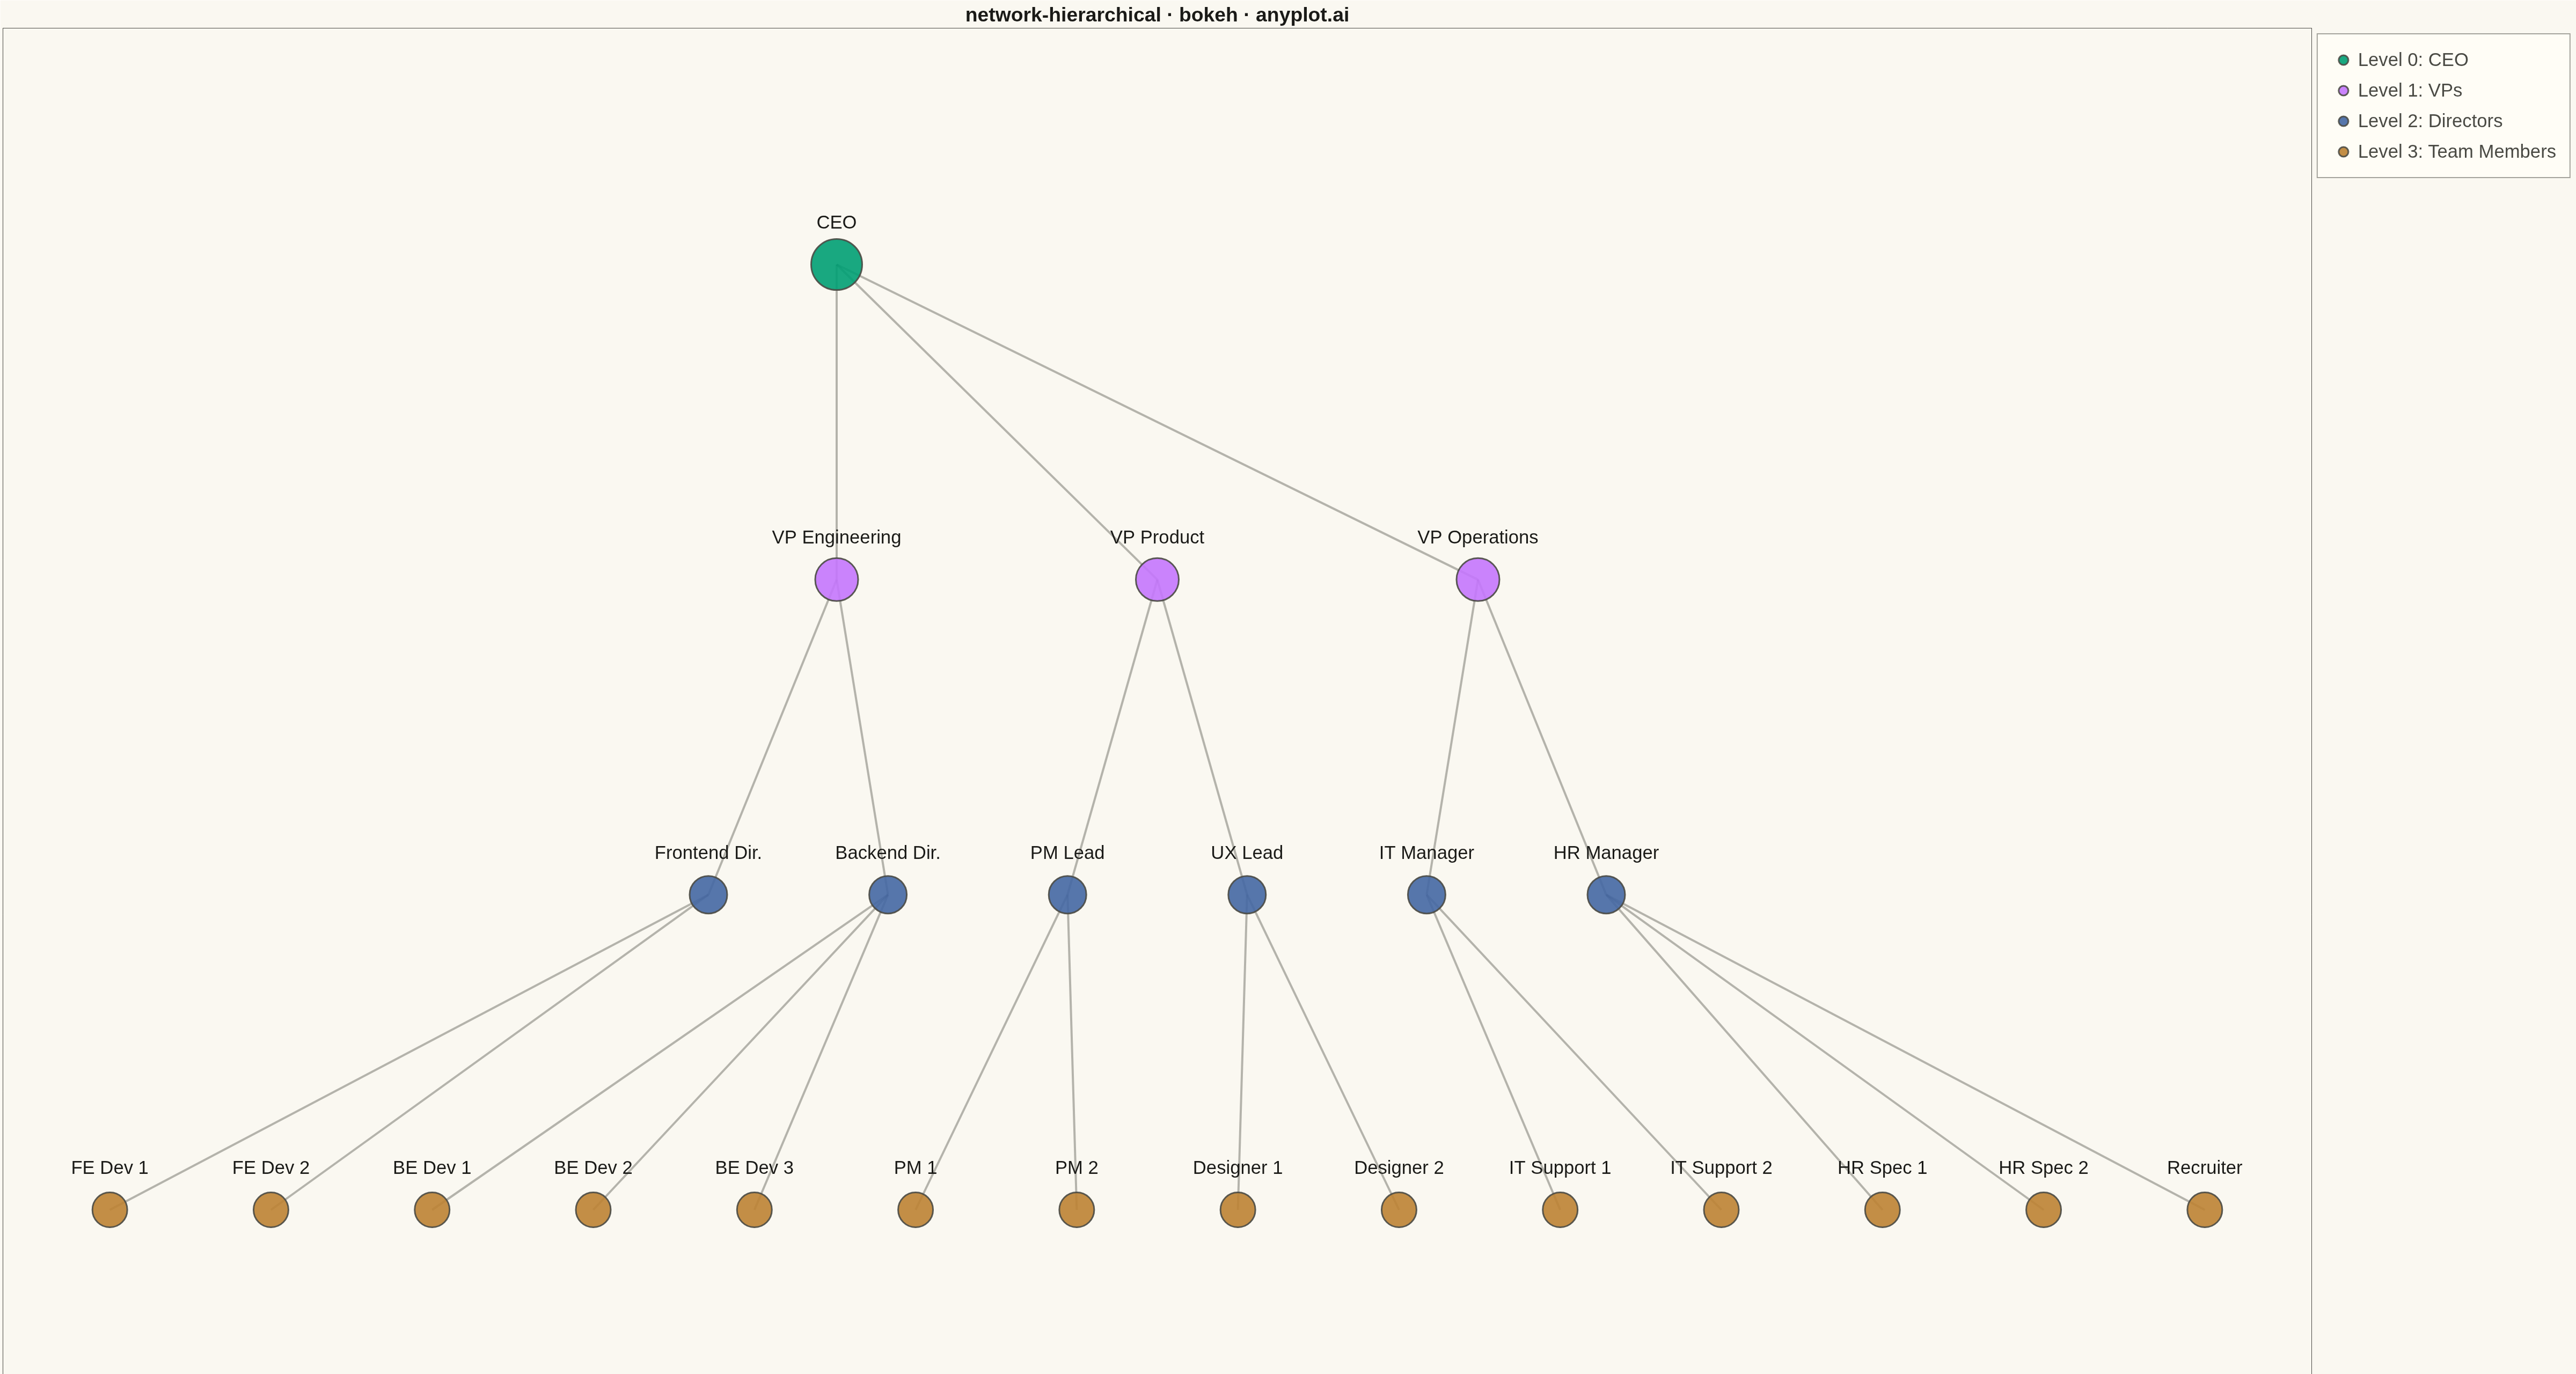
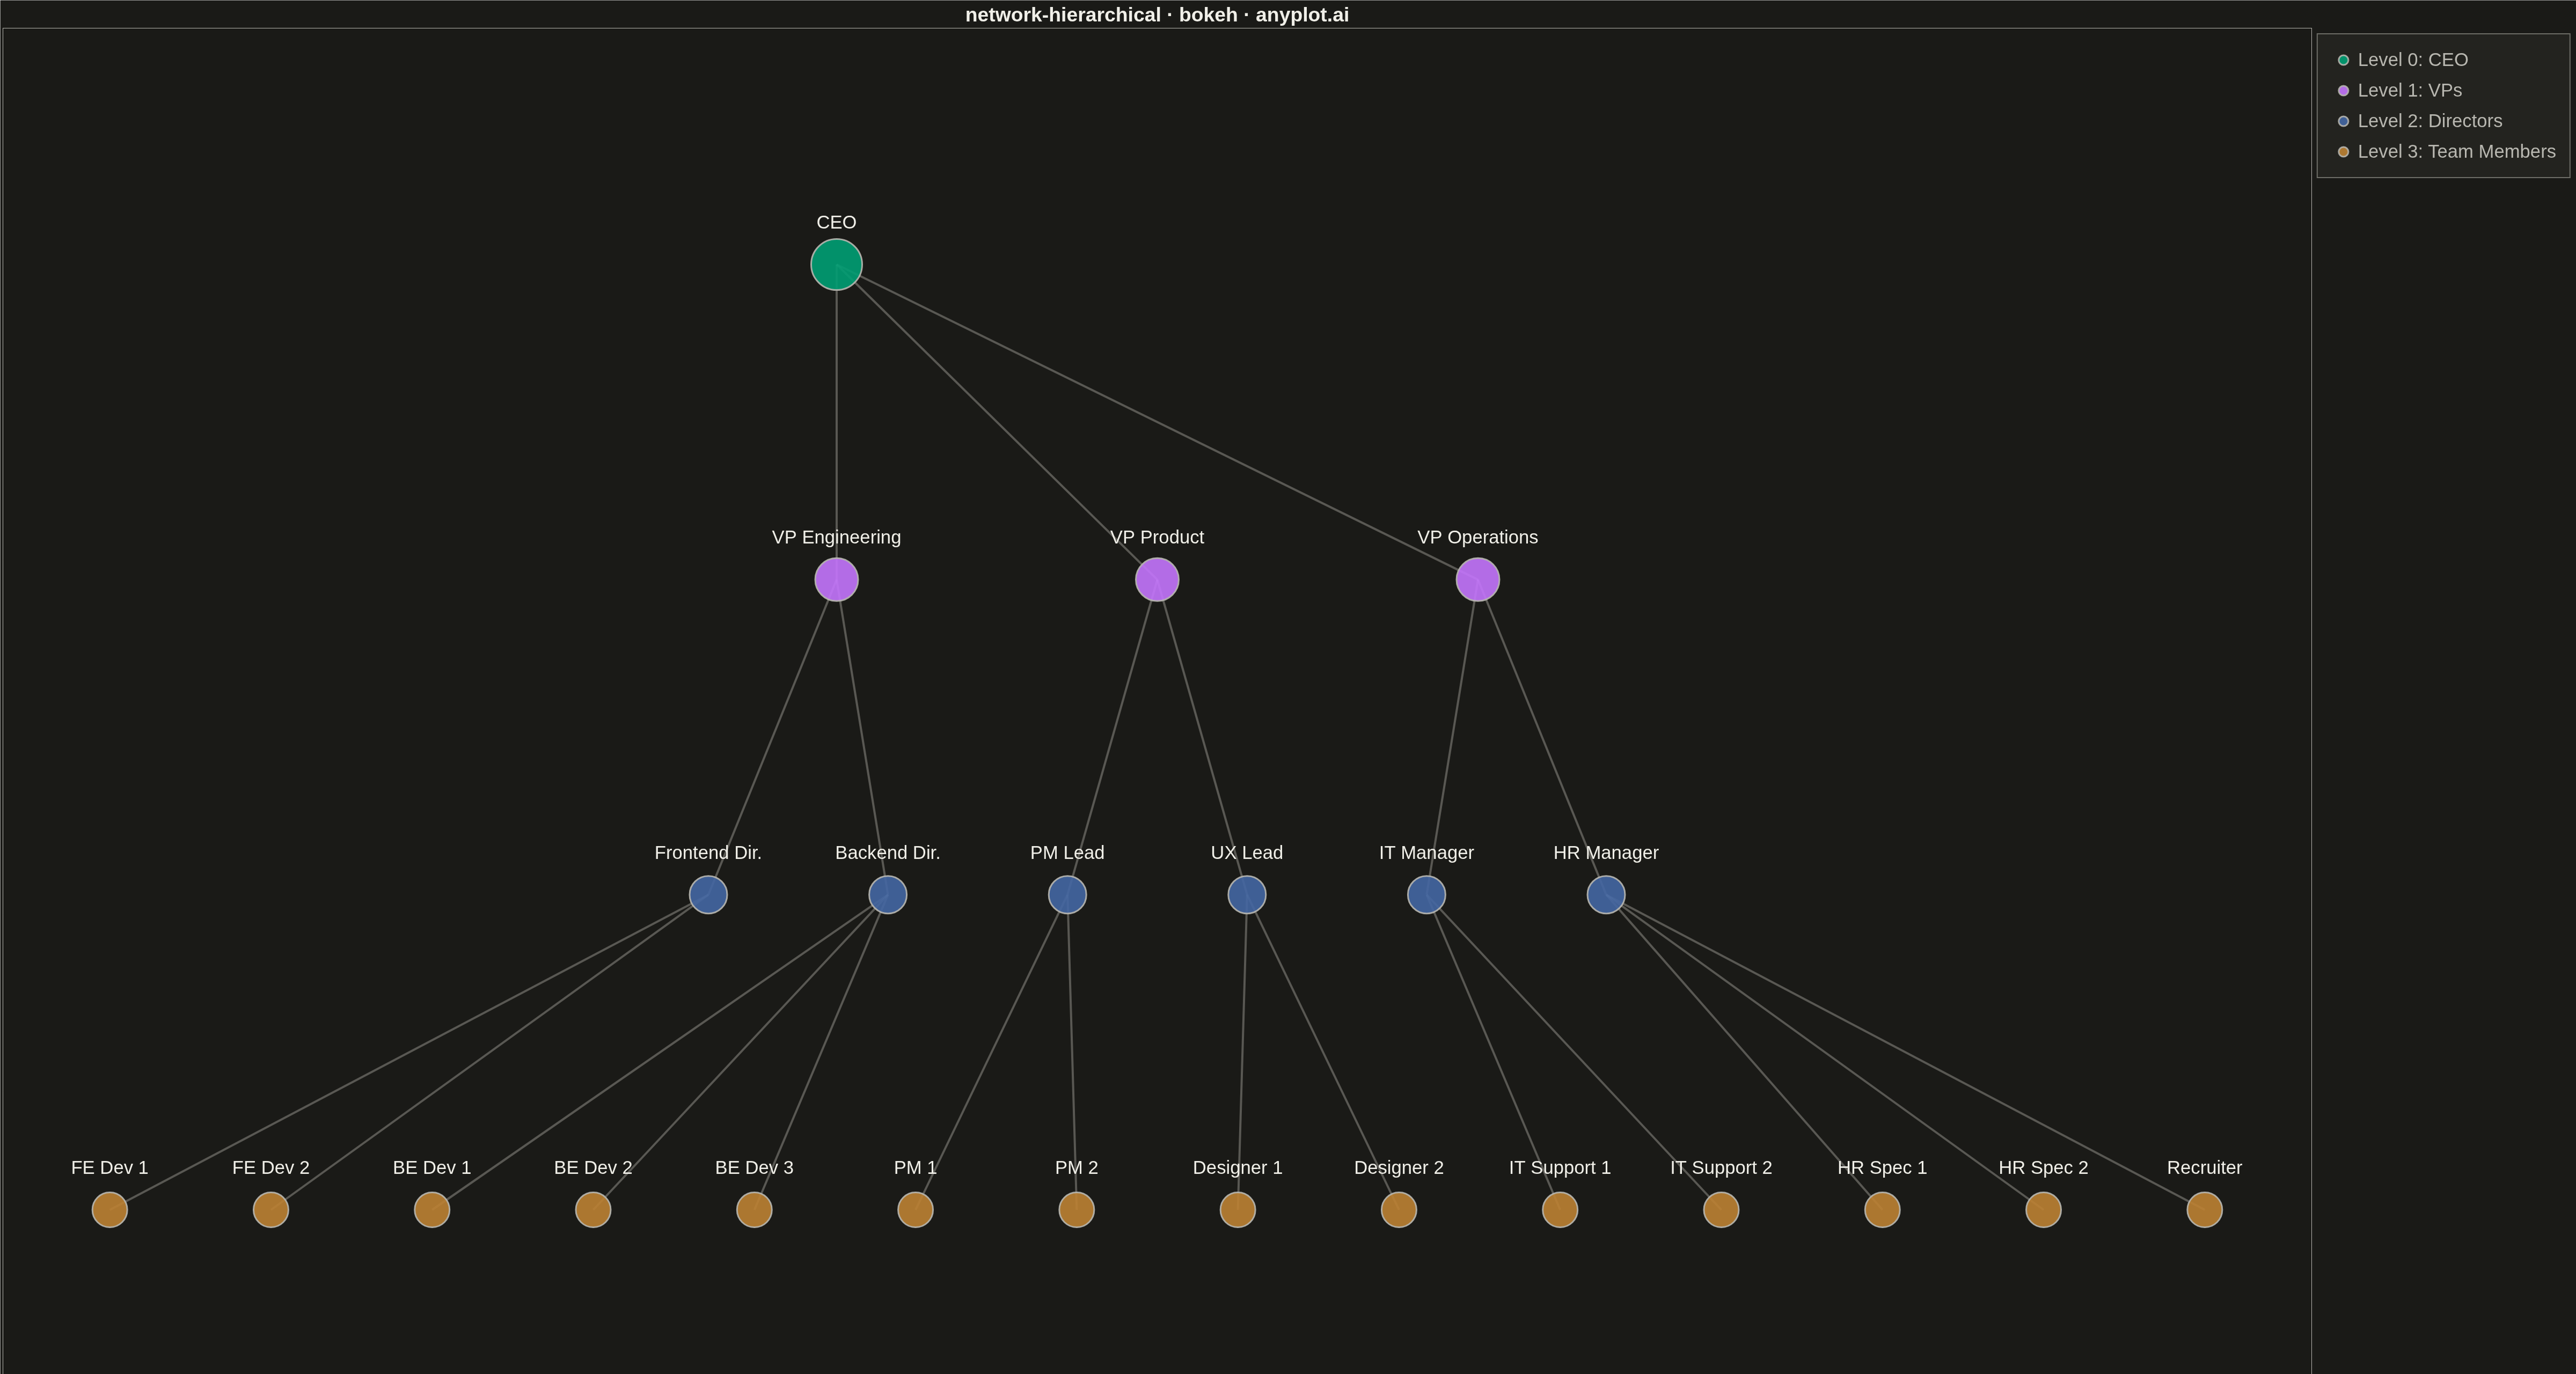
A hierarchical network graph organizes nodes in distinct levels from root to leaves, with edges showing parent-child relationships between levels. Unlike force-directed layouts that optimize for aesthetic spacing, hierarchical layouts explicitly encode tree structure by positioning nodes at fixed vertical or horizontal levels. This visualization reveals organizational depth, branching patterns, and the overall tree structure at a glance.
""" anyplot.ai
network-hierarchical: Hierarchical Network Graph with Tree Layout
Library: bokeh 3.9.0 | Python 3.13.13
Quality: 95/100 | Updated: 2026-05-17
"""

import os
import sys
import time
from pathlib import Path


# Ensure we import the real bokeh, not this script
sys.path = [p for p in sys.path if p not in ("", os.path.dirname(__file__))]

import numpy as np
from bokeh.io import output_file, save
from bokeh.models import ColumnDataSource, HoverTool, LabelSet, Legend, LegendItem
from bokeh.plotting import figure
from selenium import webdriver
from selenium.webdriver.chrome.options import Options


# Theme tokens
THEME = os.getenv("ANYPLOT_THEME", "light")
PAGE_BG = "#FAF8F1" if THEME == "light" else "#1A1A17"
ELEVATED_BG = "#FFFDF6" if THEME == "light" else "#242420"
INK = "#1A1A17" if THEME == "light" else "#F0EFE8"
INK_SOFT = "#4A4A44" if THEME == "light" else "#B8B7B0"

# Okabe-Ito palette for level differentiation
LEVEL_COLORS = ["#009E73", "#C475FD", "#4467A3", "#BD8233"]

# Data: Software project team hierarchy (24 employees, 4 levels)
np.random.seed(42)

nodes = [
    # Level 0 - CEO
    {"id": 0, "label": "CEO", "level": 0},
    # Level 1 - VPs
    {"id": 1, "label": "VP Engineering", "level": 1},
    {"id": 2, "label": "VP Product", "level": 1},
    {"id": 3, "label": "VP Operations", "level": 1},
    # Level 2 - Directors/Managers
    {"id": 4, "label": "Frontend Dir.", "level": 2},
    {"id": 5, "label": "Backend Dir.", "level": 2},
    {"id": 6, "label": "PM Lead", "level": 2},
    {"id": 7, "label": "UX Lead", "level": 2},
    {"id": 8, "label": "IT Manager", "level": 2},
    {"id": 9, "label": "HR Manager", "level": 2},
    # Level 3 - Team Members
    {"id": 10, "label": "FE Dev 1", "level": 3},
    {"id": 11, "label": "FE Dev 2", "level": 3},
    {"id": 12, "label": "BE Dev 1", "level": 3},
    {"id": 13, "label": "BE Dev 2", "level": 3},
    {"id": 14, "label": "BE Dev 3", "level": 3},
    {"id": 15, "label": "PM 1", "level": 3},
    {"id": 16, "label": "PM 2", "level": 3},
    {"id": 17, "label": "Designer 1", "level": 3},
    {"id": 18, "label": "Designer 2", "level": 3},
    {"id": 19, "label": "IT Support 1", "level": 3},
    {"id": 20, "label": "IT Support 2", "level": 3},
    {"id": 21, "label": "HR Spec 1", "level": 3},
    {"id": 22, "label": "HR Spec 2", "level": 3},
    {"id": 23, "label": "Recruiter", "level": 3},
]

edges = [
    # CEO to VPs
    (0, 1),
    (0, 2),
    (0, 3),
    # VP Engineering to Directors
    (1, 4),
    (1, 5),
    # VP Product to Leads
    (2, 6),
    (2, 7),
    # VP Operations to Managers
    (3, 8),
    (3, 9),
    # Directors to Team Members
    (4, 10),
    (4, 11),
    (5, 12),
    (5, 13),
    (5, 14),
    (6, 15),
    (6, 16),
    (7, 17),
    (7, 18),
    (8, 19),
    (8, 20),
    (9, 21),
    (9, 22),
    (9, 23),
]

# Compute hierarchical layout positions
# Group nodes by level
levels = {}
for node in nodes:
    lvl = node["level"]
    if lvl not in levels:
        levels[lvl] = []
    levels[lvl].append(node)

# Calculate positions: levels spread vertically, nodes at each level spread horizontally
positions = {}
y_spacing = 2.0
for lvl in sorted(levels.keys()):
    nodes_at_level = levels[lvl]
    n = len(nodes_at_level)
    spread = max(n * 1.4, 6)
    x_positions = np.linspace(-spread / 2, spread / 2, n)
    y_pos = -lvl * y_spacing
    for i, node in enumerate(nodes_at_level):
        positions[node["id"]] = (x_positions[i], y_pos)

# Prepare node data
node_x = [positions[n["id"]][0] for n in nodes]
node_y = [positions[n["id"]][1] for n in nodes]
node_labels = [n["label"] for n in nodes]
node_levels = [n["level"] for n in nodes]

# Color by level using Okabe-Ito
node_colors = [LEVEL_COLORS[lvl] for lvl in node_levels]

# Node sizes based on level - larger for better visibility at Level 3
size_map = {0: 95, 1: 80, 2: 70, 3: 65}
node_sizes = [size_map[lvl] for lvl in node_levels]

# Prepare edge data
edge_x0 = [positions[e[0]][0] for e in edges]
edge_y0 = [positions[e[0]][1] for e in edges]
edge_x1 = [positions[e[1]][0] for e in edges]
edge_y1 = [positions[e[1]][1] for e in edges]

# Create figure
p = figure(
    width=4800,
    height=2700,
    title="network-hierarchical · bokeh · anyplot.ai",
    x_axis_label="",
    y_axis_label="",
    tools="",
    toolbar_location=None,
)

# Apply theme-adaptive styling
p.background_fill_color = PAGE_BG
p.border_fill_color = PAGE_BG
p.outline_line_color = INK_SOFT

# Hide axes for cleaner network visualization
p.xaxis.visible = False
p.yaxis.visible = False
p.xgrid.visible = False
p.ygrid.visible = False

# Draw edges
edge_source = ColumnDataSource(data={"x0": edge_x0, "y0": edge_y0, "x1": edge_x1, "y1": edge_y1})
p.segment(x0="x0", y0="y0", x1="x1", y1="y1", source=edge_source, line_width=4, line_color=INK_SOFT, line_alpha=0.4)

# Draw nodes by level
renderers_by_level = {}
level_names = ["CEO", "VPs", "Directors", "Team Members"]

for lvl in range(4):
    lvl_indices = [i for i, n in enumerate(nodes) if n["level"] == lvl]
    lvl_x = [node_x[i] for i in lvl_indices]
    lvl_y = [node_y[i] for i in lvl_indices]
    lvl_labels = [node_labels[i] for i in lvl_indices]
    lvl_sizes = [node_sizes[i] for i in lvl_indices]

    source = ColumnDataSource(
        data={"x": lvl_x, "y": lvl_y, "labels": lvl_labels, "sizes": lvl_sizes, "level": [lvl] * len(lvl_indices)}
    )
    renderer = p.scatter(
        x="x",
        y="y",
        source=source,
        size="sizes",
        fill_color=LEVEL_COLORS[lvl],
        line_color=INK_SOFT,
        line_width=3,
        alpha=0.9,
    )
    renderers_by_level[lvl] = renderer

# Create legend with theme-adaptive styling
legend_items = [
    LegendItem(label=f"Level {lvl}: {level_names[lvl]}", renderers=[renderers_by_level[lvl]]) for lvl in range(4)
]
legend = Legend(
    items=legend_items,
    location="top_right",
    label_text_font_size="26pt",
    label_text_color=INK_SOFT,
    glyph_height=45,
    glyph_width=45,
    spacing=12,
    padding=25,
    border_line_color=INK_SOFT,
    border_line_width=2,
    background_fill_color=ELEVATED_BG,
    background_fill_alpha=0.95,
)
p.add_layout(legend, "right")

# Prepare node data for labels and hover
all_node_source = ColumnDataSource(data={"x": node_x, "y": node_y, "labels": node_labels, "levels": node_levels})

# Add labels to nodes with improved visibility
labels = LabelSet(
    x="x",
    y="y",
    text="labels",
    source=all_node_source,
    text_font_size="26pt",
    text_color=INK,
    text_align="center",
    y_offset=60,
)
p.add_layout(labels)

# Add hover tool for interactivity
hover = HoverTool(tooltips=[("Role", "@labels"), ("Level", "@level")], mode="mouse")
p.add_tools(hover)

# Style title
p.title.text_font_size = "28pt"
p.title.text_color = INK
p.title.align = "center"

# Set plot range with balanced padding
x_vals = list(node_x)
y_vals = list(node_y)
x_padding = 1.0
y_padding = 1.5
p.x_range.start = min(x_vals) - x_padding
p.x_range.end = max(x_vals) + x_padding
p.y_range.start = min(y_vals) - y_padding
p.y_range.end = max(y_vals) + y_padding

# Save HTML output
output_file(f"plot-{THEME}.html")
save(p)

# Screenshot with Selenium for PNG output
W, H = 4800, 2700
opts = Options()
for arg in (
    "--headless=new",
    "--no-sandbox",
    "--disable-dev-shm-usage",
    "--disable-gpu",
    f"--window-size={W},{H}",
    "--hide-scrollbars",
):
    opts.add_argument(arg)
driver = webdriver.Chrome(options=opts)
driver.set_window_size(W, H)
driver.get(f"file://{Path(f'plot-{THEME}.html').resolve()}")
time.sleep(3)
driver.save_screenshot(f"plot-{THEME}.png")
driver.quit()
Runnable source as JSON, for any HTTP client: https://api.anyplot.ai/specs/network-hierarchical/bokeh/code. Any spec id and library id listed in llms-full.txt fit the same URL shape; every URL below is complete and callable.
{
  "spec_id": "network-hierarchical",
  "language": "python",
  "library": "bokeh",
  "page": "https://anyplot.ai/network-hierarchical/python/bokeh",
  "hub": "https://anyplot.ai/network-hierarchical",
  "code_json": "https://api.anyplot.ai/specs/network-hierarchical/bokeh/code",
  "spec_json": "https://api.anyplot.ai/specs/network-hierarchical",
  "render_light_png": "https://storage.googleapis.com/anyplot-images/plots/network-hierarchical/python/bokeh/plot-light.png",
  "render_dark_png": "https://storage.googleapis.com/anyplot-images/plots/network-hierarchical/python/bokeh/plot-dark.png",
  "interactive_light_html": "https://storage.googleapis.com/anyplot-images/plots/network-hierarchical/python/bokeh/plot-light.html",
  "interactive_dark_html": "https://storage.googleapis.com/anyplot-images/plots/network-hierarchical/python/bokeh/plot-dark.html",
  "quality_score": 95.0,
  "license": "MIT",
  "guide": "https://anyplot.ai/llms.txt"
}
Part of Hierarchical Network Graph with Tree Layout on anyplot.ai.