The same plot in 14 other libraries — Python: Altair, Bokeh, lets-plot, Matplotlib, Plotly, plotnine, Seaborn; R: ggplot2; Julia: Makie.jl; JavaScript: Chart.js, D3.js, Apache ECharts, Highcharts, MUI X Charts. Compare all 15 side by side: Parliament Seat Chart in Python, R, Julia and JavaScript.
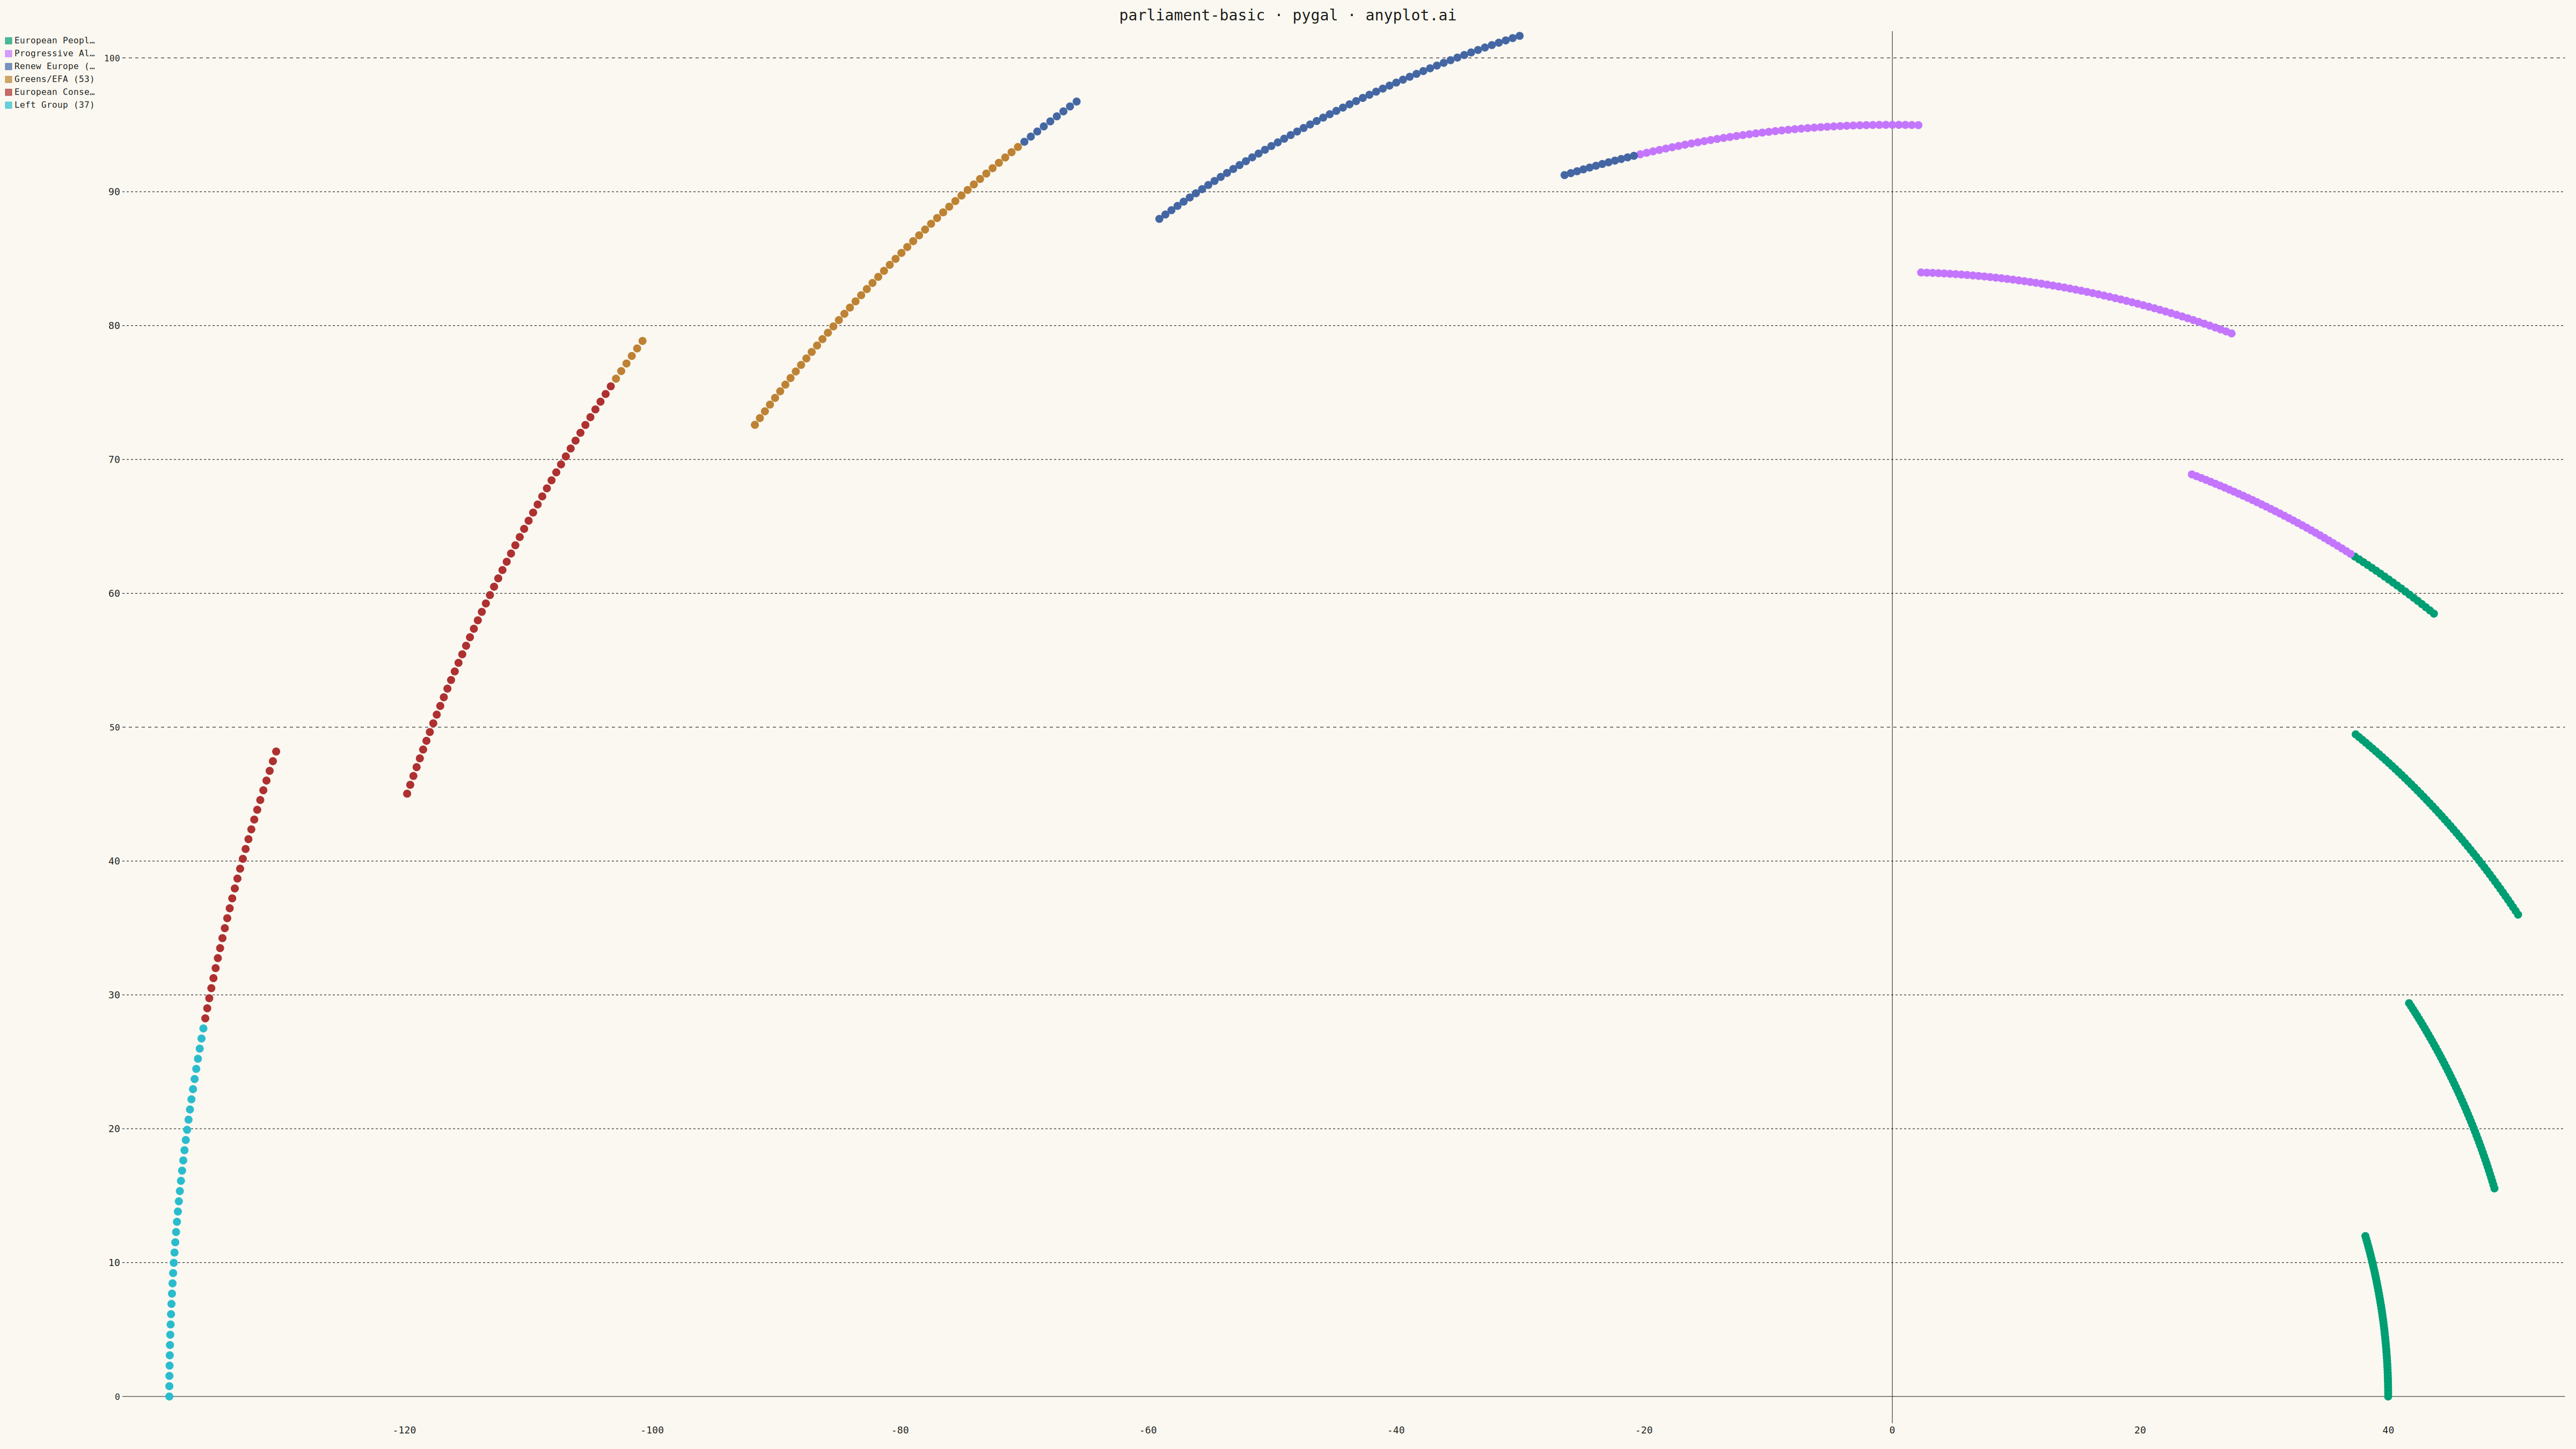
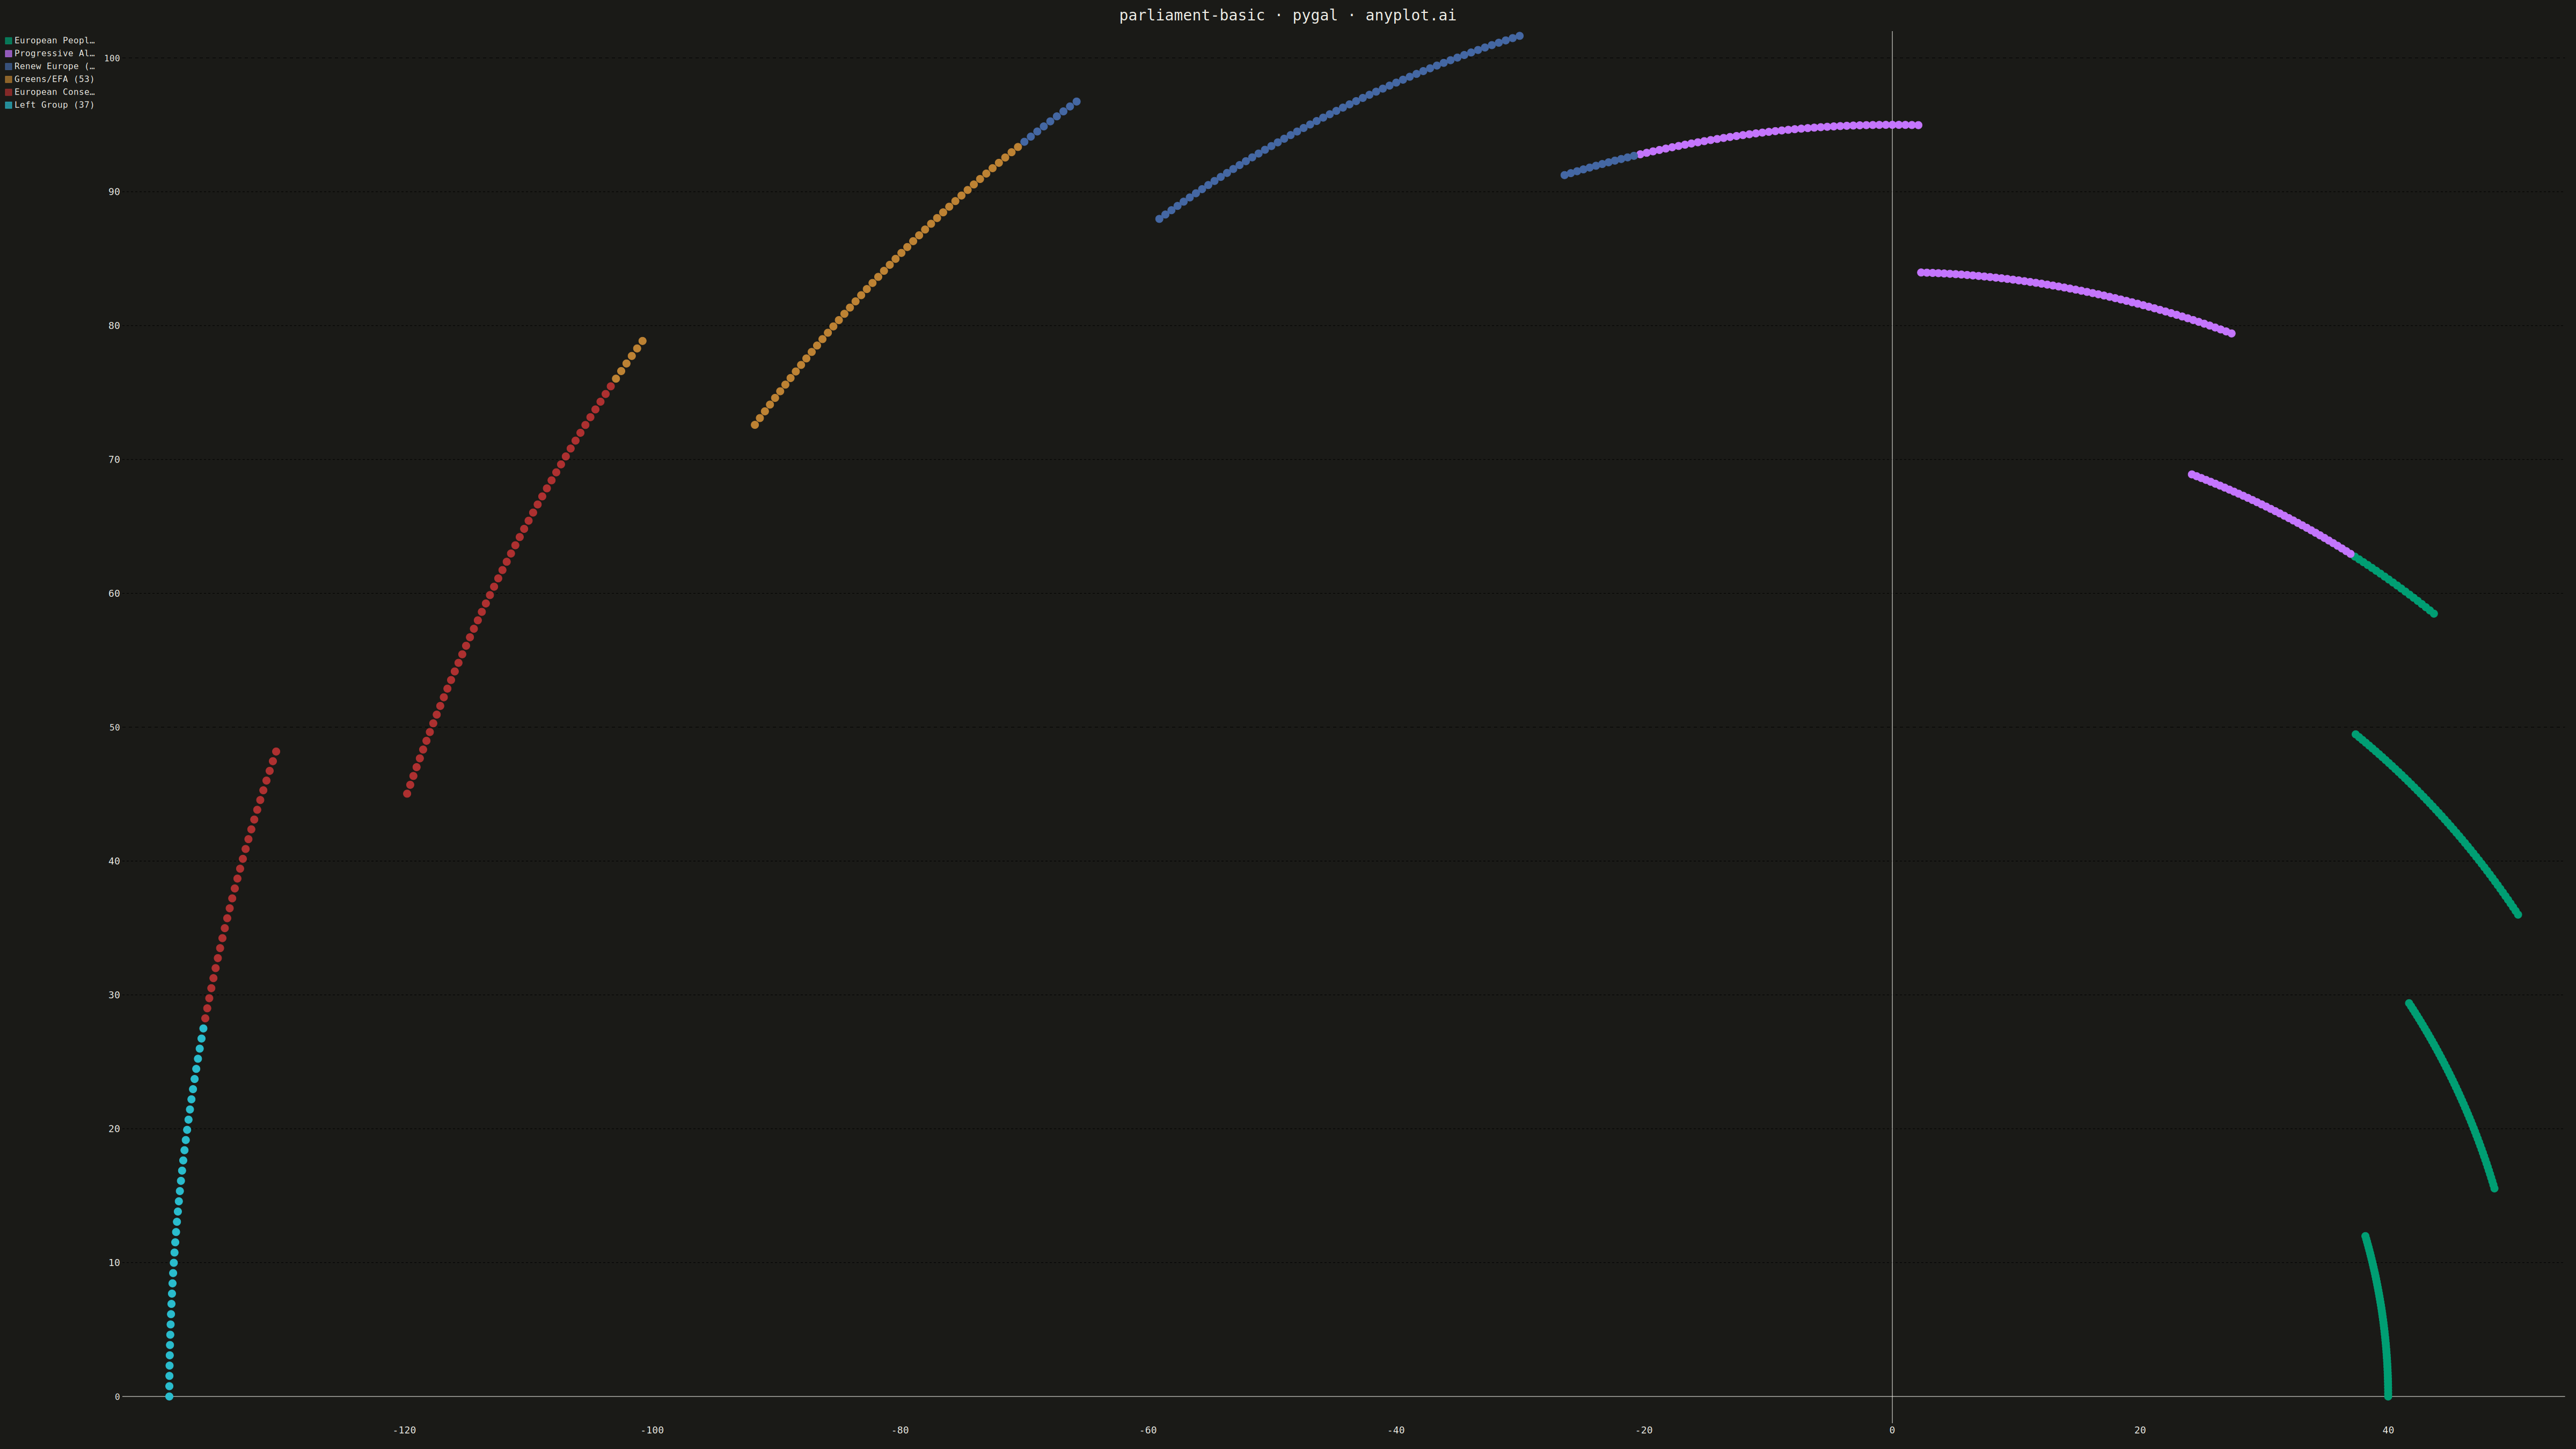
A semicircular parliament seat chart visualizes political party representation by arranging seats in concentric arcs. Each seat is displayed as an individual dot or segment, colored by party affiliation. This visualization is ideal for showing the composition of legislative bodies, election results, and voting bloc distributions at a glance.
""" anyplot.ai
parliament-basic: Parliament Seat Chart
Library: pygal 3.1.0 | Python 3.13.13
Quality: 82/100 | Created: 2026-05-17
"""

import math
import os

# Import pygal using absolute path to avoid shadowing
import sys


_saved_path = sys.path[:]
sys.path = [p for p in sys.path if p not in ("", ".") and "parliament-basic" not in p]
try:
    import pygal
    from pygal.style import Style
finally:
    sys.path = _saved_path

# Theme tokens
THEME = os.getenv("ANYPLOT_THEME", "light")
PAGE_BG = "#FAF8F1" if THEME == "light" else "#1A1A17"
INK = "#1A1A17" if THEME == "light" else "#F0EFE8"
INK_MUTED = "#6B6A63" if THEME == "light" else "#A8A79F"

# Okabe-Ito palette (first series ALWAYS #009E73)
IMPRINT = ["#009E73", "#C475FD", "#4467A3", "#BD8233", "#AE3030", "#2ABCCD", "#954477"]

# Parliament data: European Parliament 2024
parties_data = [
    {"name": "European People's Party", "seats": 188},
    {"name": "Progressive Alliance", "seats": 136},
    {"name": "Renew Europe", "seats": 77},
    {"name": "Greens/EFA", "seats": 53},
    {"name": "European Conservatives", "seats": 78},
    {"name": "Left Group", "seats": 37},
]


def parliament_layout(parties, num_rows=10):
    """Generate semicircular parliament seat positions in concentric arcs"""
    seats_list = []
    total_seats = sum(p["seats"] for p in parties)

    current_seat = 0
    for party_idx, party in enumerate(parties):
        for _ in range(party["seats"]):
            # Angle within semicircle (0 to π)
            angle = (current_seat / max(total_seats - 1, 1)) * math.pi

            # Row/arc number based on seat position
            row = min(current_seat // (total_seats // num_rows), num_rows - 1)
            radius = 40 + row * 11

            # Convert to Cartesian coordinates
            x = radius * math.cos(angle)
            y = radius * math.sin(angle)

            seats_list.append({"x": x, "y": y, "party_idx": party_idx, "party": party["name"]})

            current_seat += 1

    return seats_list


# Create custom style
custom_style = Style(
    background=PAGE_BG,
    plot_background=PAGE_BG,
    foreground=INK,
    foreground_strong=INK,
    foreground_subtle=INK_MUTED,
    colors=tuple(IMPRINT),
    title_font_size=28,
    label_font_size=18,
    major_label_font_size=16,
    legend_font_size=16,
)

# Create XY scatter chart for parliament layout
# Use range=custom to fit all data, and show_dots to enable dot rendering
chart = pygal.XY(
    width=4800,
    height=2700,
    style=custom_style,
    title="parliament-basic · pygal · anyplot.ai",
    show_legend=True,
    dots_size=7,
    show_dots=True,
    implicit_units=False,
    range=(0, 100),
)

# Disable stroke (lines) between points
chart.stroke = False

# Generate seat positions
seats = parliament_layout(parties_data)

# Add data by party (each party is a separate series with individual points)
for party_idx, party in enumerate(parties_data):
    party_seats = [s for s in seats if s["party_idx"] == party_idx]
    data = [(s["x"], s["y"]) for s in party_seats]
    chart.add(f"{party['name']} ({party['seats']})", data)

# Save outputs
chart.render_to_png(f"plot-{THEME}.png")
with open(f"plot-{THEME}.html", "wb") as f:
    f.write(chart.render())
Runnable source as JSON, for any HTTP client: https://api.anyplot.ai/specs/parliament-basic/pygal/code. Any spec id and library id listed in llms-full.txt fit the same URL shape; every URL below is complete and callable.
{
  "spec_id": "parliament-basic",
  "language": "python",
  "library": "pygal",
  "page": "https://anyplot.ai/parliament-basic/python/pygal",
  "hub": "https://anyplot.ai/parliament-basic",
  "code_json": "https://api.anyplot.ai/specs/parliament-basic/pygal/code",
  "spec_json": "https://api.anyplot.ai/specs/parliament-basic",
  "render_light_png": "https://storage.googleapis.com/anyplot-images/plots/parliament-basic/python/pygal/plot-light.png",
  "render_dark_png": "https://storage.googleapis.com/anyplot-images/plots/parliament-basic/python/pygal/plot-dark.png",
  "interactive_light_html": "https://storage.googleapis.com/anyplot-images/plots/parliament-basic/python/pygal/plot-light.html",
  "interactive_dark_html": "https://storage.googleapis.com/anyplot-images/plots/parliament-basic/python/pygal/plot-dark.html",
  "quality_score": 82.0,
  "license": "MIT",
  "guide": "https://anyplot.ai/llms.txt"
}
Part of Parliament Seat Chart on anyplot.ai.