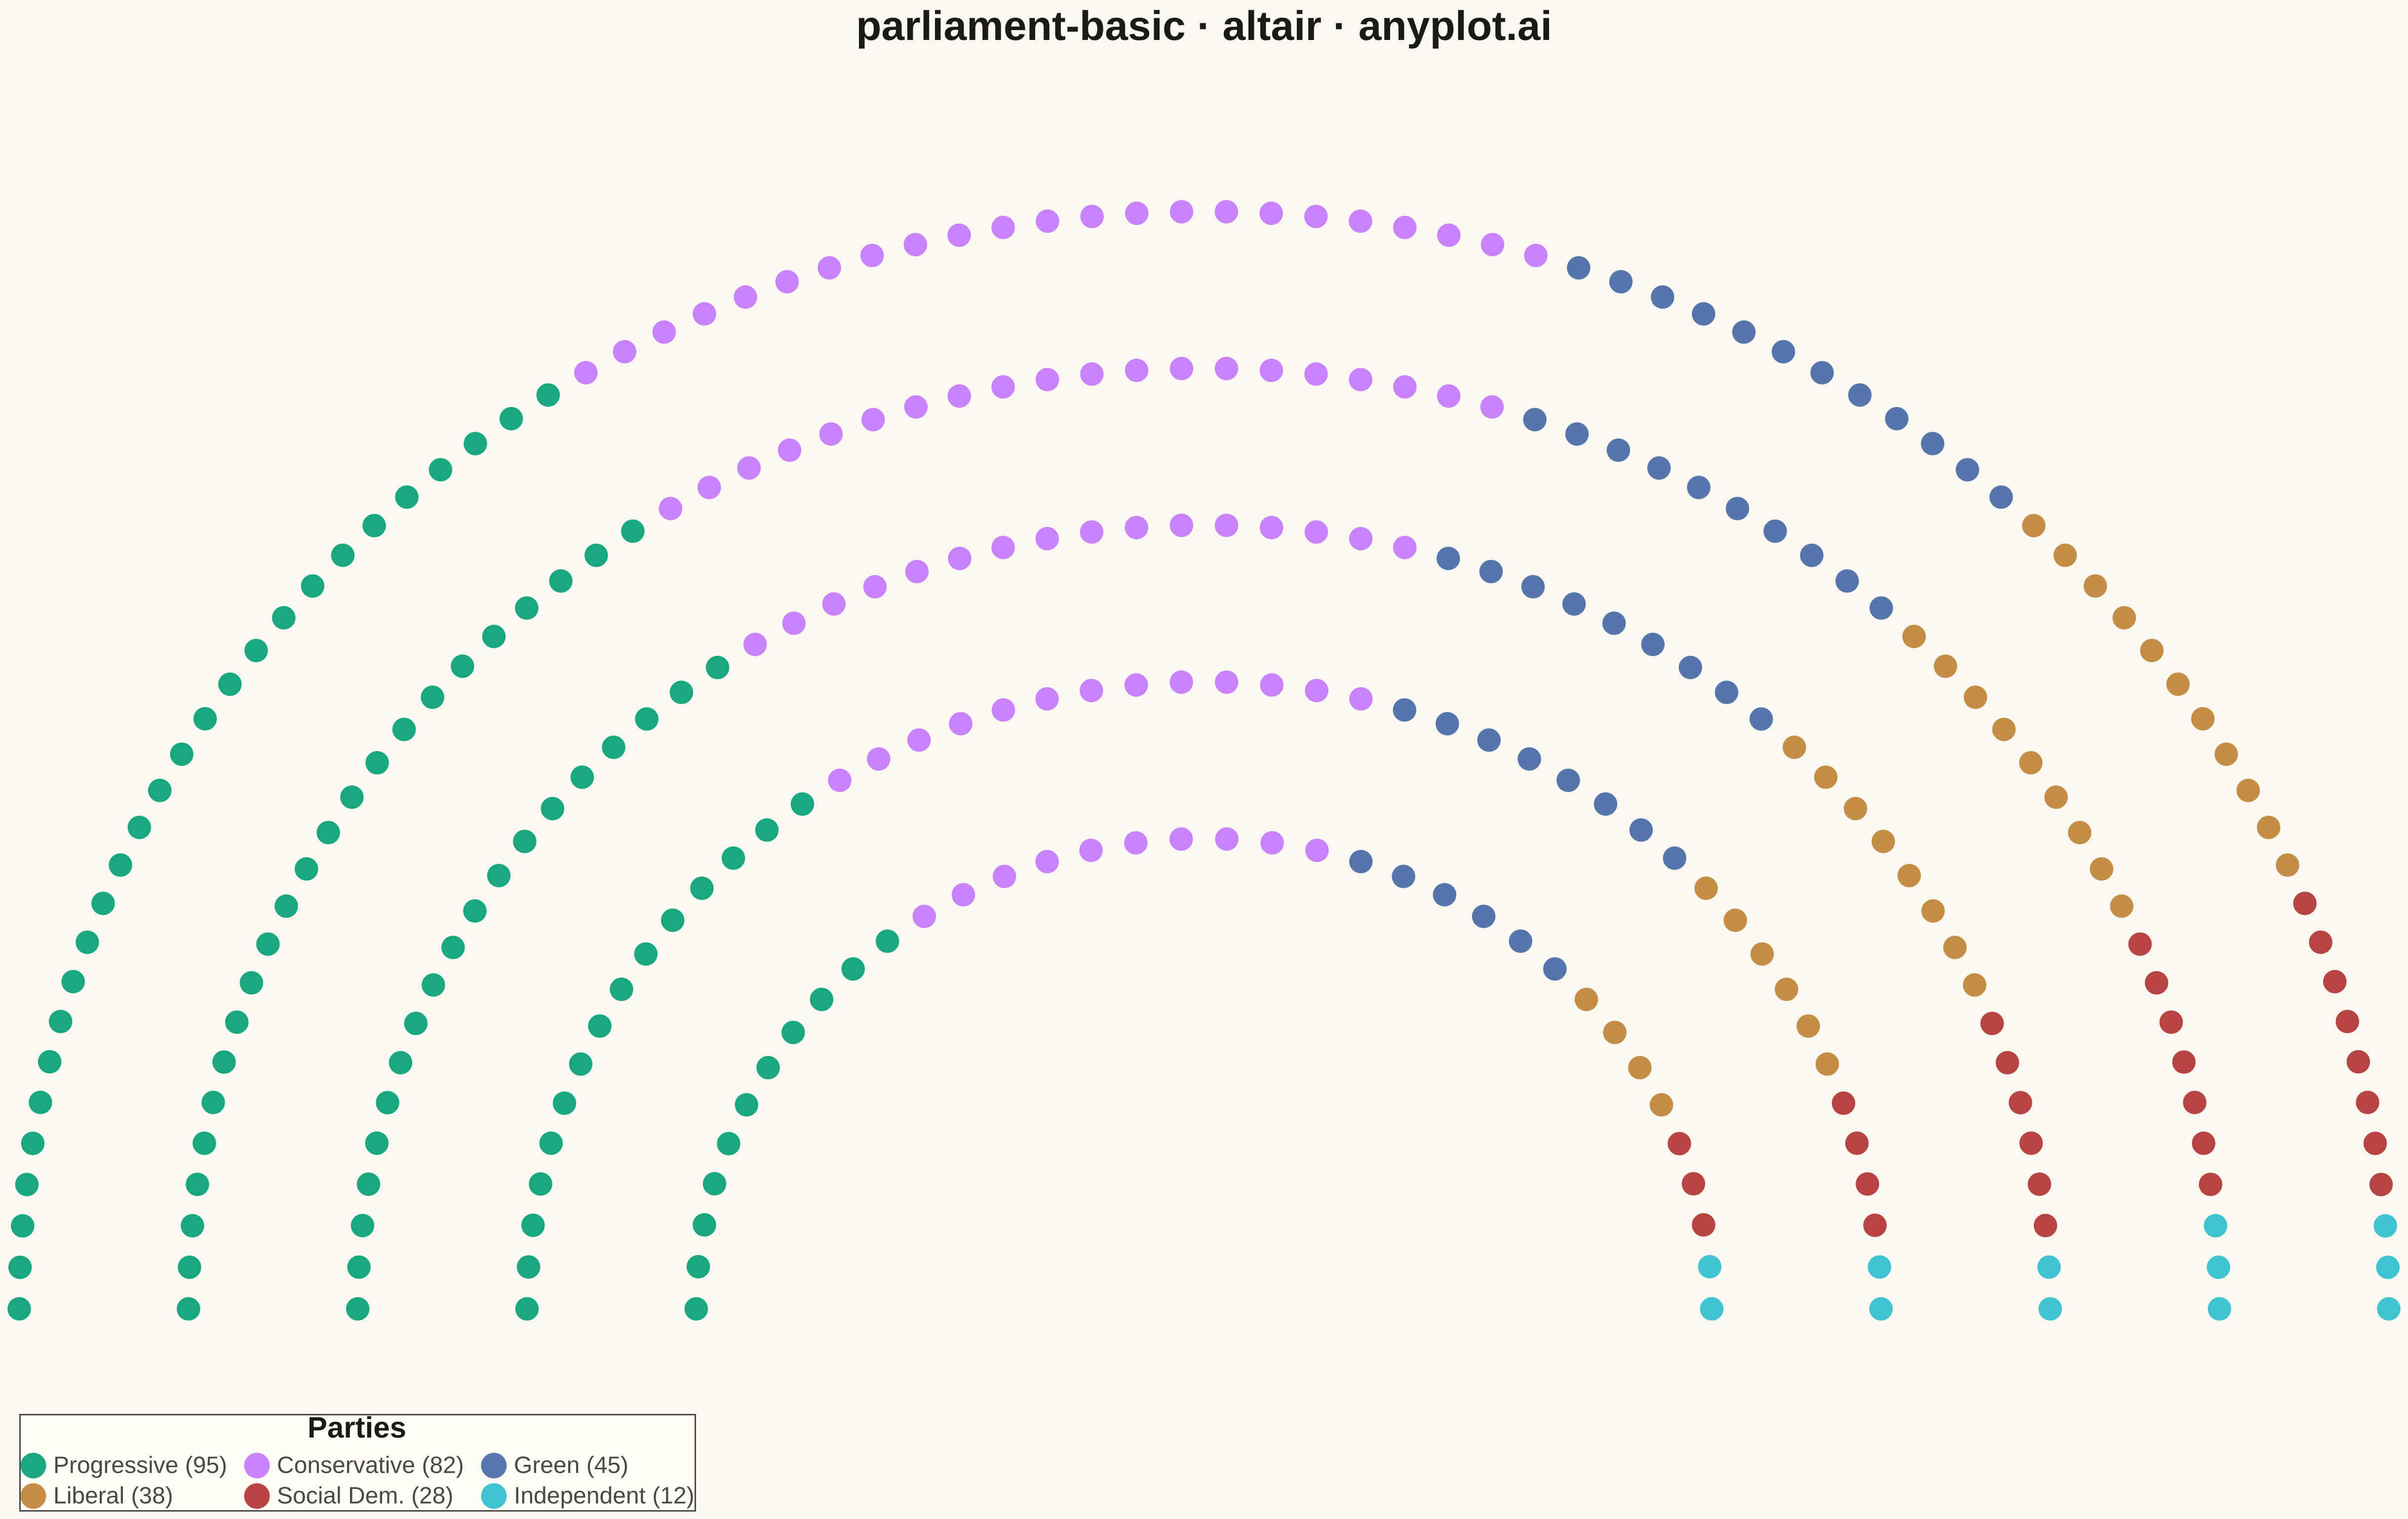
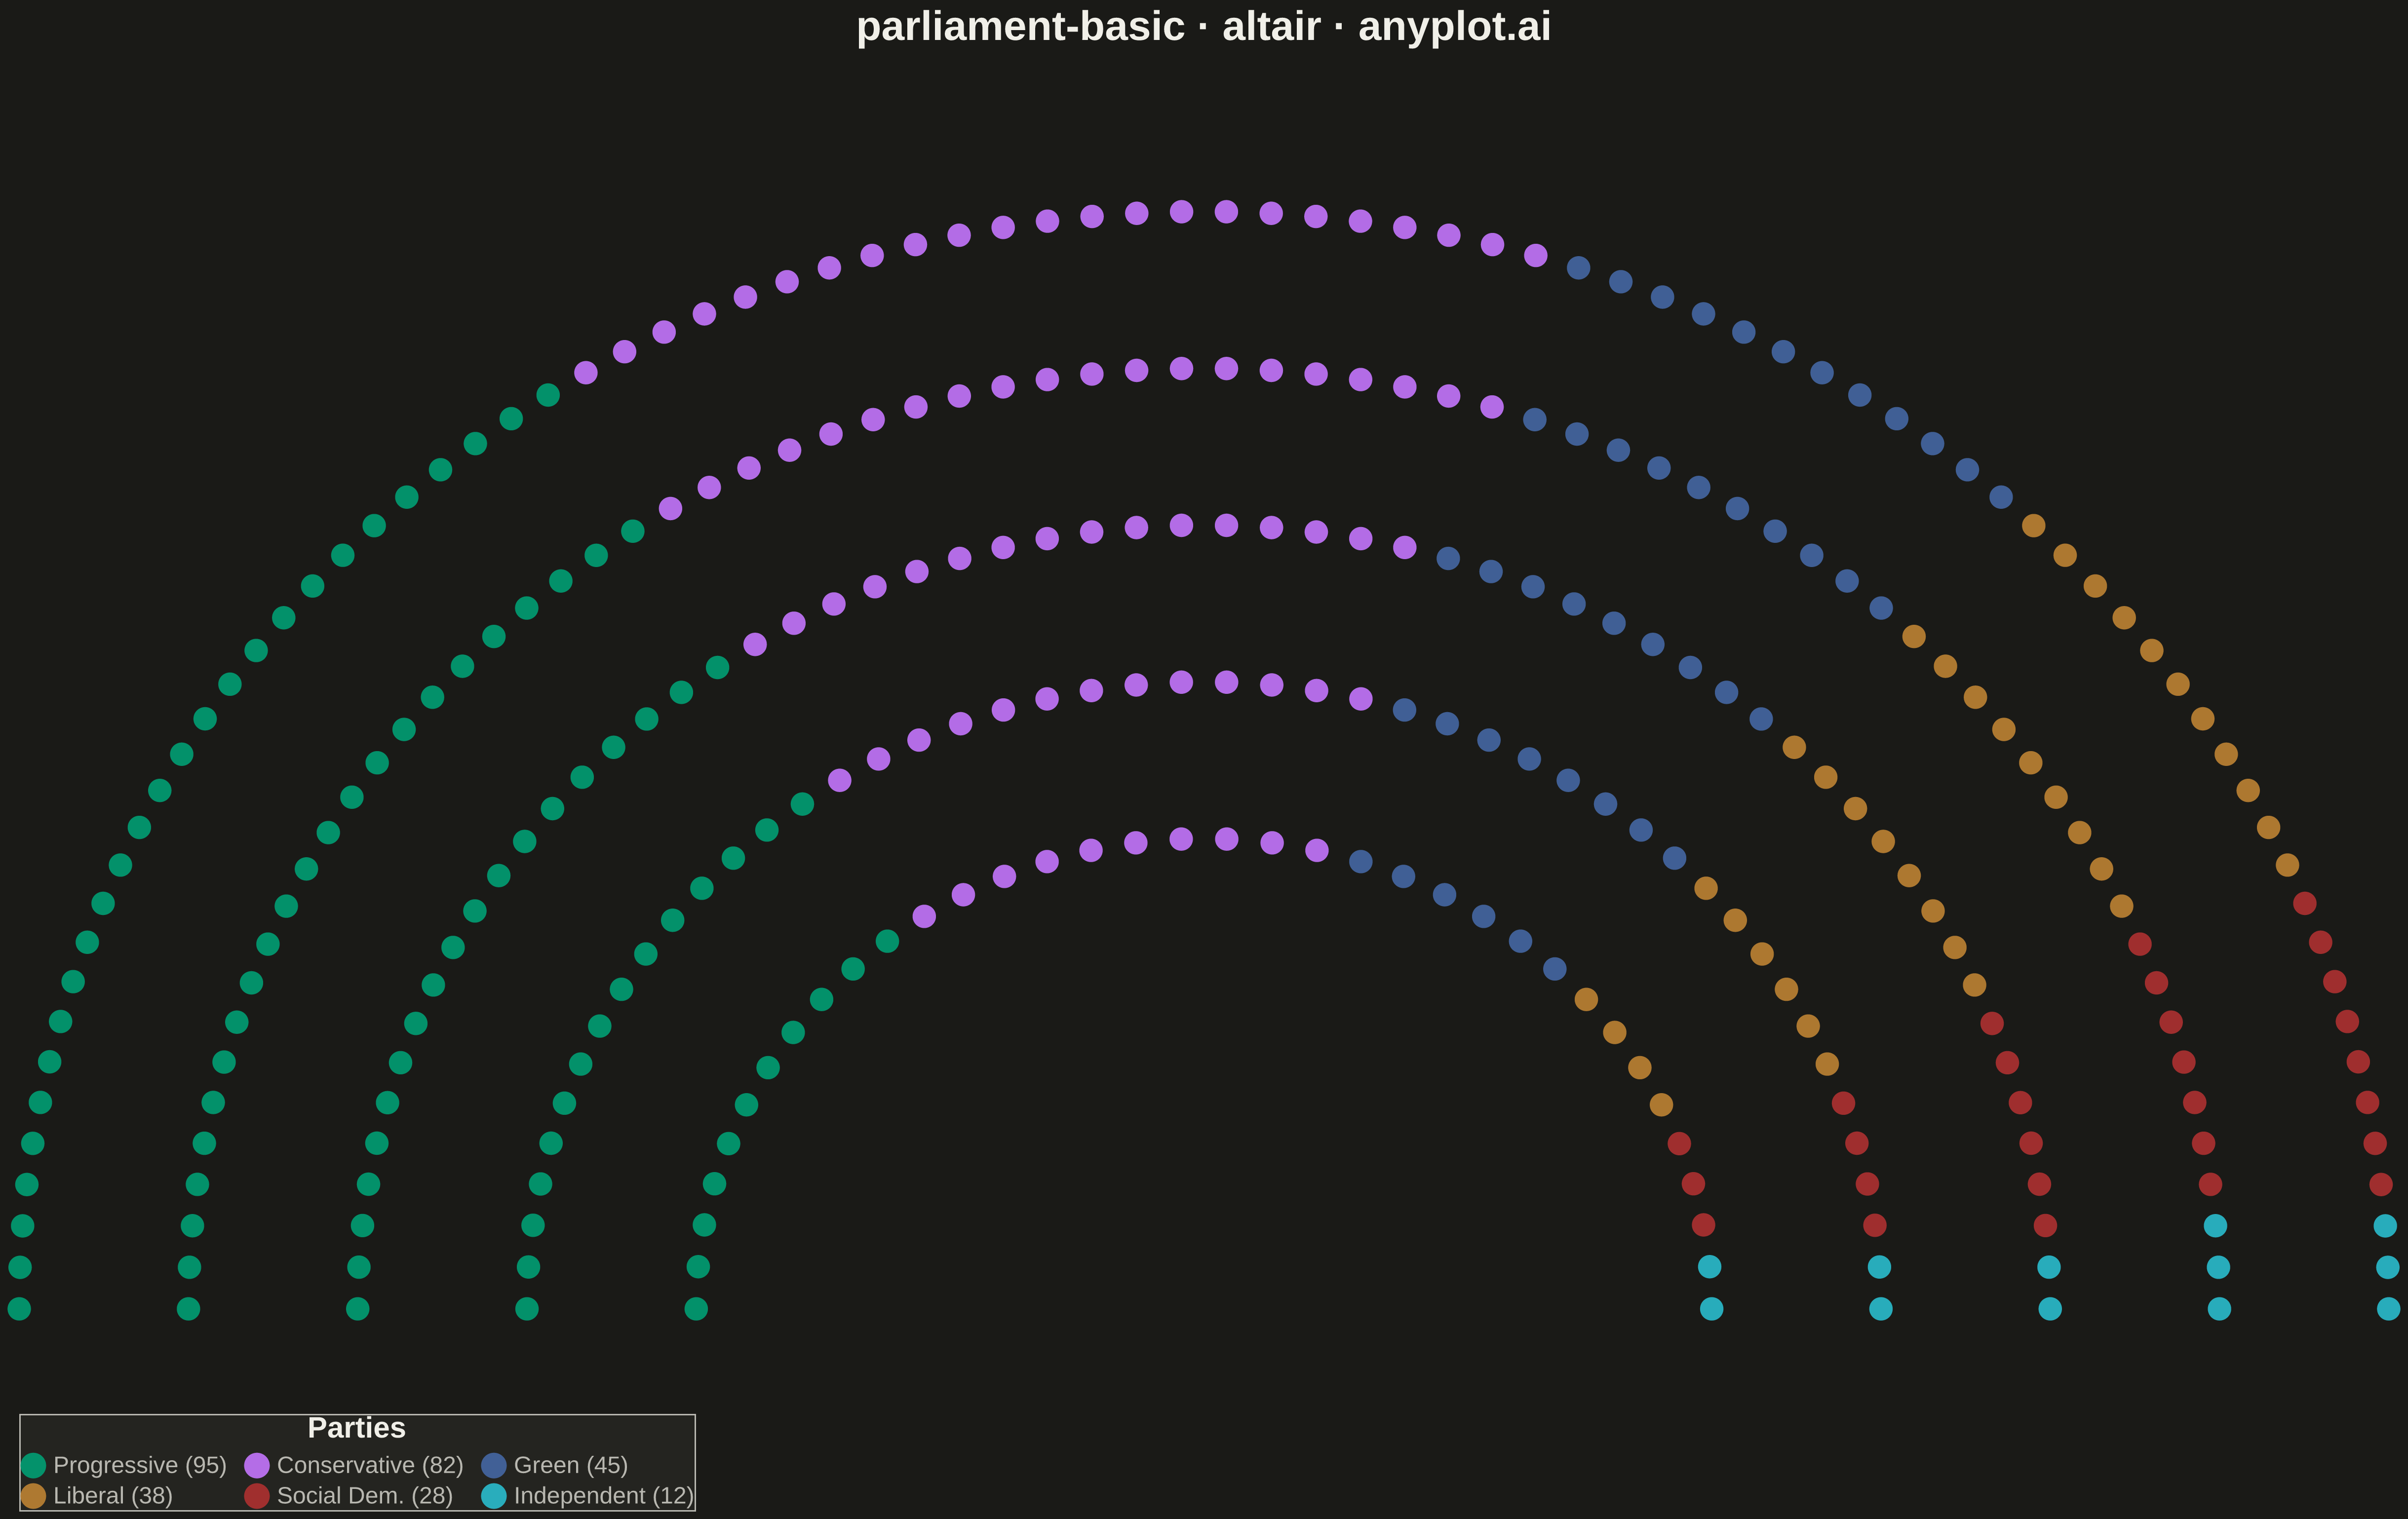
A semicircular parliament seat chart visualizes political party representation by arranging seats in concentric arcs. Each seat is displayed as an individual dot or segment, colored by party affiliation. This visualization is ideal for showing the composition of legislative bodies, election results, and voting bloc distributions at a glance.
""" anyplot.ai
parliament-basic: Parliament Seat Chart
Library: altair 6.1.0 | Python 3.13.13
Quality: 88/100 | Updated: 2026-05-17
"""

import os
import site
import sys
from pathlib import Path

import numpy as np
import pandas as pd


# Ensure the real altair library is imported, not this script
site_packages = [p for p in site.getsitepackages() if "site-packages" in p]
if site_packages:
    sys.path.insert(0, site_packages[0])

import altair as alt


# Get the directory where this script is located
SCRIPT_DIR = Path(__file__).parent

THEME = os.getenv("ANYPLOT_THEME", "light")
PAGE_BG = "#FAF8F1" if THEME == "light" else "#1A1A17"
ELEVATED_BG = "#FFFDF6" if THEME == "light" else "#242420"
INK = "#1A1A17" if THEME == "light" else "#F0EFE8"
INK_SOFT = "#4A4A44" if THEME == "light" else "#B8B7B0"

np.random.seed(42)

# Data: Fictional parliament with 300 seats
# Using Okabe-Ito palette, starting with #009E73
parties = [
    {"party": "Progressive", "seats": 95, "color": "#009E73"},
    {"party": "Conservative", "seats": 82, "color": "#C475FD"},
    {"party": "Green", "seats": 45, "color": "#4467A3"},
    {"party": "Liberal", "seats": 38, "color": "#BD8233"},
    {"party": "Social Dem.", "seats": 28, "color": "#AE3030"},
    {"party": "Independent", "seats": 12, "color": "#2ABCCD"},
]

total_seats = sum(p["seats"] for p in parties)

# Generate seat positions in semicircular arcs
n_rows = 5
inner_radius = 3.0
row_spacing = 1.0

# Calculate seats per row (more seats in outer rows)
row_weights = [(inner_radius + i * row_spacing) for i in range(n_rows)]
total_weight = sum(row_weights)
seats_per_row = [max(1, int(total_seats * w / total_weight)) for w in row_weights]

# Adjust to match total exactly
diff = total_seats - sum(seats_per_row)
for i in range(abs(diff)):
    if diff > 0:
        seats_per_row[-(i % n_rows) - 1] += 1
    else:
        seats_per_row[i % n_rows] -= 1

# Generate positions for each seat
all_seats = []
seat_idx = 0

for row_idx, n_seats_in_row in enumerate(seats_per_row):
    radius = inner_radius + row_idx * row_spacing
    angles = np.linspace(np.pi, 0, n_seats_in_row)
    for angle in angles:
        x = radius * np.cos(angle)
        y = radius * np.sin(angle)
        all_seats.append({"x": x, "y": y, "seat_idx": seat_idx, "angle": angle})
        seat_idx += 1

# Sort seats by angle descending (pi to 0 = left to right)
seats_sorted = sorted(all_seats, key=lambda s: -s["angle"])

# Assign parties to seats in order
seat_data = []
current_idx = 0
for party_info in parties:
    party_name = party_info["party"]
    party_color = party_info["color"]
    n_seats = party_info["seats"]
    for _ in range(n_seats):
        if current_idx < len(seats_sorted):
            seat = seats_sorted[current_idx]
            seat_data.append(
                {"x": seat["x"], "y": seat["y"], "party": party_name, "color": party_color, "seats_count": n_seats}
            )
            current_idx += 1

df = pd.DataFrame(seat_data)

# Create color scale from party data
party_colors = {p["party"]: p["color"] for p in parties}
color_domain = list(party_colors.keys())
color_range = list(party_colors.values())

# Create legend labels with seat counts
legend_labels = {p["party"]: f"{p['party']} ({p['seats']})" for p in parties}
df["party_label"] = df["party"].map(legend_labels)

# Create the parliament chart
chart = (
    alt.Chart(df)
    .mark_circle(size=250, opacity=0.9)
    .encode(
        x=alt.X("x:Q", axis=None),
        y=alt.Y("y:Q", axis=None, scale=alt.Scale(domain=[-0.5, inner_radius + n_rows * row_spacing])),
        color=alt.Color(
            "party_label:N",
            scale=alt.Scale(domain=[legend_labels[p["party"]] for p in parties], range=color_range),
            legend=alt.Legend(
                title="Parties",
                titleFontSize=20,
                labelFontSize=16,
                labelLimit=200,
                symbolSize=300,
                orient="bottom",
                direction="horizontal",
                columns=3,
                titleOrient="top",
                titleAnchor="middle",
            ),
        ),
        tooltip=["party:N", "seats_count:Q"],
    )
    .properties(
        width=1600,
        height=900,
        title=alt.Title("parliament-basic · altair · anyplot.ai", fontSize=28, anchor="middle"),
        background=PAGE_BG,
    )
    .configure_view(fill=PAGE_BG, stroke=INK_SOFT, strokeWidth=0)
    .configure_axis(
        domainColor=INK_SOFT, tickColor=INK_SOFT, gridColor=INK, gridOpacity=0.10, labelColor=INK_SOFT, titleColor=INK
    )
    .configure_title(color=INK, fontSize=28)
    .configure_legend(fillColor=ELEVATED_BG, strokeColor=INK_SOFT, labelColor=INK_SOFT, titleColor=INK)
)

chart.save(str(SCRIPT_DIR / f"plot-{THEME}.png"), scale_factor=3.0)
chart.save(str(SCRIPT_DIR / f"plot-{THEME}.html"))
Runnable source as JSON, for any HTTP client: https://api.anyplot.ai/specs/parliament-basic/altair/code. Any spec id and library id listed in llms-full.txt fit the same URL shape; every URL below is complete and callable.
{
  "spec_id": "parliament-basic",
  "language": "python",
  "library": "altair",
  "page": "https://anyplot.ai/parliament-basic/python/altair",
  "hub": "https://anyplot.ai/parliament-basic",
  "code_json": "https://api.anyplot.ai/specs/parliament-basic/altair/code",
  "spec_json": "https://api.anyplot.ai/specs/parliament-basic",
  "render_light_png": "https://storage.googleapis.com/anyplot-images/plots/parliament-basic/python/altair/plot-light.png",
  "render_dark_png": "https://storage.googleapis.com/anyplot-images/plots/parliament-basic/python/altair/plot-dark.png",
  "interactive_light_html": "https://storage.googleapis.com/anyplot-images/plots/parliament-basic/python/altair/plot-light.html",
  "interactive_dark_html": "https://storage.googleapis.com/anyplot-images/plots/parliament-basic/python/altair/plot-dark.html",
  "quality_score": 88.0,
  "license": "MIT",
  "guide": "https://anyplot.ai/llms.txt"
}
Part of Parliament Seat Chart on anyplot.ai.