The same plot in 14 other libraries — JavaScript: Chart.js, D3.js, Highcharts, MUI X Charts; Python: Altair, Bokeh, lets-plot, Matplotlib, Plotly, plotnine, Pygal, Seaborn; R: ggplot2; Julia: Makie.jl. Compare all 15 side by side: Parliament Seat Chart in Python, R, Julia and JavaScript.
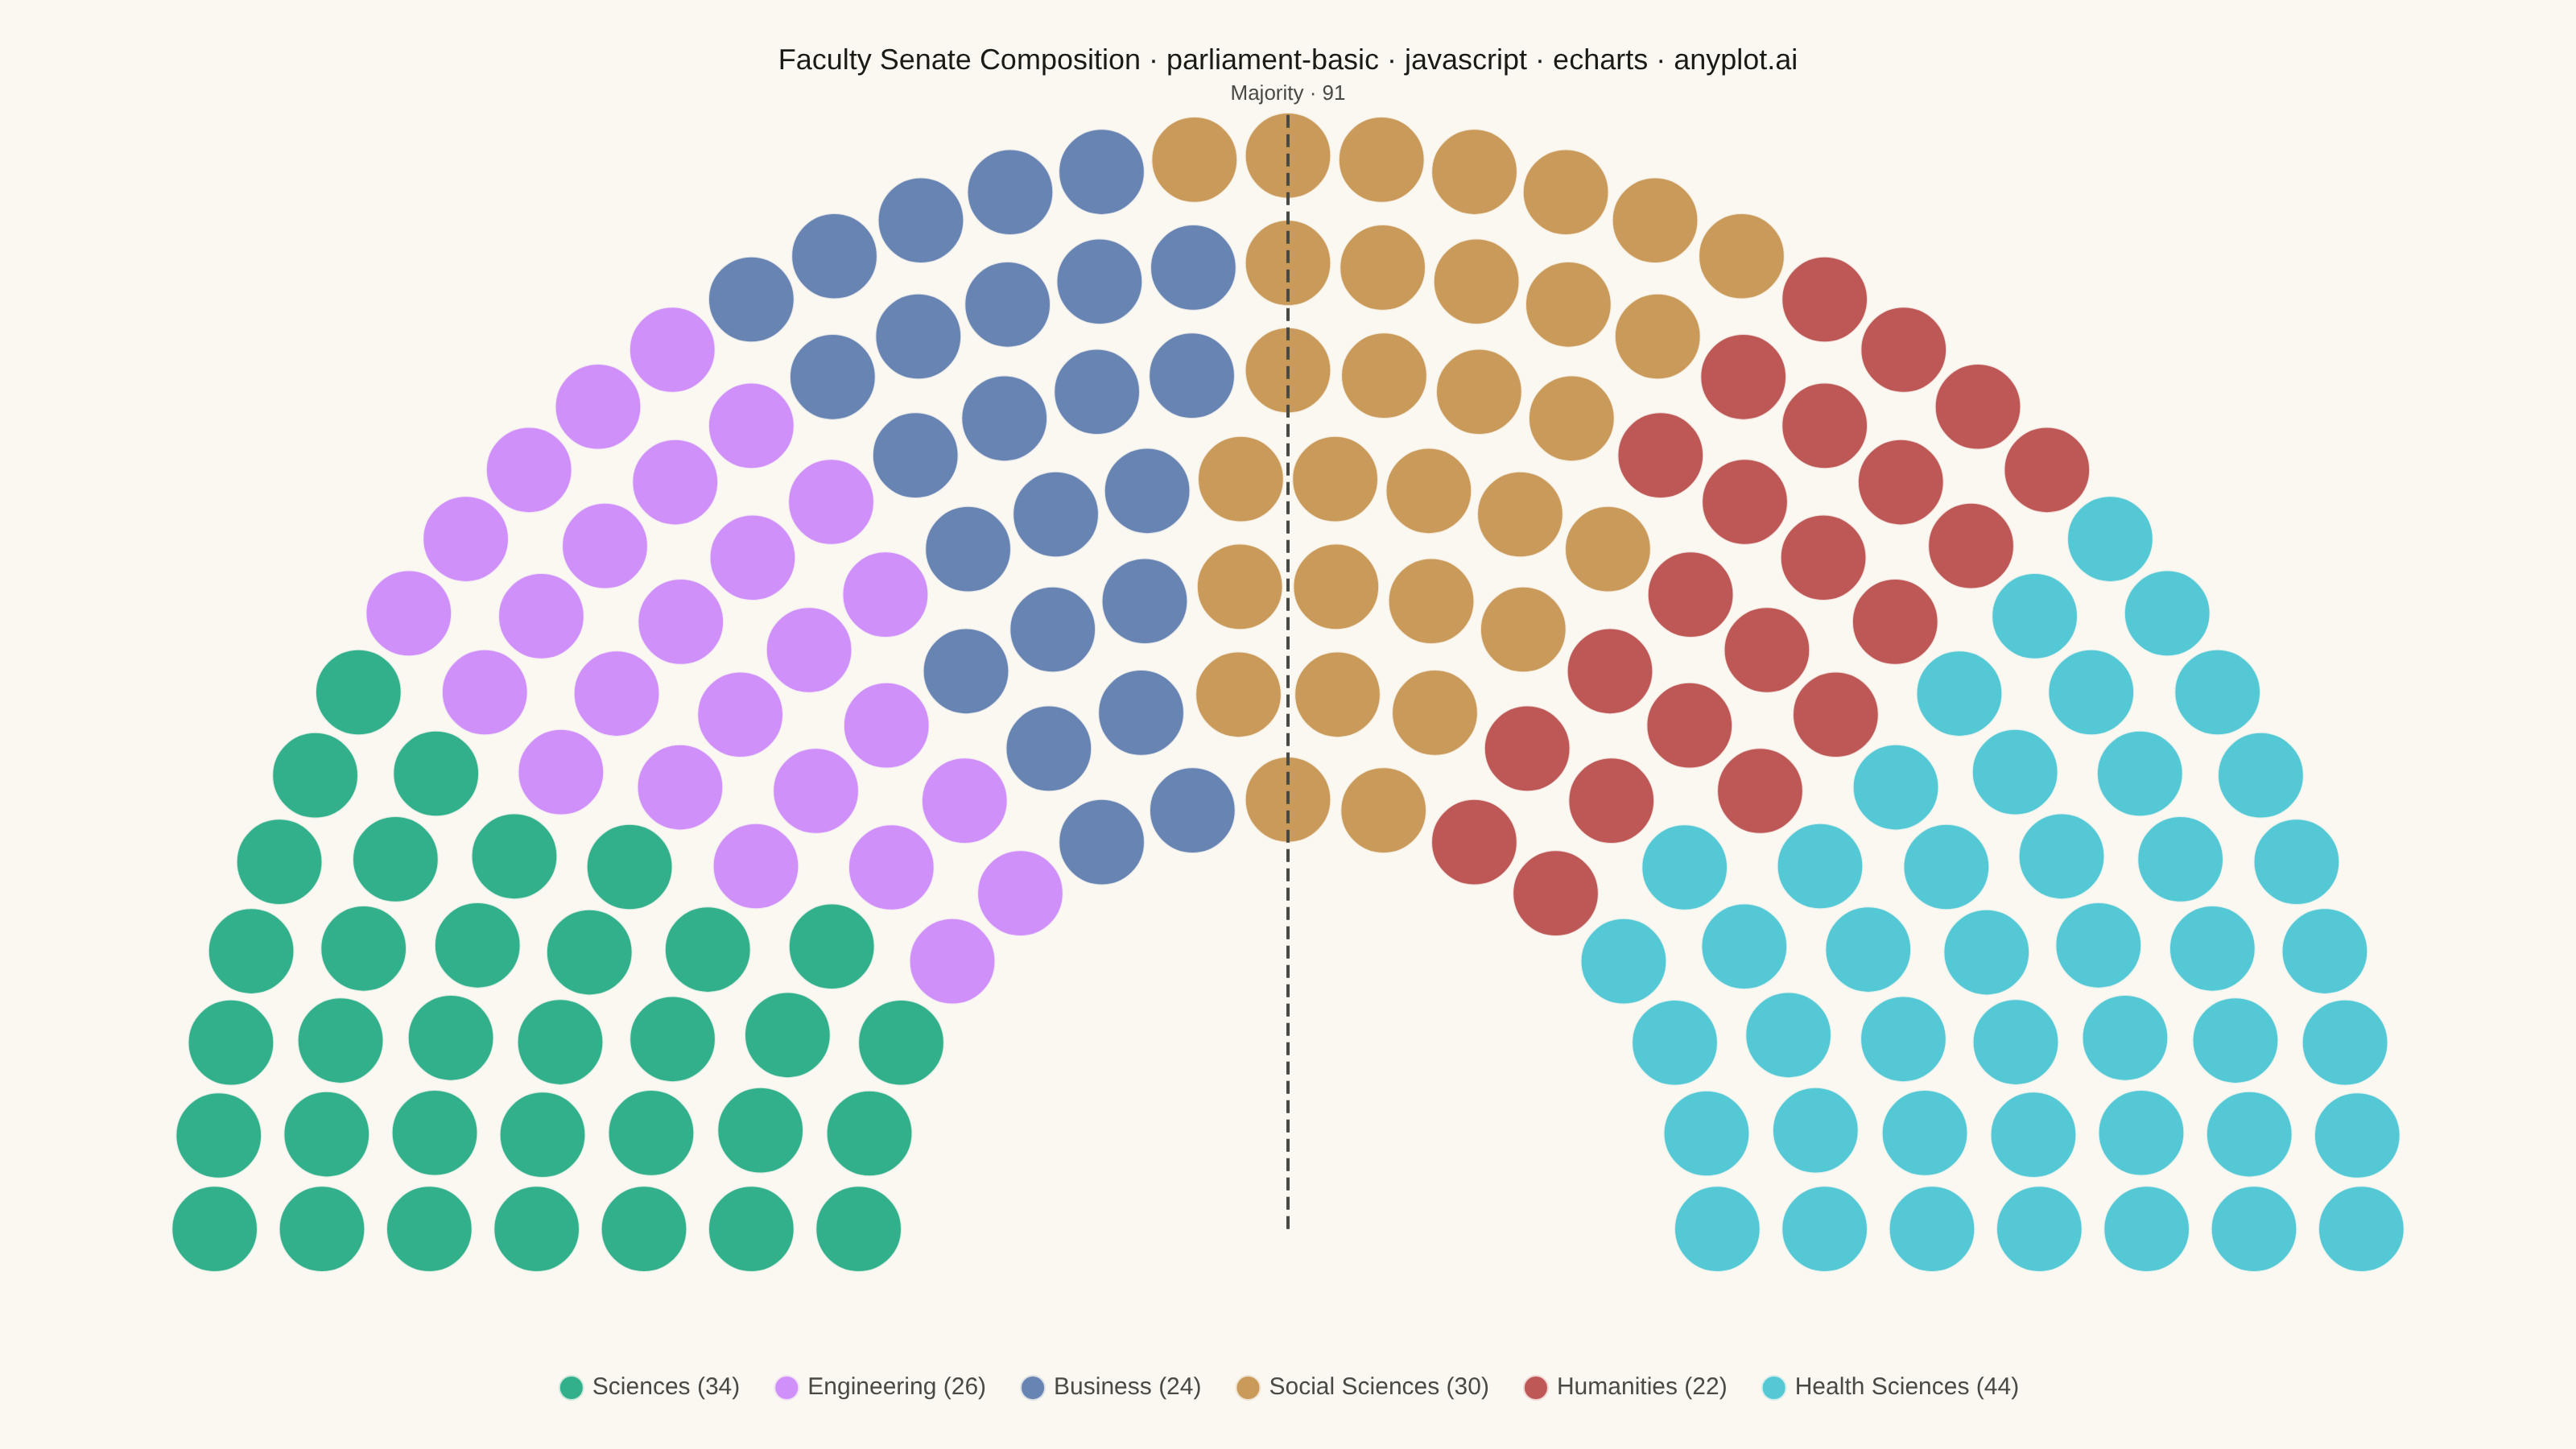
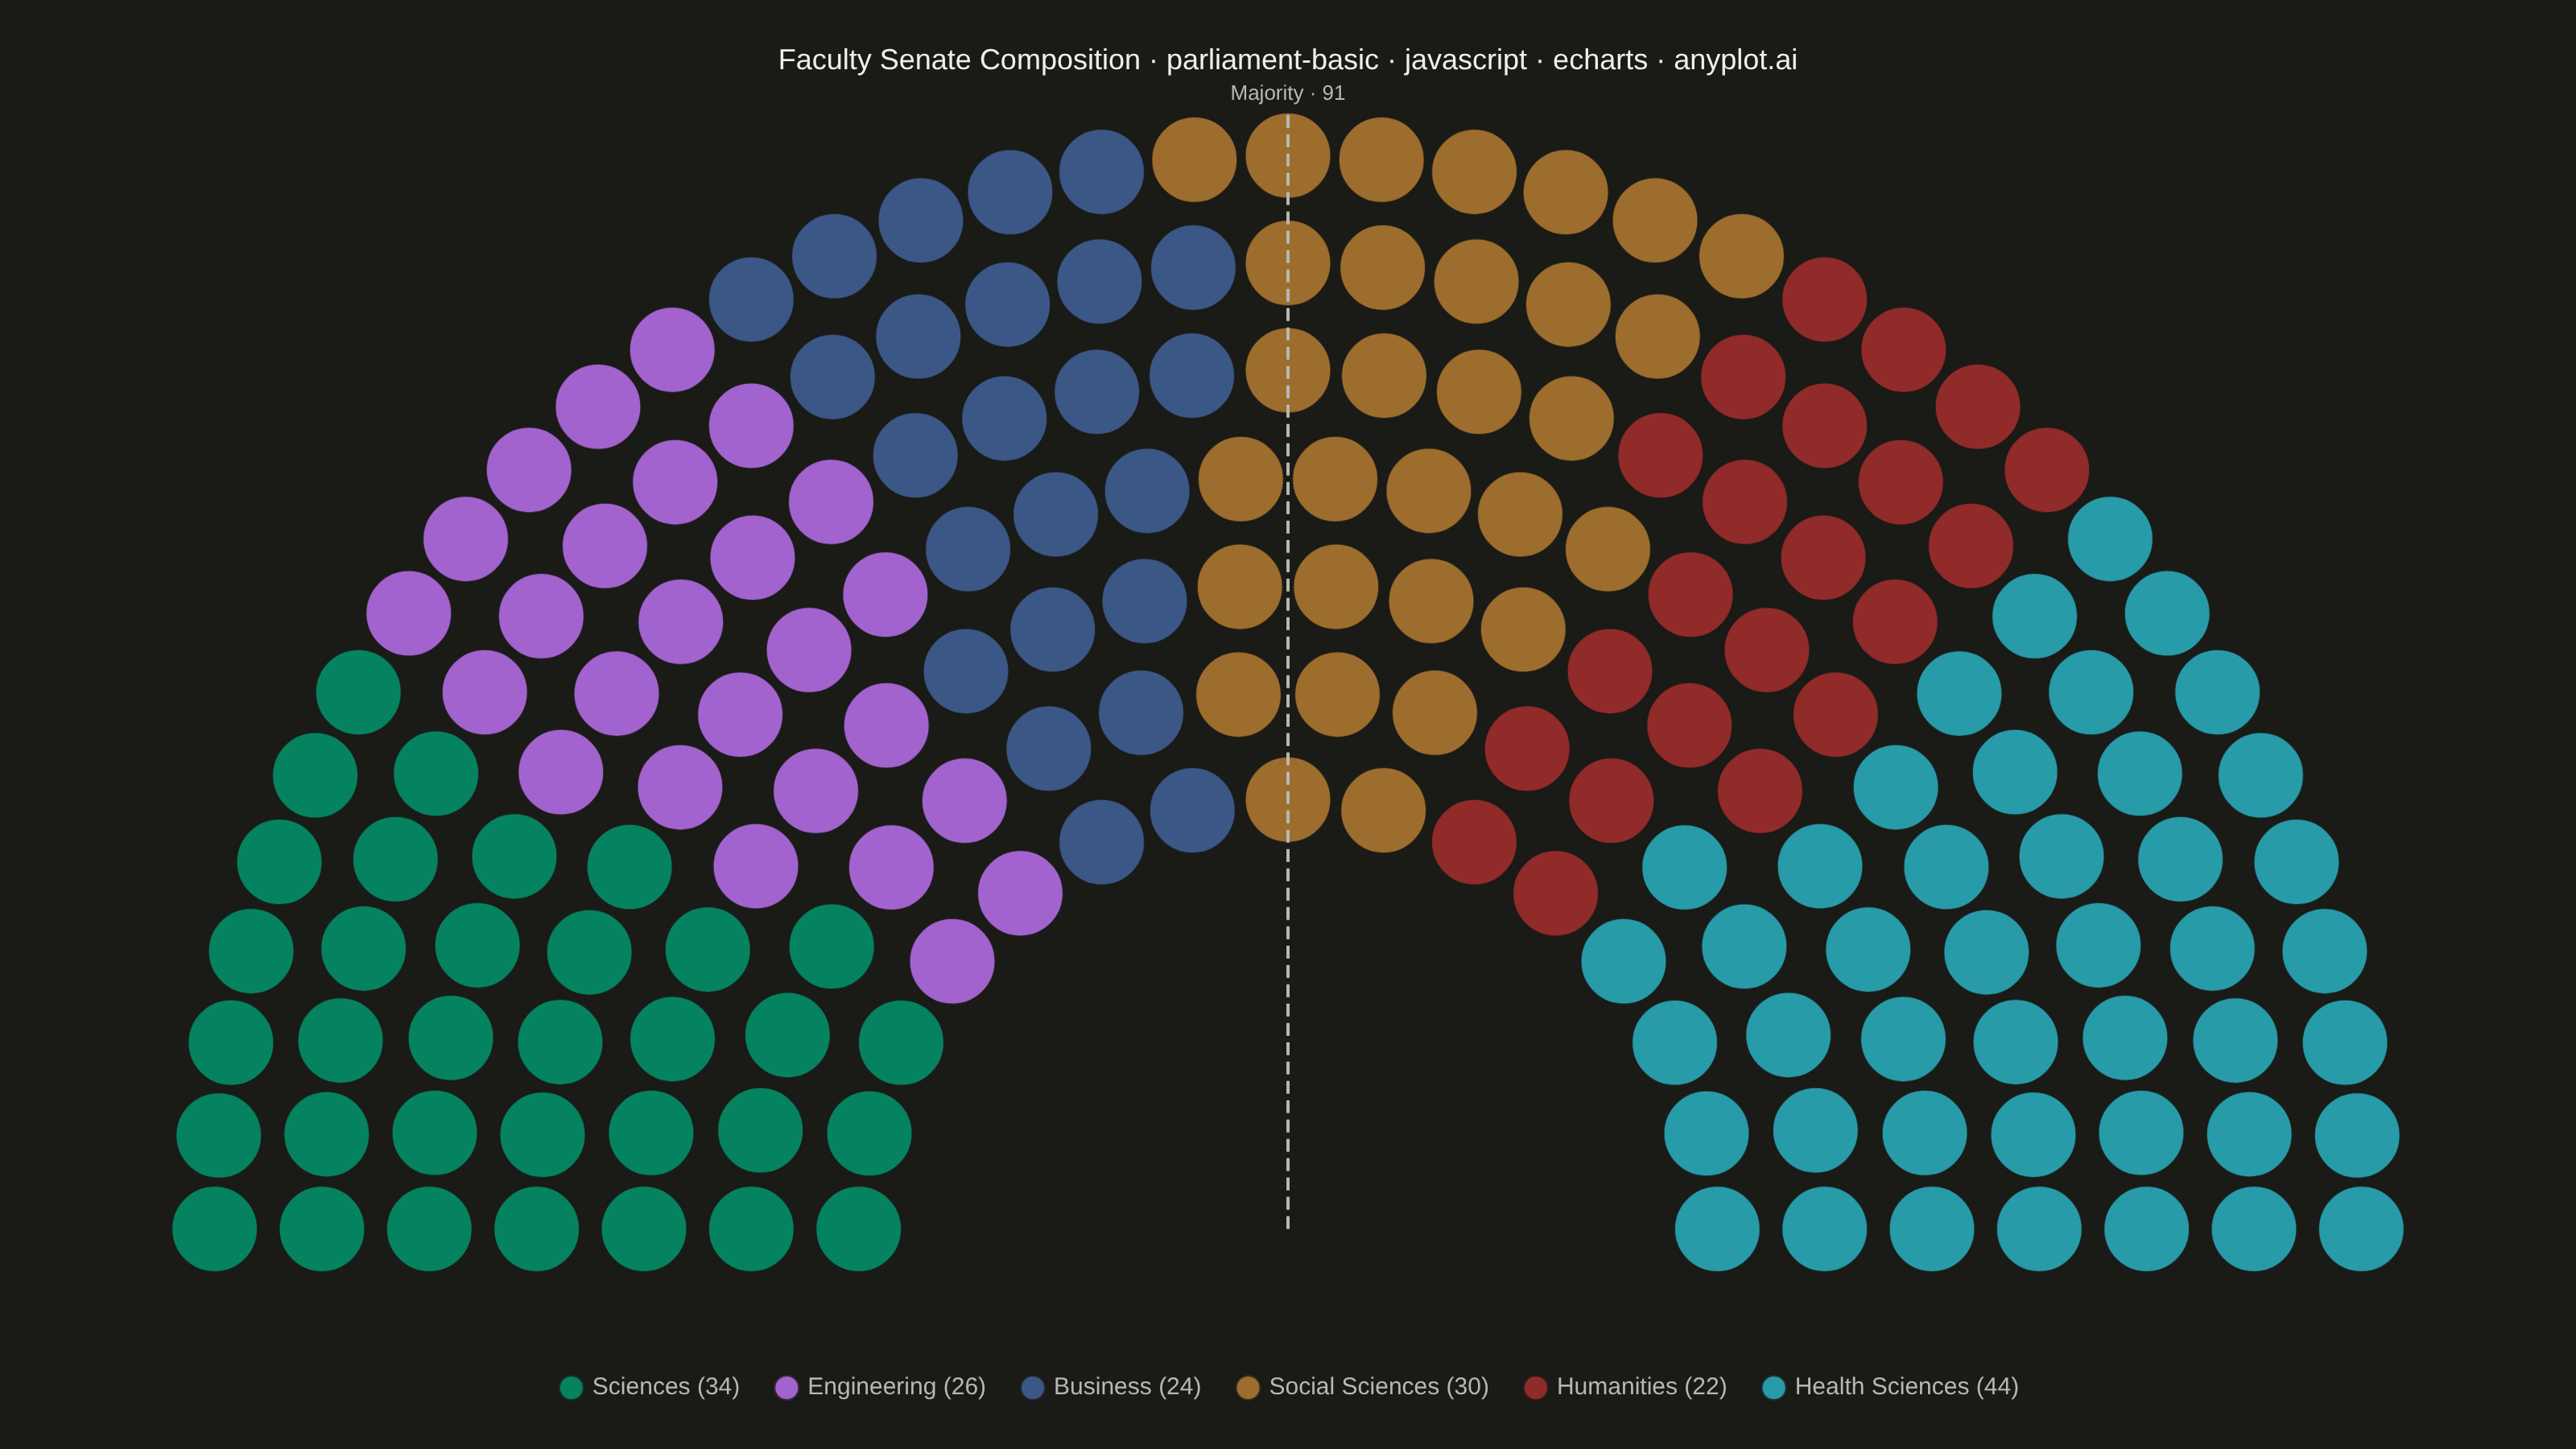
A semicircular parliament seat chart visualizes political party representation by arranging seats in concentric arcs. Each seat is displayed as an individual dot or segment, colored by party affiliation. This visualization is ideal for showing the composition of legislative bodies, election results, and voting bloc distributions at a glance.
// anyplot.ai
// parliament-basic: Parliament Seat Chart
// Library: echarts 6.1.0 | JavaScript 22.23.2
// Quality: 92/100 | Created: 2026-09-02

const t = window.ANYPLOT_TOKENS;
const size = window.ANYPLOT_SIZE;

// --- Data (in-memory, deterministic) ----------------------------------------
// Faculty Senate composition by academic division — a semicircular "seat
// chart" reads identically whether the body is a legislature or, as here, a
// university senate, so we pick the non-political application from the spec.
const divisions = [
  { name: "Sciences", seats: 34 },
  { name: "Engineering", seats: 26 },
  { name: "Business", seats: 24 },
  { name: "Social Sciences", seats: 30 },
  { name: "Humanities", seats: 22 },
  { name: "Health Sciences", seats: 44 },
];
const totalSeats = divisions.reduce((sum, d) => sum + d.seats, 0);

// --- Seat layout: concentric arcs, equal-density row algorithm --------------
const outerRadius = 100;
const innerRadius = 40;
const numRows = Math.min(12, Math.max(4, Math.round(Math.sqrt(totalSeats) / 2)));
const rowSpacing = (outerRadius - innerRadius) / (numRows - 1);

// Row weight is proportional to arc length (∝ radius) at fixed 180° span, so
// seats-per-row scales with radius and dot spacing stays roughly constant.
const rowRadii = Array.from({ length: numRows }, (_, i) => innerRadius + i * rowSpacing);
const weightSum = rowRadii.reduce((sum, r) => sum + r, 0);
const seatsPerRow = rowRadii.map((r) => Math.round((totalSeats * r) / weightSum));
seatsPerRow[seatsPerRow.length - 1] += totalSeats - seatsPerRow.reduce((sum, n) => sum + n, 0);

const seatPositions = [];
rowRadii.forEach((radius, rowIndex) => {
  const count = seatsPerRow[rowIndex];
  for (let j = 0; j < count; j += 1) {
    const angleDeg = count === 1 ? 90 : 180 - (j * 180) / (count - 1);
    const angleRad = (angleDeg * Math.PI) / 180;
    seatPositions.push({
      x: radius * Math.cos(angleRad),
      y: radius * Math.sin(angleRad),
      angle: angleDeg,
    });
  }
});
// Left-to-right fill: sort by angle (180°=left … 0°=right), then hand out
// contiguous blocks to each division in list order.
seatPositions.sort((a, b) => b.angle - a.angle);

let cursor = 0;
const seriesData = divisions.map((division, i) => {
  const block = seatPositions.slice(cursor, cursor + division.seats);
  cursor += division.seats;
  return {
    name: division.name,
    type: "scatter",
    data: block.map((p) => [p.x, p.y]),
    itemStyle: { color: t.palette[i], borderColor: t.pageBg, borderWidth: 1 },
  };
});

// --- Coordinate system: preserve 1:1 aspect so seats stay circular ----------
const dotDiameter = rowSpacing * 0.8;
const pad = dotDiameter / 2;
const xRange = 2 * (outerRadius + pad);
const yRange = outerRadius + 2 * pad;

// --- Majority threshold marker (spec's optional 50%+1 highlight) -----------
// A dashed radial markLine through the seat that tips the chamber into a
// majority, using ECharts' coord-pair markLine (not a plain scatter point).
const majoritySeats = Math.floor(totalSeats / 2) + 1;
const thresholdSeat = seatPositions[majoritySeats - 1];
const thresholdAngleRad = (thresholdSeat.angle * Math.PI) / 180;
const thresholdRadius = outerRadius + pad;
const thresholdEnd = {
  x: thresholdRadius * Math.cos(thresholdAngleRad),
  y: thresholdRadius * Math.sin(thresholdAngleRad),
};
const majorityMarkerSeries = {
  type: "scatter",
  data: [],
  silent: true,
  tooltip: { show: false },
  markLine: {
    silent: true,
    symbol: "none",
    lineStyle: { color: t.inkSoft, type: "dashed", width: 2 },
    label: {
      show: true,
      formatter: () => `Majority · ${majoritySeats}`,
      color: t.inkSoft,
      fontSize: 13,
    },
    data: [[{ coord: [0, 0] }, { coord: [thresholdEnd.x, thresholdEnd.y] }]],
  },
};

const topReserved = 70;
const bottomReserved = 110;
const sideReserved = 80;
const availableW = size.width - 2 * sideReserved;
const availableH = size.height - topReserved - bottomReserved;
const scale = Math.min(availableW / xRange, availableH / yRange);
const gridWidth = scale * xRange;
const gridHeight = scale * yRange;
const gridLeft = sideReserved + (availableW - gridWidth) / 2;
const gridTop = topReserved + (availableH - gridHeight) / 2;

// --- Title (length-scaled per anyplot title-fontsize rule) ------------------
const titleText = "Faculty Senate Composition · parliament-basic · javascript · echarts · anyplot.ai";
const titleFontSize = Math.round(22 * Math.min(1, 67 / titleText.length));

// --- Init ---------------------------------------------------------------
const chart = echarts.init(document.getElementById("container"));

// --- Option ------------------------------------------------------------
chart.setOption({
  animation: false,
  color: t.palette,
  backgroundColor: "transparent",
  title: {
    text: titleText,
    left: "center",
    top: 24,
    textStyle: { color: t.ink, fontSize: titleFontSize, fontWeight: 500 },
  },
  legend: {
    bottom: 24,
    left: "center",
    itemWidth: 16,
    itemHeight: 16,
    textStyle: { color: t.inkSoft, fontSize: 15 },
    itemGap: 20,
    formatter: (name) => {
      const division = divisions.find((d) => d.name === name);
      return division ? `${name} (${division.seats})` : name;
    },
  },
  tooltip: {
    trigger: "item",
    backgroundColor: t.elevatedBg,
    borderColor: t.grid,
    textStyle: { color: t.ink },
    formatter: (params) => {
      const division = divisions.find((d) => d.name === params.seriesName);
      if (!division) return "";
      const pct = ((division.seats / totalSeats) * 100).toFixed(1);
      return `<strong>${division.name}</strong><br/>${division.seats} seats (${pct}%)`;
    },
  },
  grid: { left: gridLeft, top: gridTop, width: gridWidth, height: gridHeight },
  xAxis: {
    type: "value",
    min: -(outerRadius + pad),
    max: outerRadius + pad,
    show: false,
  },
  yAxis: {
    type: "value",
    min: -pad,
    max: outerRadius + pad,
    show: false,
  },
  series: [
    ...seriesData.map((s) => ({
      ...s,
      symbolSize: dotDiameter * scale,
    })),
    majorityMarkerSeries,
  ],
});
Runnable source as JSON, for any HTTP client: https://api.anyplot.ai/specs/parliament-basic/echarts/code. Any spec id and library id listed in llms-full.txt fit the same URL shape; every URL below is complete and callable.
{
  "spec_id": "parliament-basic",
  "language": "javascript",
  "library": "echarts",
  "page": "https://anyplot.ai/parliament-basic/javascript/echarts",
  "hub": "https://anyplot.ai/parliament-basic",
  "code_json": "https://api.anyplot.ai/specs/parliament-basic/echarts/code",
  "spec_json": "https://api.anyplot.ai/specs/parliament-basic",
  "render_light_png": "https://storage.googleapis.com/anyplot-images/plots/parliament-basic/javascript/echarts/plot-light.png",
  "render_dark_png": "https://storage.googleapis.com/anyplot-images/plots/parliament-basic/javascript/echarts/plot-dark.png",
  "interactive_light_html": "https://storage.googleapis.com/anyplot-images/plots/parliament-basic/javascript/echarts/plot-light.html",
  "interactive_dark_html": "https://storage.googleapis.com/anyplot-images/plots/parliament-basic/javascript/echarts/plot-dark.html",
  "quality_score": 92.0,
  "license": "MIT",
  "guide": "https://anyplot.ai/llms.txt"
}
Part of Parliament Seat Chart on anyplot.ai.