The same plot in 14 other libraries — JavaScript: Chart.js, D3.js, Apache ECharts, MUI X Charts; Python: Altair, Bokeh, lets-plot, Matplotlib, Plotly, plotnine, Pygal, Seaborn; R: ggplot2; Julia: Makie.jl. Compare all 15 side by side: Parliament Seat Chart in Python, R, Julia and JavaScript.
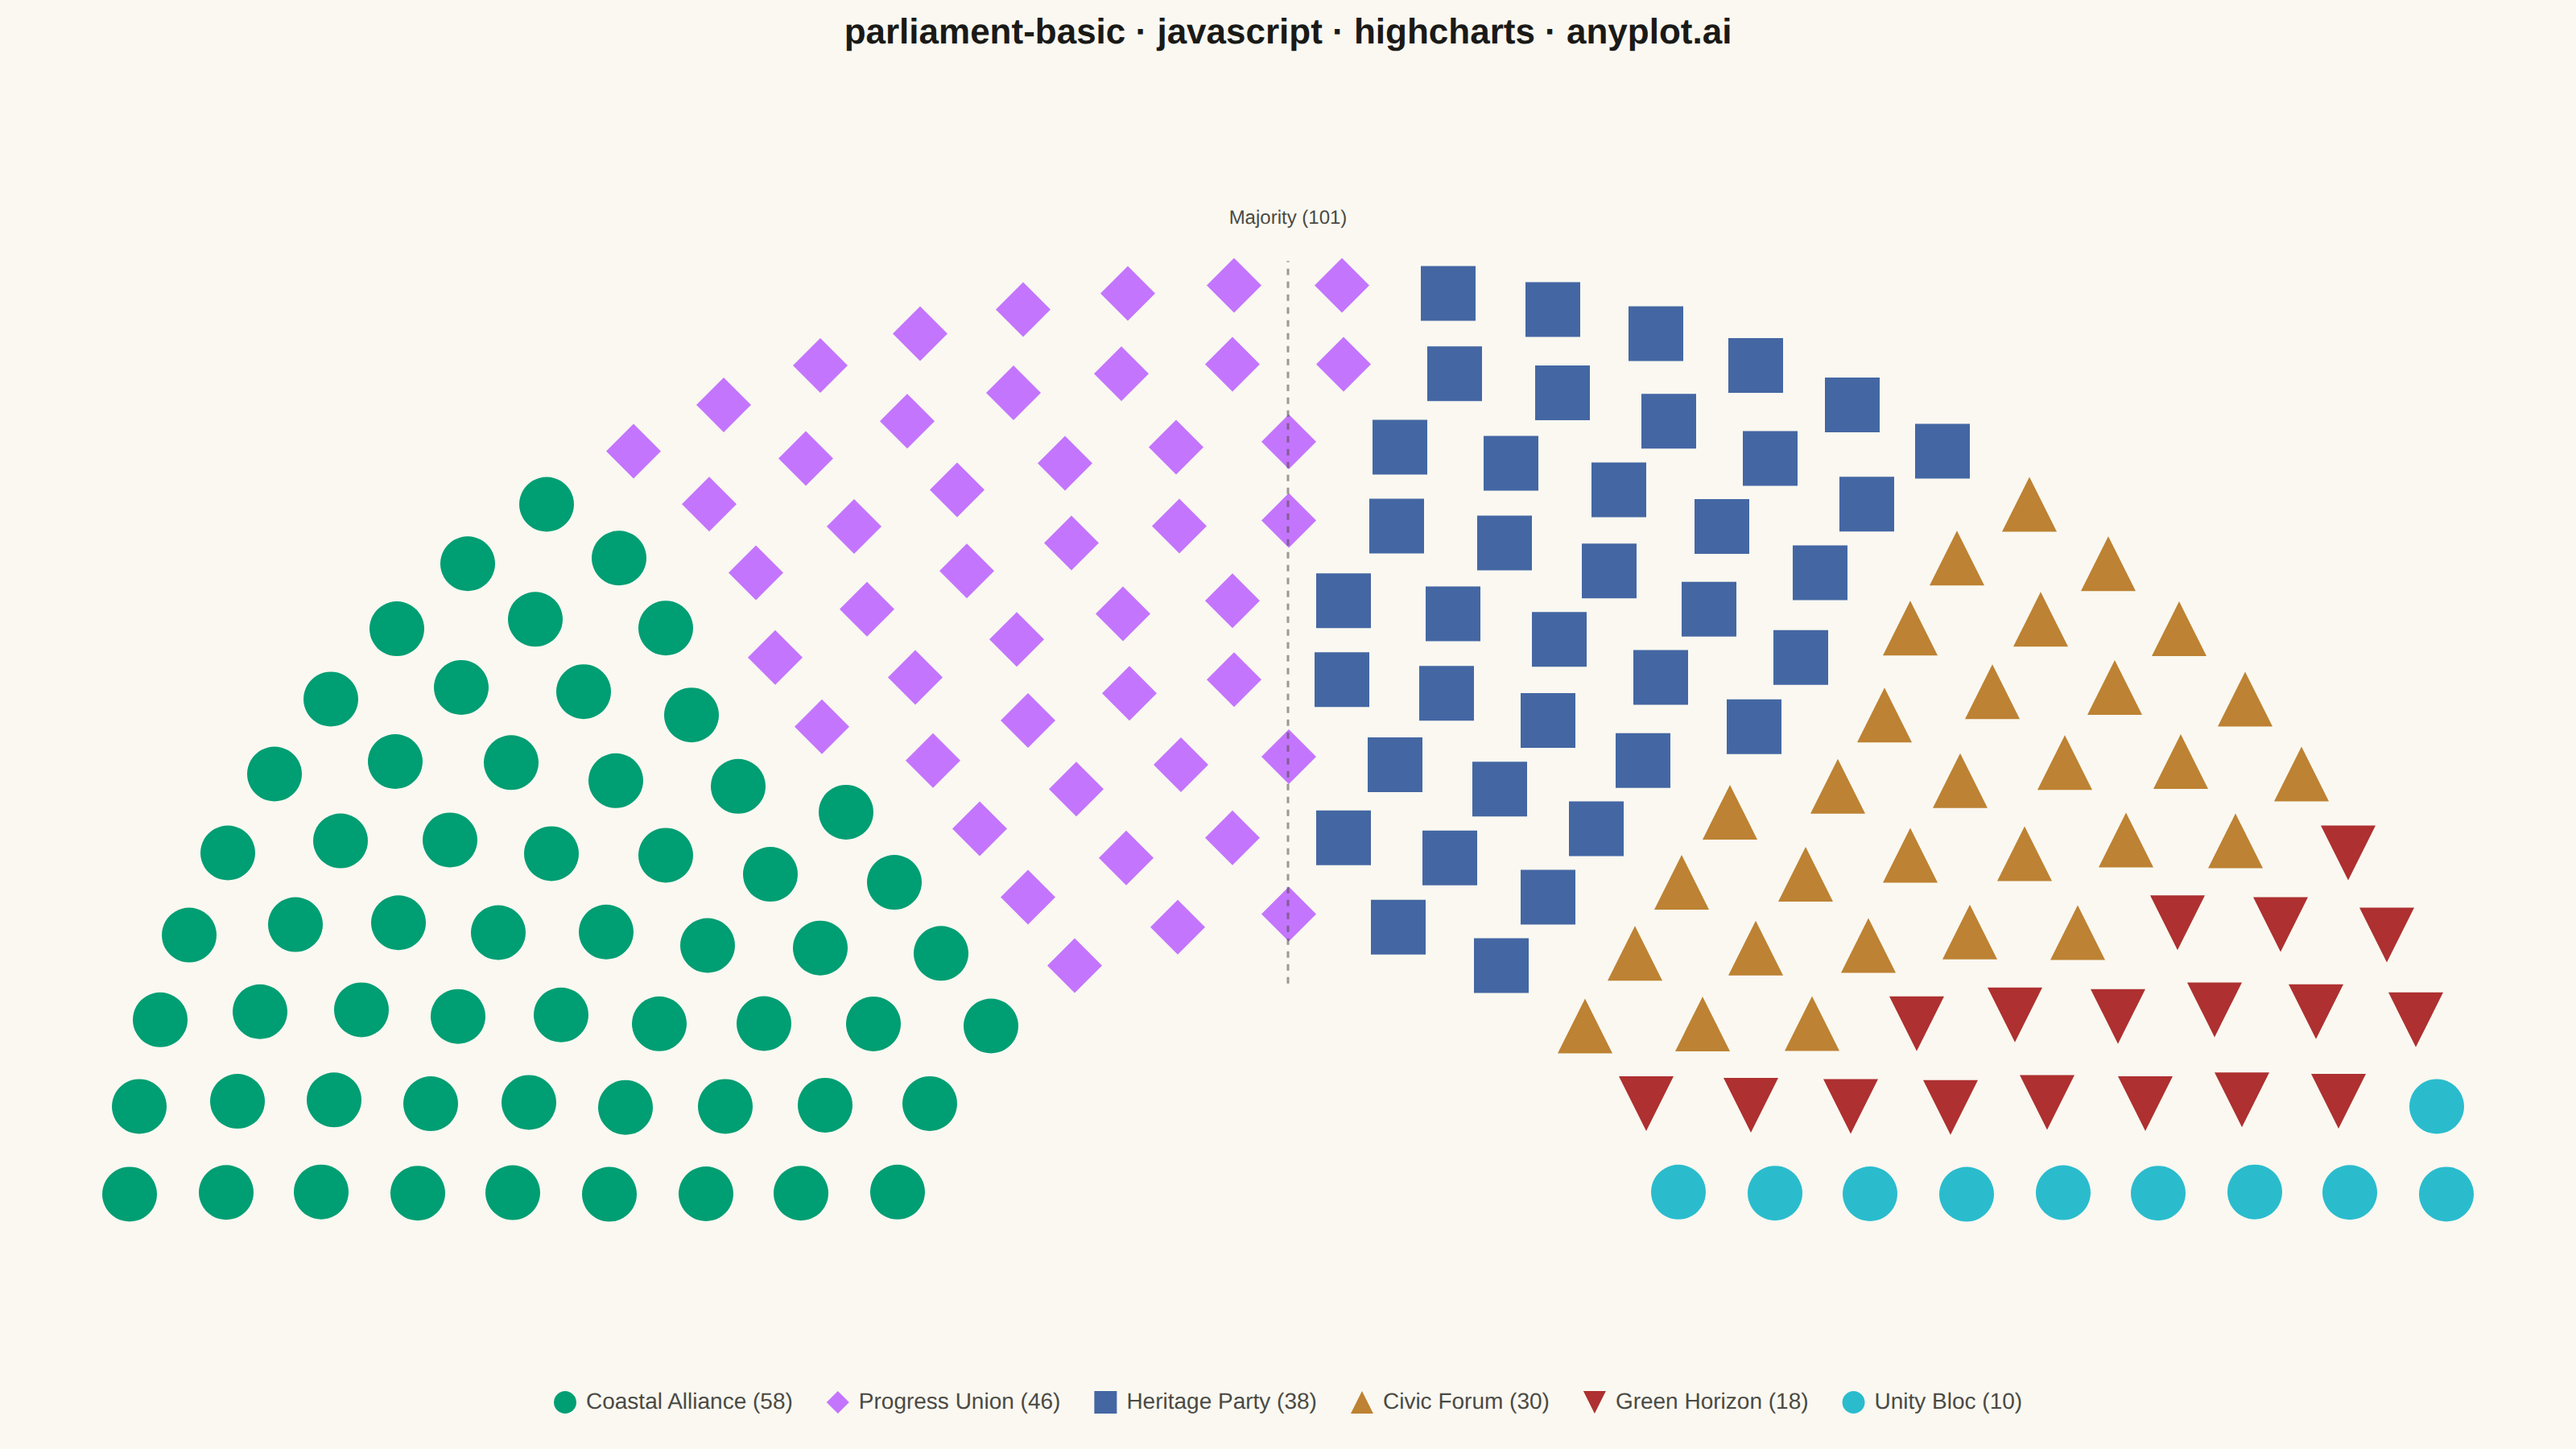
A semicircular parliament seat chart visualizes political party representation by arranging seats in concentric arcs. Each seat is displayed as an individual dot or segment, colored by party affiliation. This visualization is ideal for showing the composition of legislative bodies, election results, and voting bloc distributions at a glance.
// anyplot.ai
// parliament-basic: Parliament Seat Chart
// Library: highcharts 12.6.0 | JavaScript 22.23.2
// Quality: 92/100 | Created: 2026-09-02

//# anyplot-orientation: landscape
const t = window.ANYPLOT_TOKENS;

// --- Data (in-memory, deterministic) ---------------------------------------
const parties = [
  { name: "Coastal Alliance", seats: 58 },
  { name: "Progress Union", seats: 46 },
  { name: "Heritage Party", seats: 38 },
  { name: "Civic Forum", seats: 30 },
  { name: "Green Horizon", seats: 18 },
  { name: "Unity Bloc", seats: 10 },
];
const totalSeats = parties.reduce((sum, party) => sum + party.seats, 0);
const majoritySeats = Math.floor(totalSeats / 2) + 1;

// --- Hemicycle seat layout ---------------------------------------------------
// Concentric arcs (rows) grow outward from an inner radius; each row's seat
// capacity scales with its arc length. Capacities are rescaled (largest
// remainder method) to sum to exactly `totalSeats`, then every seat position
// is sorted by angle left-to-right so parties form the classic contiguous
// wedges of a parliament diagram.
const INNER_RADIUS = 140;
const ROW_GAP = 34;
const SEAT_SPACING = 34;

const rawCapacities = [];
let rowRadius = INNER_RADIUS;
while (rawCapacities.reduce((a, b) => a + b, 0) < totalSeats) {
  rawCapacities.push(Math.max(1, Math.floor((Math.PI * rowRadius) / SEAT_SPACING)));
  rowRadius += ROW_GAP;
}
const capacitySum = rawCapacities.reduce((a, b) => a + b, 0);
const scaledCapacities = rawCapacities.map((c) => (c / capacitySum) * totalSeats);
const rowSeatCounts = scaledCapacities.map(Math.floor);
const remainder = totalSeats - rowSeatCounts.reduce((a, b) => a + b, 0);
const byFraction = scaledCapacities
  .map((value, i) => ({ i, frac: value - Math.floor(value) }))
  .sort((a, b) => b.frac - a.frac);
for (let k = 0; k < remainder; k++) rowSeatCounts[byFraction[k].i] += 1;

const seatPoints = [];
let maxRadius = INNER_RADIUS;
rowSeatCounts.forEach((count, row) => {
  const radius = INNER_RADIUS + row * ROW_GAP;
  maxRadius = Math.max(maxRadius, radius);
  for (let j = 0; j < count; j++) {
    const angle = Math.PI - (Math.PI * (j + 0.5)) / count;
    seatPoints.push({ angle, x: radius * Math.cos(angle), y: radius * Math.sin(angle) });
  }
});
seatPoints.sort((a, b) => b.angle - a.angle); // left (180°) -> right (0°)

// Majority-threshold angle: the boundary between the last seat outside a
// majority coalition (built left-to-right) and the first seat that would
// tip it over 50%+1, used to draw a subtle radial guide.
const majorityAngle =
  (seatPoints[majoritySeats - 2].angle + seatPoints[majoritySeats - 1].angle) / 2;

let cursor = 0;
const series = parties.map((party, i) => {
  const data = seatPoints.slice(cursor, cursor + party.seats).map((p) => ({ x: p.x, y: p.y }));
  cursor += party.seats;
  return { name: `${party.name} (${party.seats})`, color: t.palette[i], data };
});

// --- Chart -------------------------------------------------------------------
const pad = 40;
Highcharts.chart("container", {
  chart: {
    type: "scatter",
    backgroundColor: "transparent",
    animation: false,
    style: { fontFamily: "inherit" },
    events: {
      render: function () {
        if (this.majorityGuideDrawn) return;
        this.majorityGuideDrawn = true;
        const xAxis = this.xAxis[0];
        const yAxis = this.yAxis[0];
        const rInner = INNER_RADIUS - 30;
        const rOuter = maxRadius + 10;
        const rLabel = maxRadius + 26;
        const x1 = xAxis.toPixels(rInner * Math.cos(majorityAngle));
        const y1 = yAxis.toPixels(rInner * Math.sin(majorityAngle));
        const x2 = xAxis.toPixels(rOuter * Math.cos(majorityAngle));
        const y2 = yAxis.toPixels(rOuter * Math.sin(majorityAngle));
        this.renderer
          .path(["M", x1, y1, "L", x2, y2])
          .attr({
            "stroke-dasharray": "4,4",
            stroke: t.inkSoft,
            "stroke-width": 1.5,
            opacity: 0.55,
            zIndex: 5,
          })
          .add();
        const lx = xAxis.toPixels(rLabel * Math.cos(majorityAngle));
        const ly = yAxis.toPixels(rLabel * Math.sin(majorityAngle));
        this.renderer
          .text(`Majority (${majoritySeats})`, lx, ly)
          .attr({ align: "center", zIndex: 5 })
          .css({ color: t.inkSoft, fontSize: "12px" })
          .add();
      },
    },
  },
  credits: { enabled: false },
  colors: t.palette,
  title: {
    text: "parliament-basic · javascript · highcharts · anyplot.ai",
    style: { color: t.ink, fontSize: "22px", fontWeight: "600" },
  },
  xAxis: {
    min: -(maxRadius + pad),
    max: maxRadius + pad,
    visible: false,
  },
  yAxis: {
    min: -pad,
    max: maxRadius + pad,
    title: { text: null },
    visible: false,
  },
  legend: {
    itemStyle: { color: t.inkSoft, fontSize: "14px" },
    itemHoverStyle: { color: t.ink },
    symbolRadius: 6,
  },
  tooltip: {
    headerFormat: "",
    pointFormatter: function () {
      return `<span style="color:${this.series.color}">●</span> ${this.series.name}`;
    },
  },
  plotOptions: {
    series: {
      animation: false,
      marker: { radius: 17, lineWidth: 0 },
      states: { hover: { enabled: false } },
    },
  },
  series,
});
Runnable source as JSON, for any HTTP client: https://api.anyplot.ai/specs/parliament-basic/highcharts/code. Any spec id and library id listed in llms-full.txt fit the same URL shape; every URL below is complete and callable.
{
  "spec_id": "parliament-basic",
  "language": "javascript",
  "library": "highcharts",
  "page": "https://anyplot.ai/parliament-basic/javascript/highcharts",
  "hub": "https://anyplot.ai/parliament-basic",
  "code_json": "https://api.anyplot.ai/specs/parliament-basic/highcharts/code",
  "spec_json": "https://api.anyplot.ai/specs/parliament-basic",
  "render_light_png": "https://storage.googleapis.com/anyplot-images/plots/parliament-basic/javascript/highcharts/plot-light.png",
  "render_dark_png": "https://storage.googleapis.com/anyplot-images/plots/parliament-basic/javascript/highcharts/plot-dark.png",
  "interactive_light_html": "https://storage.googleapis.com/anyplot-images/plots/parliament-basic/javascript/highcharts/plot-light.html",
  "interactive_dark_html": "https://storage.googleapis.com/anyplot-images/plots/parliament-basic/javascript/highcharts/plot-dark.html",
  "quality_score": 92.0,
  "license": "MIT",
  "guide": "https://anyplot.ai/llms.txt"
}
Part of Parliament Seat Chart on anyplot.ai.