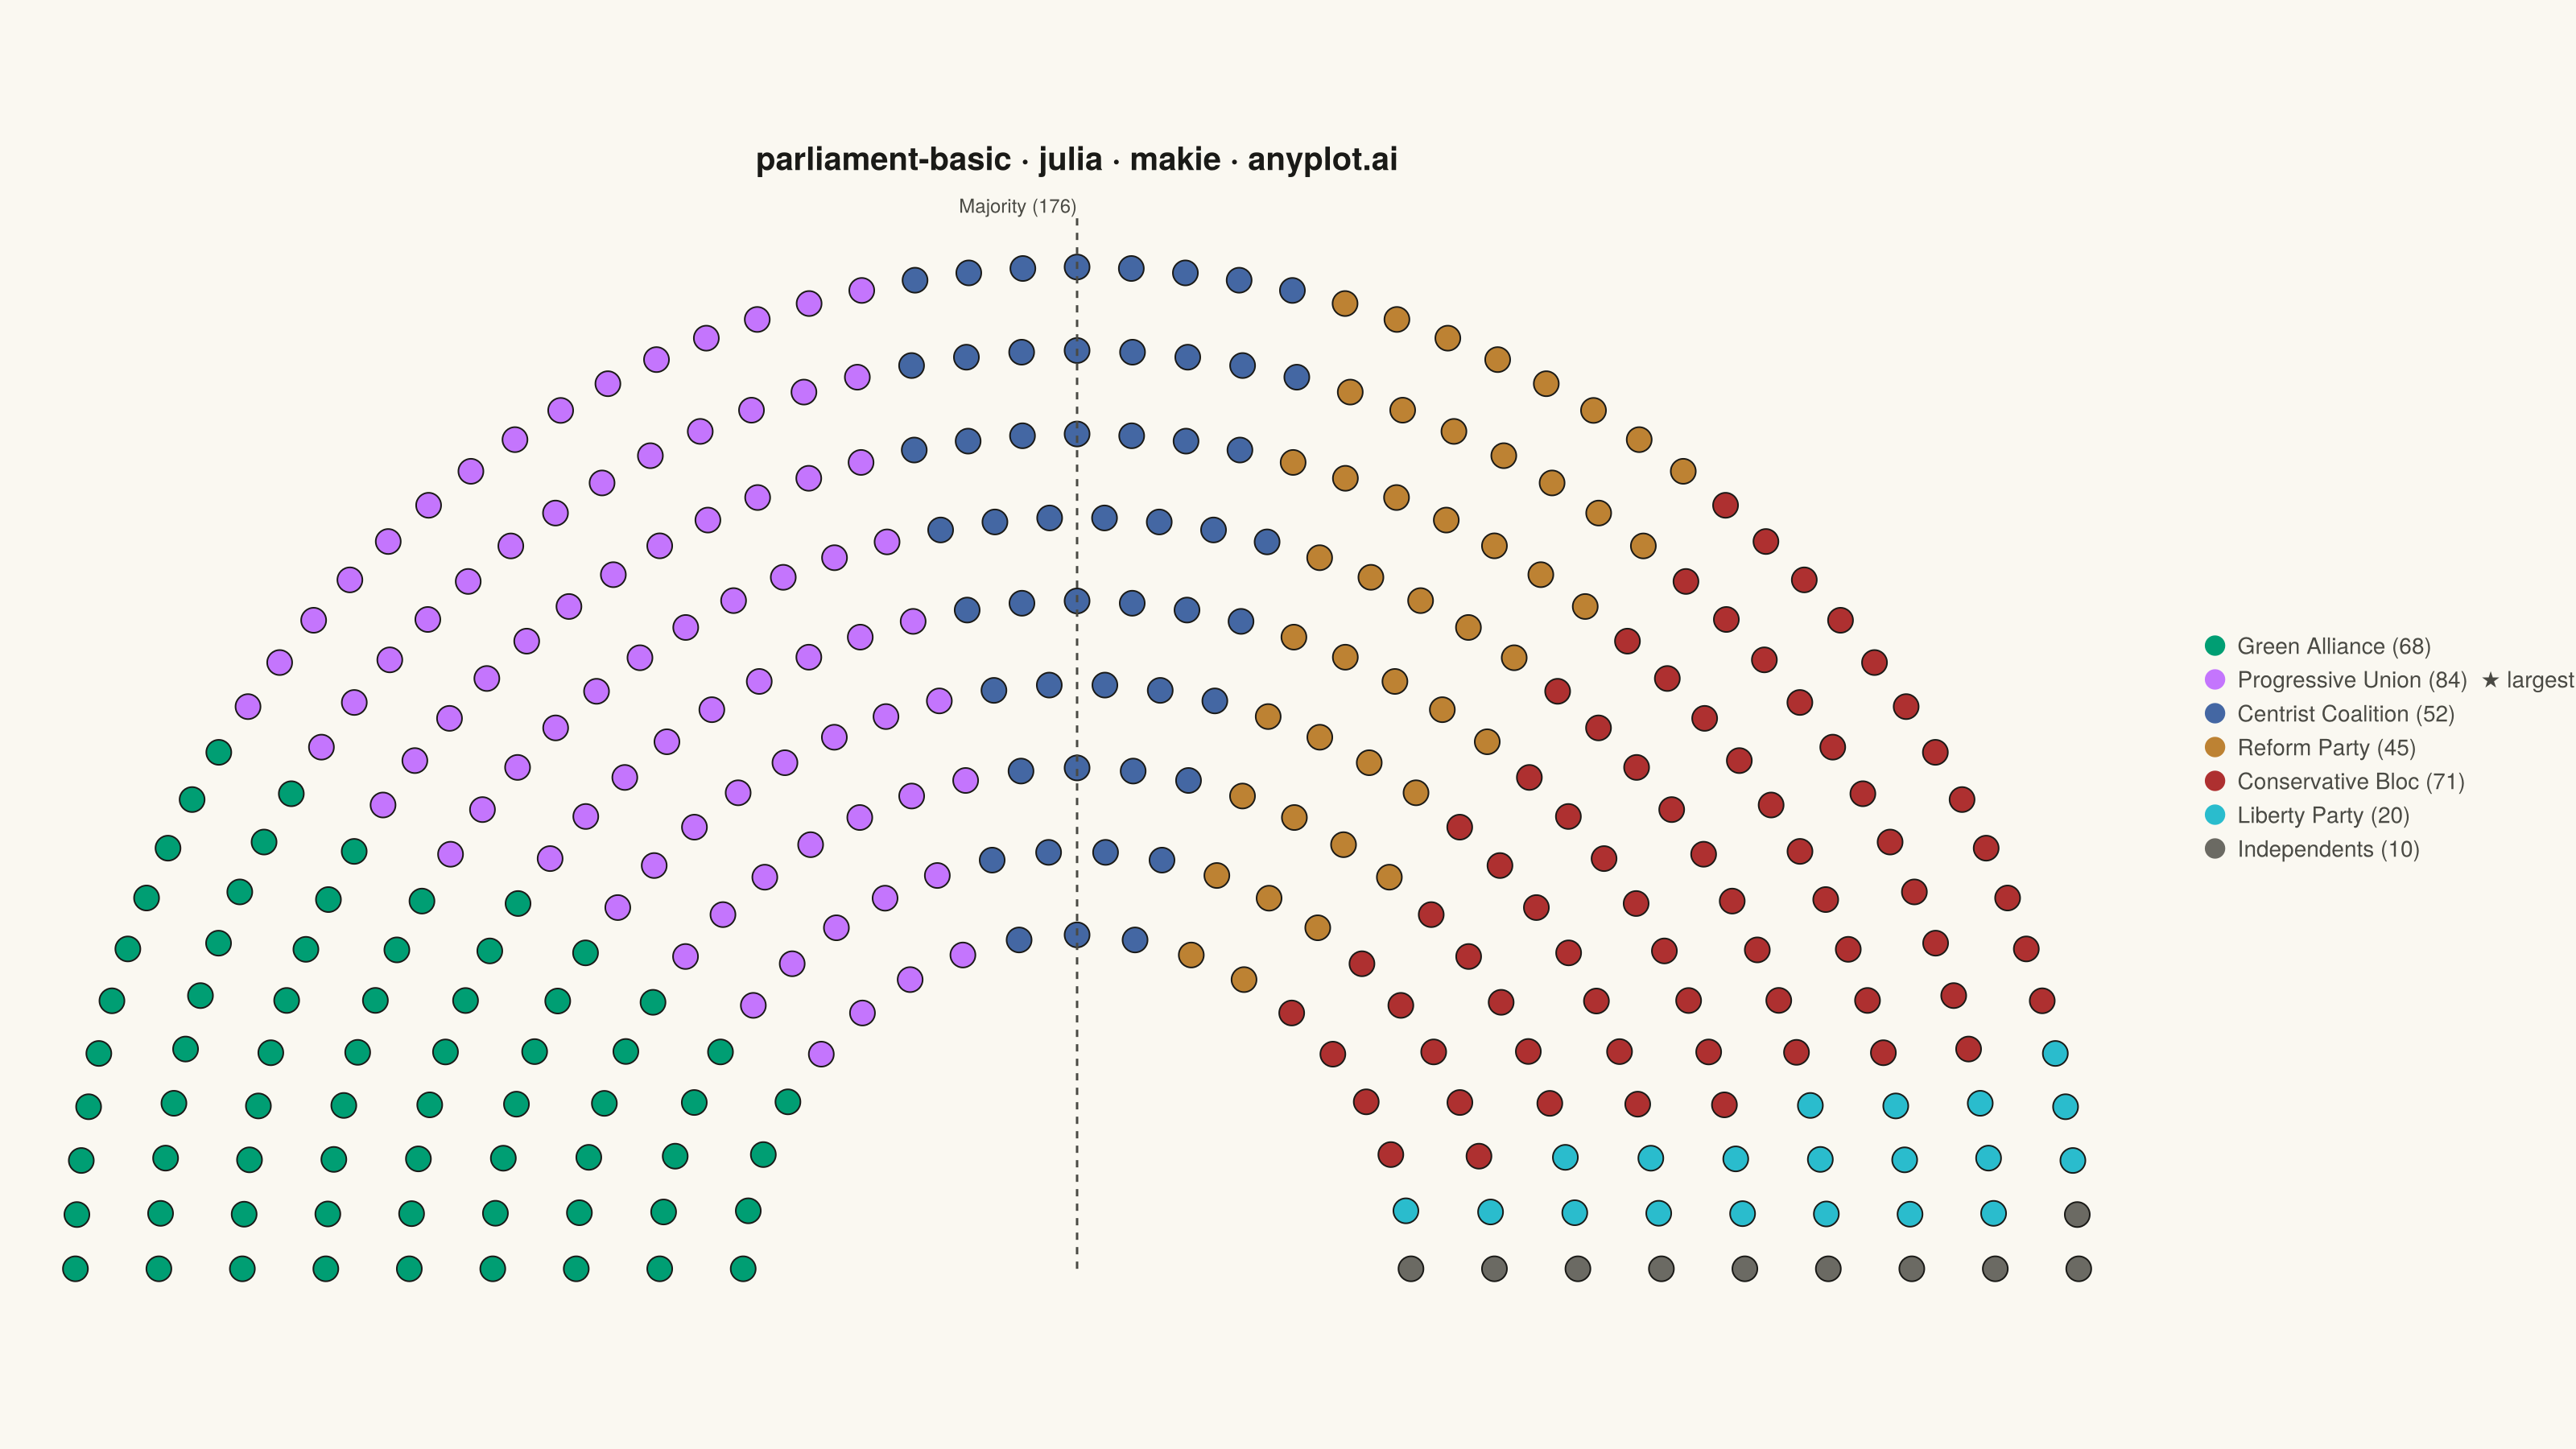
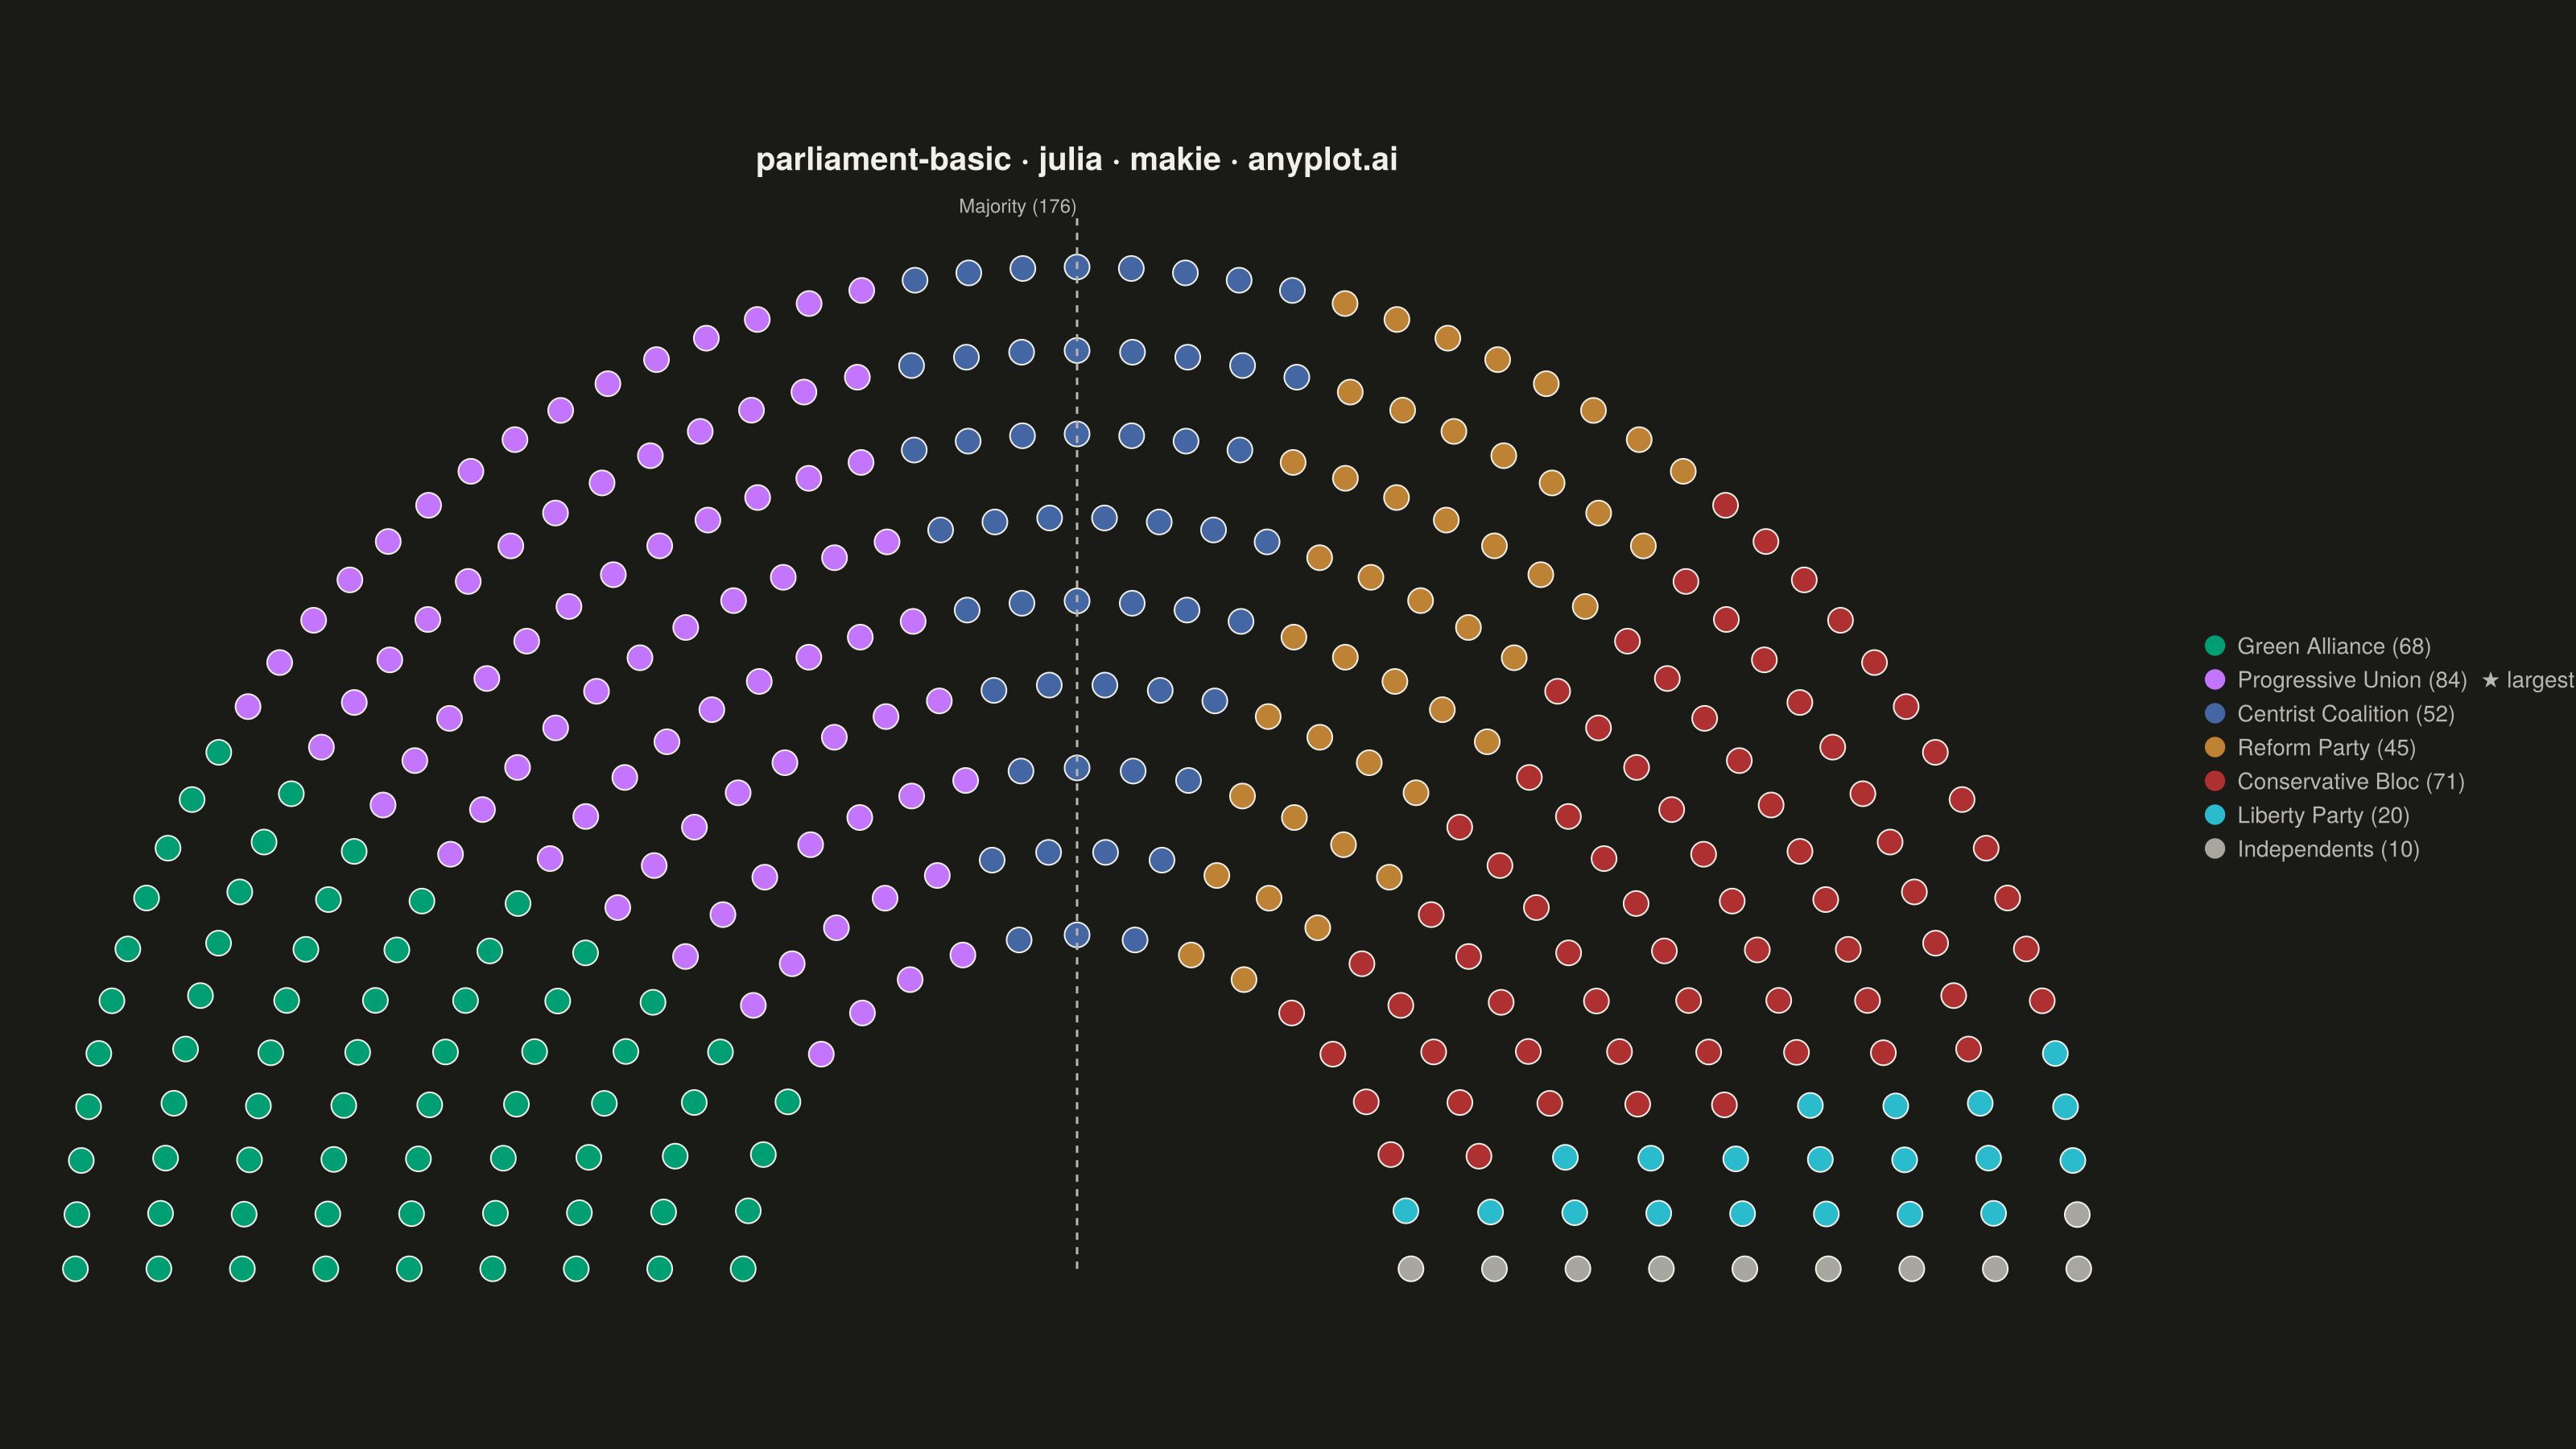
The same plot in 14 other libraries — Python: Altair, Bokeh, lets-plot, Matplotlib, Plotly, plotnine, Pygal, Seaborn; R: ggplot2; JavaScript: Chart.js, D3.js, Apache ECharts, Highcharts, MUI X Charts. Compare all 15 side by side: Parliament Seat Chart in Python, R, Julia and JavaScript.
A semicircular parliament seat chart visualizes political party representation by arranging seats in concentric arcs. Each seat is displayed as an individual dot or segment, colored by party affiliation. This visualization is ideal for showing the composition of legislative bodies, election results, and voting bloc distributions at a glance.
# anyplot.ai
# parliament-basic: Parliament Seat Chart
# Library: makie 0.21.9 | Julia 1.11.9
# Quality: 87/100 | Created: 2026-09-02

using CairoMakie
using Colors

# --- Theme tokens -------------------------------------------------------
const THEME    = get(ENV, "ANYPLOT_THEME", "light")
const PAGE_BG  = THEME == "light" ? colorant"#FAF8F1" : colorant"#1A1A17"
const INK      = THEME == "light" ? colorant"#1A1A17" : colorant"#F0EFE8"
const INK_SOFT = THEME == "light" ? colorant"#4A4A44" : colorant"#B8B7B0"
const MUTED    = THEME == "light" ? colorant"#6B6A63" : colorant"#A8A79F"

const IMPRINT_PALETTE = [
    colorant"#009E73", colorant"#C475FD", colorant"#4467A3",
    colorant"#BD8233", colorant"#AE3030", colorant"#2ABCCD",
]

# --- Data: fictional national assembly, 2026 election results -----------
# Independents carry no party color, so they use the theme-adaptive
# "other / rest" anchor instead of a 7th categorical slot.
parties       = ["Green Alliance", "Progressive Union", "Centrist Coalition",
                  "Reform Party", "Conservative Bloc", "Liberty Party", "Independents"]
seats         = [68, 84, 52, 45, 71, 20, 10]
party_colors  = vcat(IMPRINT_PALETTE, [MUTED])
total_seats   = sum(seats)

# --- Layout: seats arranged in concentric semicircular arcs -------------
# Seats per row are proportional to the row's radius so that the arc
# length per seat (and thus visual density) stays roughly constant
# across rows.
n_rows        = 9
inner_radius  = 4.0
row_spacing   = 1.0
row_radii     = inner_radius .+ (0:(n_rows - 1)) .* row_spacing

row_counts = round.(Int, row_radii ./ sum(row_radii) .* total_seats)
while sum(row_counts) != total_seats
    delta = total_seats - sum(row_counts)
    idx = delta > 0 ? argmax(row_radii) : argmin(row_radii)
    row_counts[idx] += sign(delta)
end

seat_angles = Float64[]
seat_radii = Float64[]
for (r, cnt) in zip(row_radii, row_counts)
    cnt == 0 && continue
    θs = cnt == 1 ? [π / 2] : collect(range(π, 0, length = cnt))
    append!(seat_angles, θs)
    append!(seat_radii, fill(r, cnt))
end

# Sort left (θ≈π) to right (θ≈0) so party blocks read left-to-right,
# matching the canonical political-spectrum ordering.
order = sortperm(seat_angles, rev = true)
seat_angles = seat_angles[order]
seat_radii = seat_radii[order]

seat_x = seat_radii .* cos.(seat_angles)
seat_y = seat_radii .* sin.(seat_angles)
seat_colors = reduce(vcat, [fill(c, n) for (n, c) in zip(seats, party_colors)])

# Majority-threshold angle: the ray through the (total_seats/2 + 1)-th seat
# in left-to-right order marks the 50%+1 split of the whole assembly.
majority_seats  = div(total_seats, 2) + 1
threshold_angle = seat_angles[majority_seats]

# Plurality leader, called out in the legend.
plurality_idx = argmax(seats)

# --- Plot -----------------------------------------------------------------
fig = Figure(
    resolution      = (1600, 900),
    fontsize        = 14,
    backgroundcolor = PAGE_BG,
)

ax = Axis(
    fig[1, 1];
    title           = "parliament-basic · julia · makie · anyplot.ai",
    titlesize       = 20,
    titlecolor      = INK,
    backgroundcolor = PAGE_BG,
    aspect          = DataAspect(),
)
hidedecorations!(ax)
hidespines!(ax)
xlims!(ax, -row_radii[end] - 1, row_radii[end] + 1)
ylims!(ax, -0.5, row_radii[end] + 1)

scatter!(
    ax, seat_x, seat_y;
    color = seat_colors, markersize = 22,
    strokewidth = 1.0, strokecolor = INK,
)

# Majority-threshold indicator: dashed radial line + label at 50%+1 seats.
line_len = row_radii[end] + 0.6
lines!(
    ax, [0.0, line_len * cos(threshold_angle)], [0.0, line_len * sin(threshold_angle)];
    color = INK_SOFT, linewidth = 1.5, linestyle = :dash,
)
text!(
    ax, line_len * cos(threshold_angle), line_len * sin(threshold_angle);
    text = "Majority ($majority_seats)", color = INK_SOFT, fontsize = 12,
    align = (threshold_angle < π / 2 ? :left : :right, :bottom),
)

legend_labels = [
    "$p ($s)$(i == plurality_idx ? "  ★ largest" : "")"
    for (i, (p, s)) in enumerate(zip(parties, seats))
]
legend_markers = [MarkerElement(color = c, marker = :circle, markersize = 18) for c in party_colors]
Legend(
    fig[1, 2], legend_markers, legend_labels;
    framevisible = false,
    labelcolor   = INK_SOFT,
    labelsize    = 14,
    patchsize    = (18, 18),
)

colsize!(fig.layout, 1, Relative(0.87))

# --- Save -------------------------------------------------------------------
save("plot-$(THEME).png", fig; px_per_unit = 2)
Runnable source as JSON, for any HTTP client: https://api.anyplot.ai/specs/parliament-basic/makie/code. Any spec id and library id listed in llms-full.txt fit the same URL shape; every URL below is complete and callable.
{
  "spec_id": "parliament-basic",
  "language": "julia",
  "library": "makie",
  "page": "https://anyplot.ai/parliament-basic/julia/makie",
  "hub": "https://anyplot.ai/parliament-basic",
  "code_json": "https://api.anyplot.ai/specs/parliament-basic/makie/code",
  "spec_json": "https://api.anyplot.ai/specs/parliament-basic",
  "render_light_png": "https://storage.googleapis.com/anyplot-images/plots/parliament-basic/julia/makie/plot-light.png",
  "render_dark_png": "https://storage.googleapis.com/anyplot-images/plots/parliament-basic/julia/makie/plot-dark.png",
  "quality_score": 87.0,
  "license": "MIT",
  "guide": "https://anyplot.ai/llms.txt"
}
Part of Parliament Seat Chart on anyplot.ai.