The same plot in 14 other libraries — JavaScript: Chart.js, D3.js, Apache ECharts, Highcharts; Python: Altair, Bokeh, lets-plot, Matplotlib, Plotly, plotnine, Pygal, Seaborn; R: ggplot2; Julia: Makie.jl. Compare all 15 side by side: Parliament Seat Chart in Python, R, Julia and JavaScript.
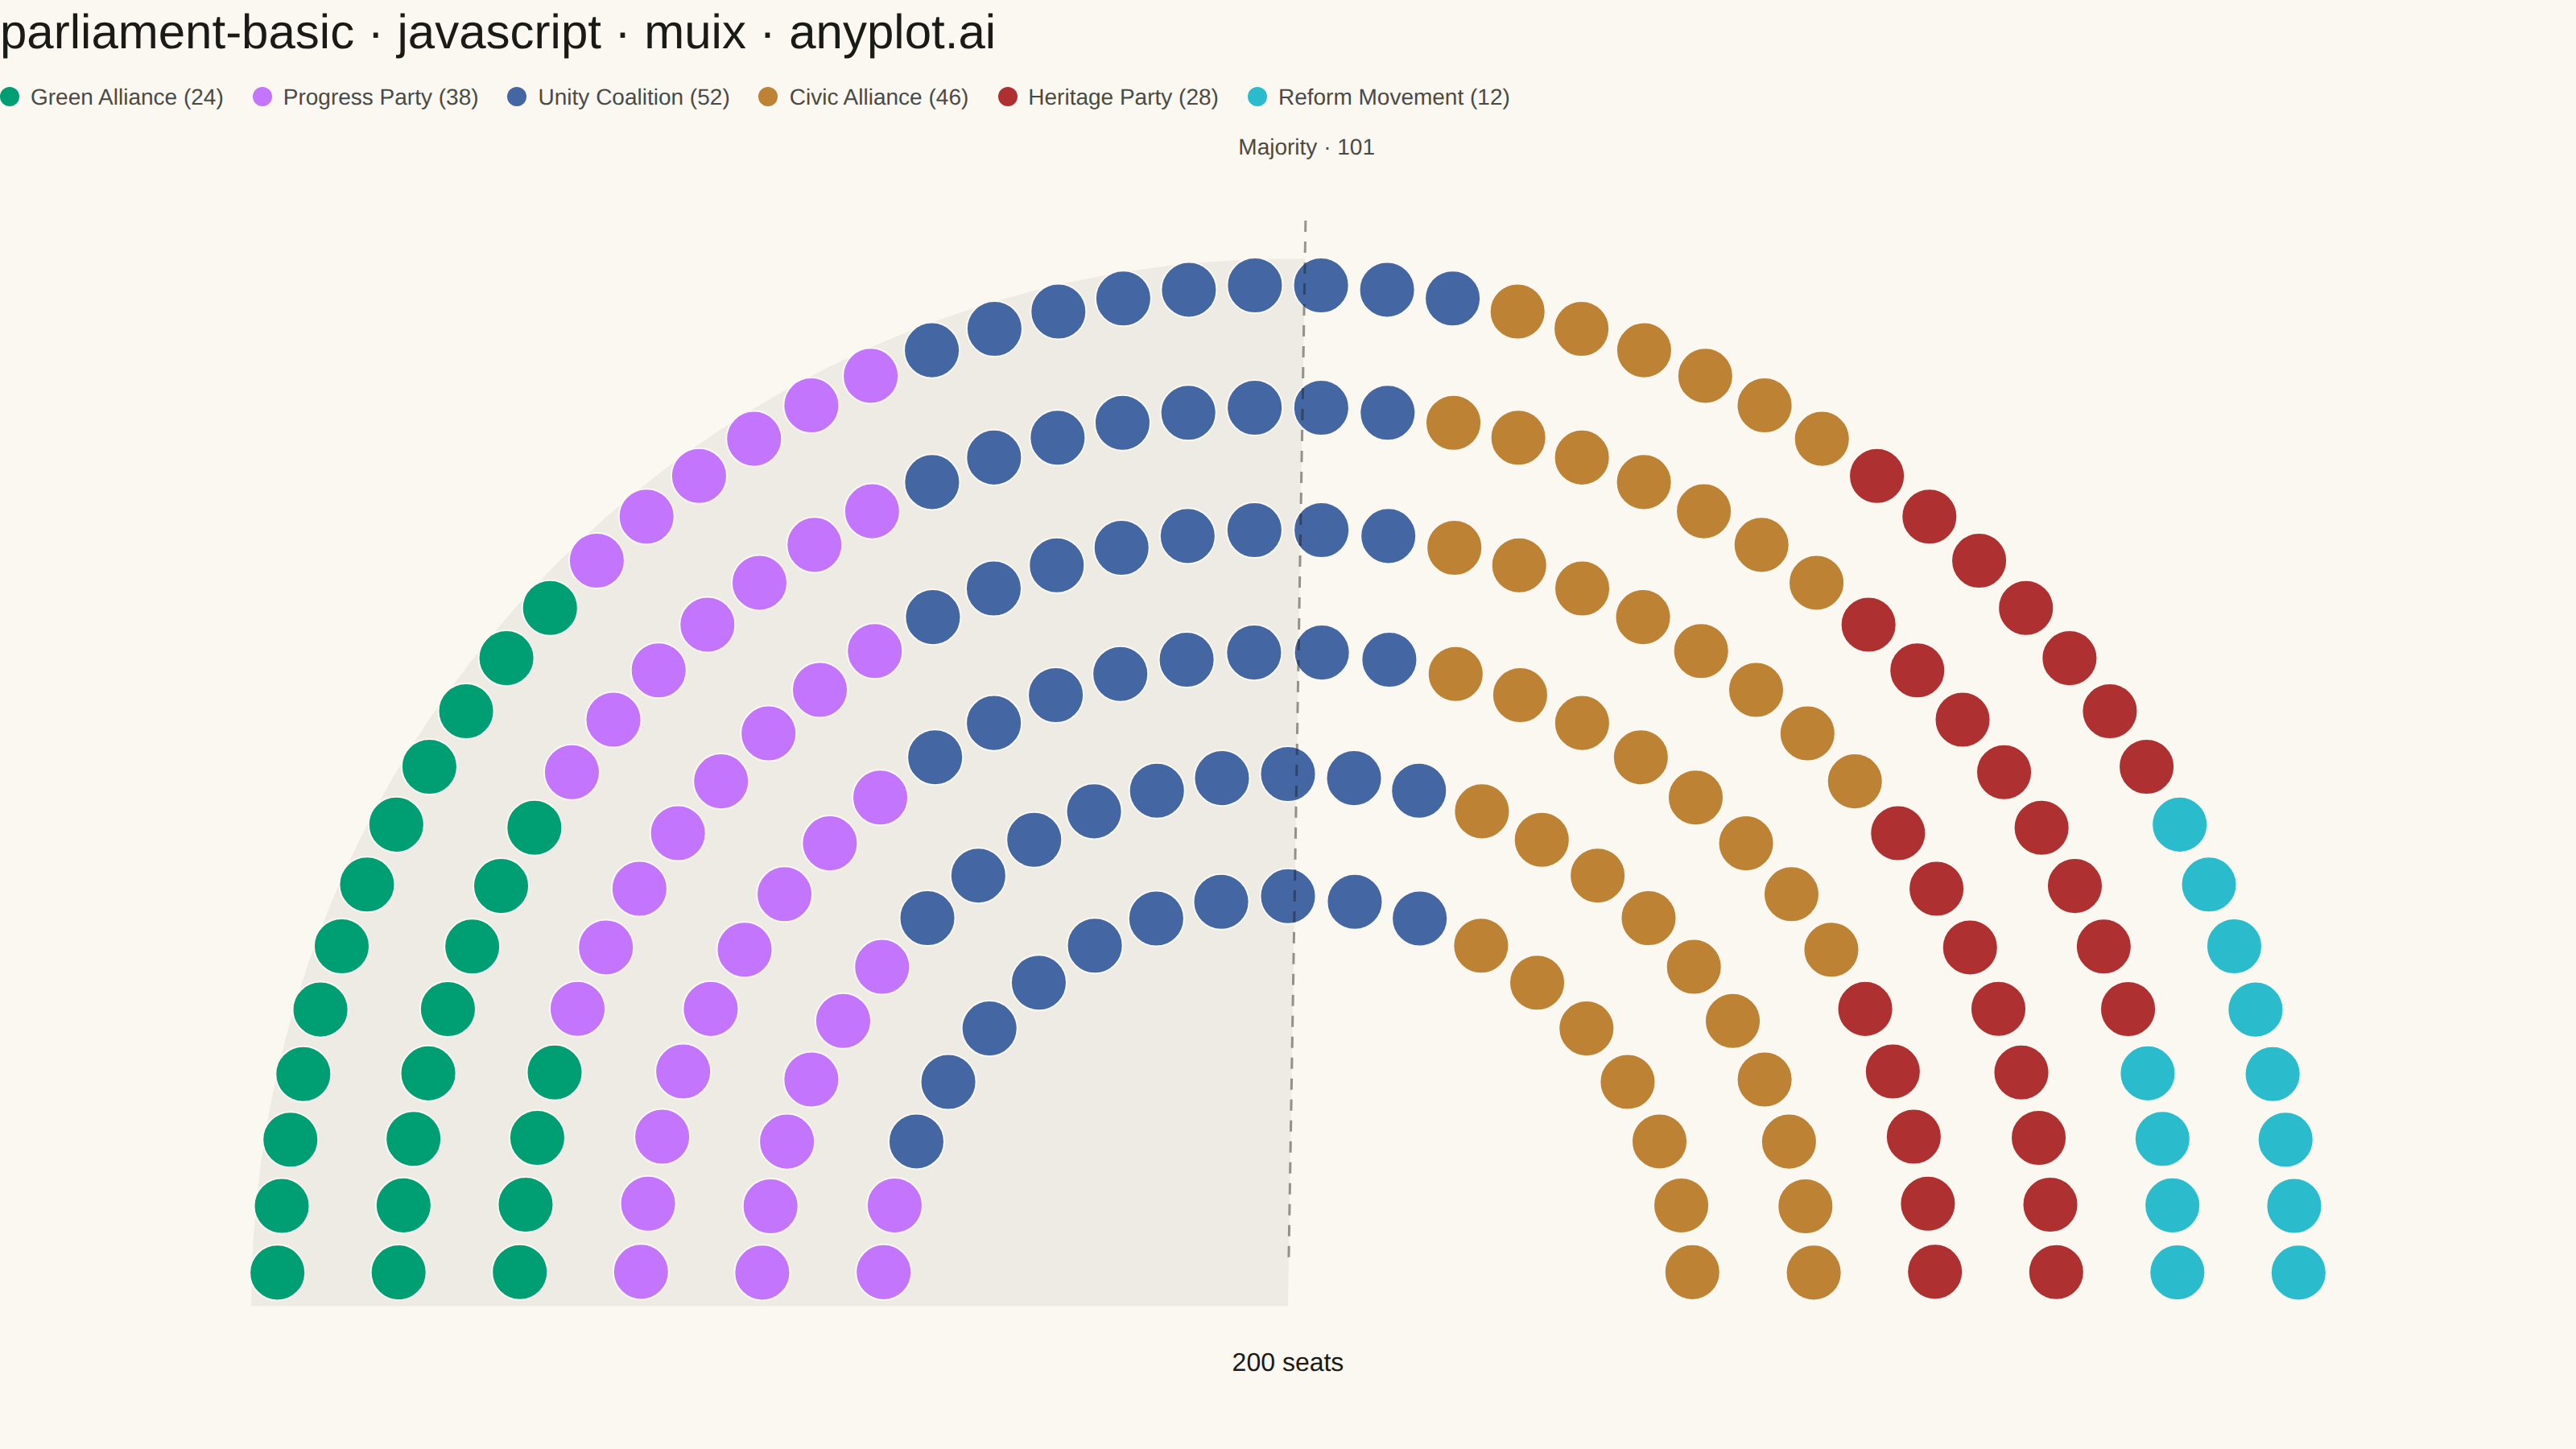
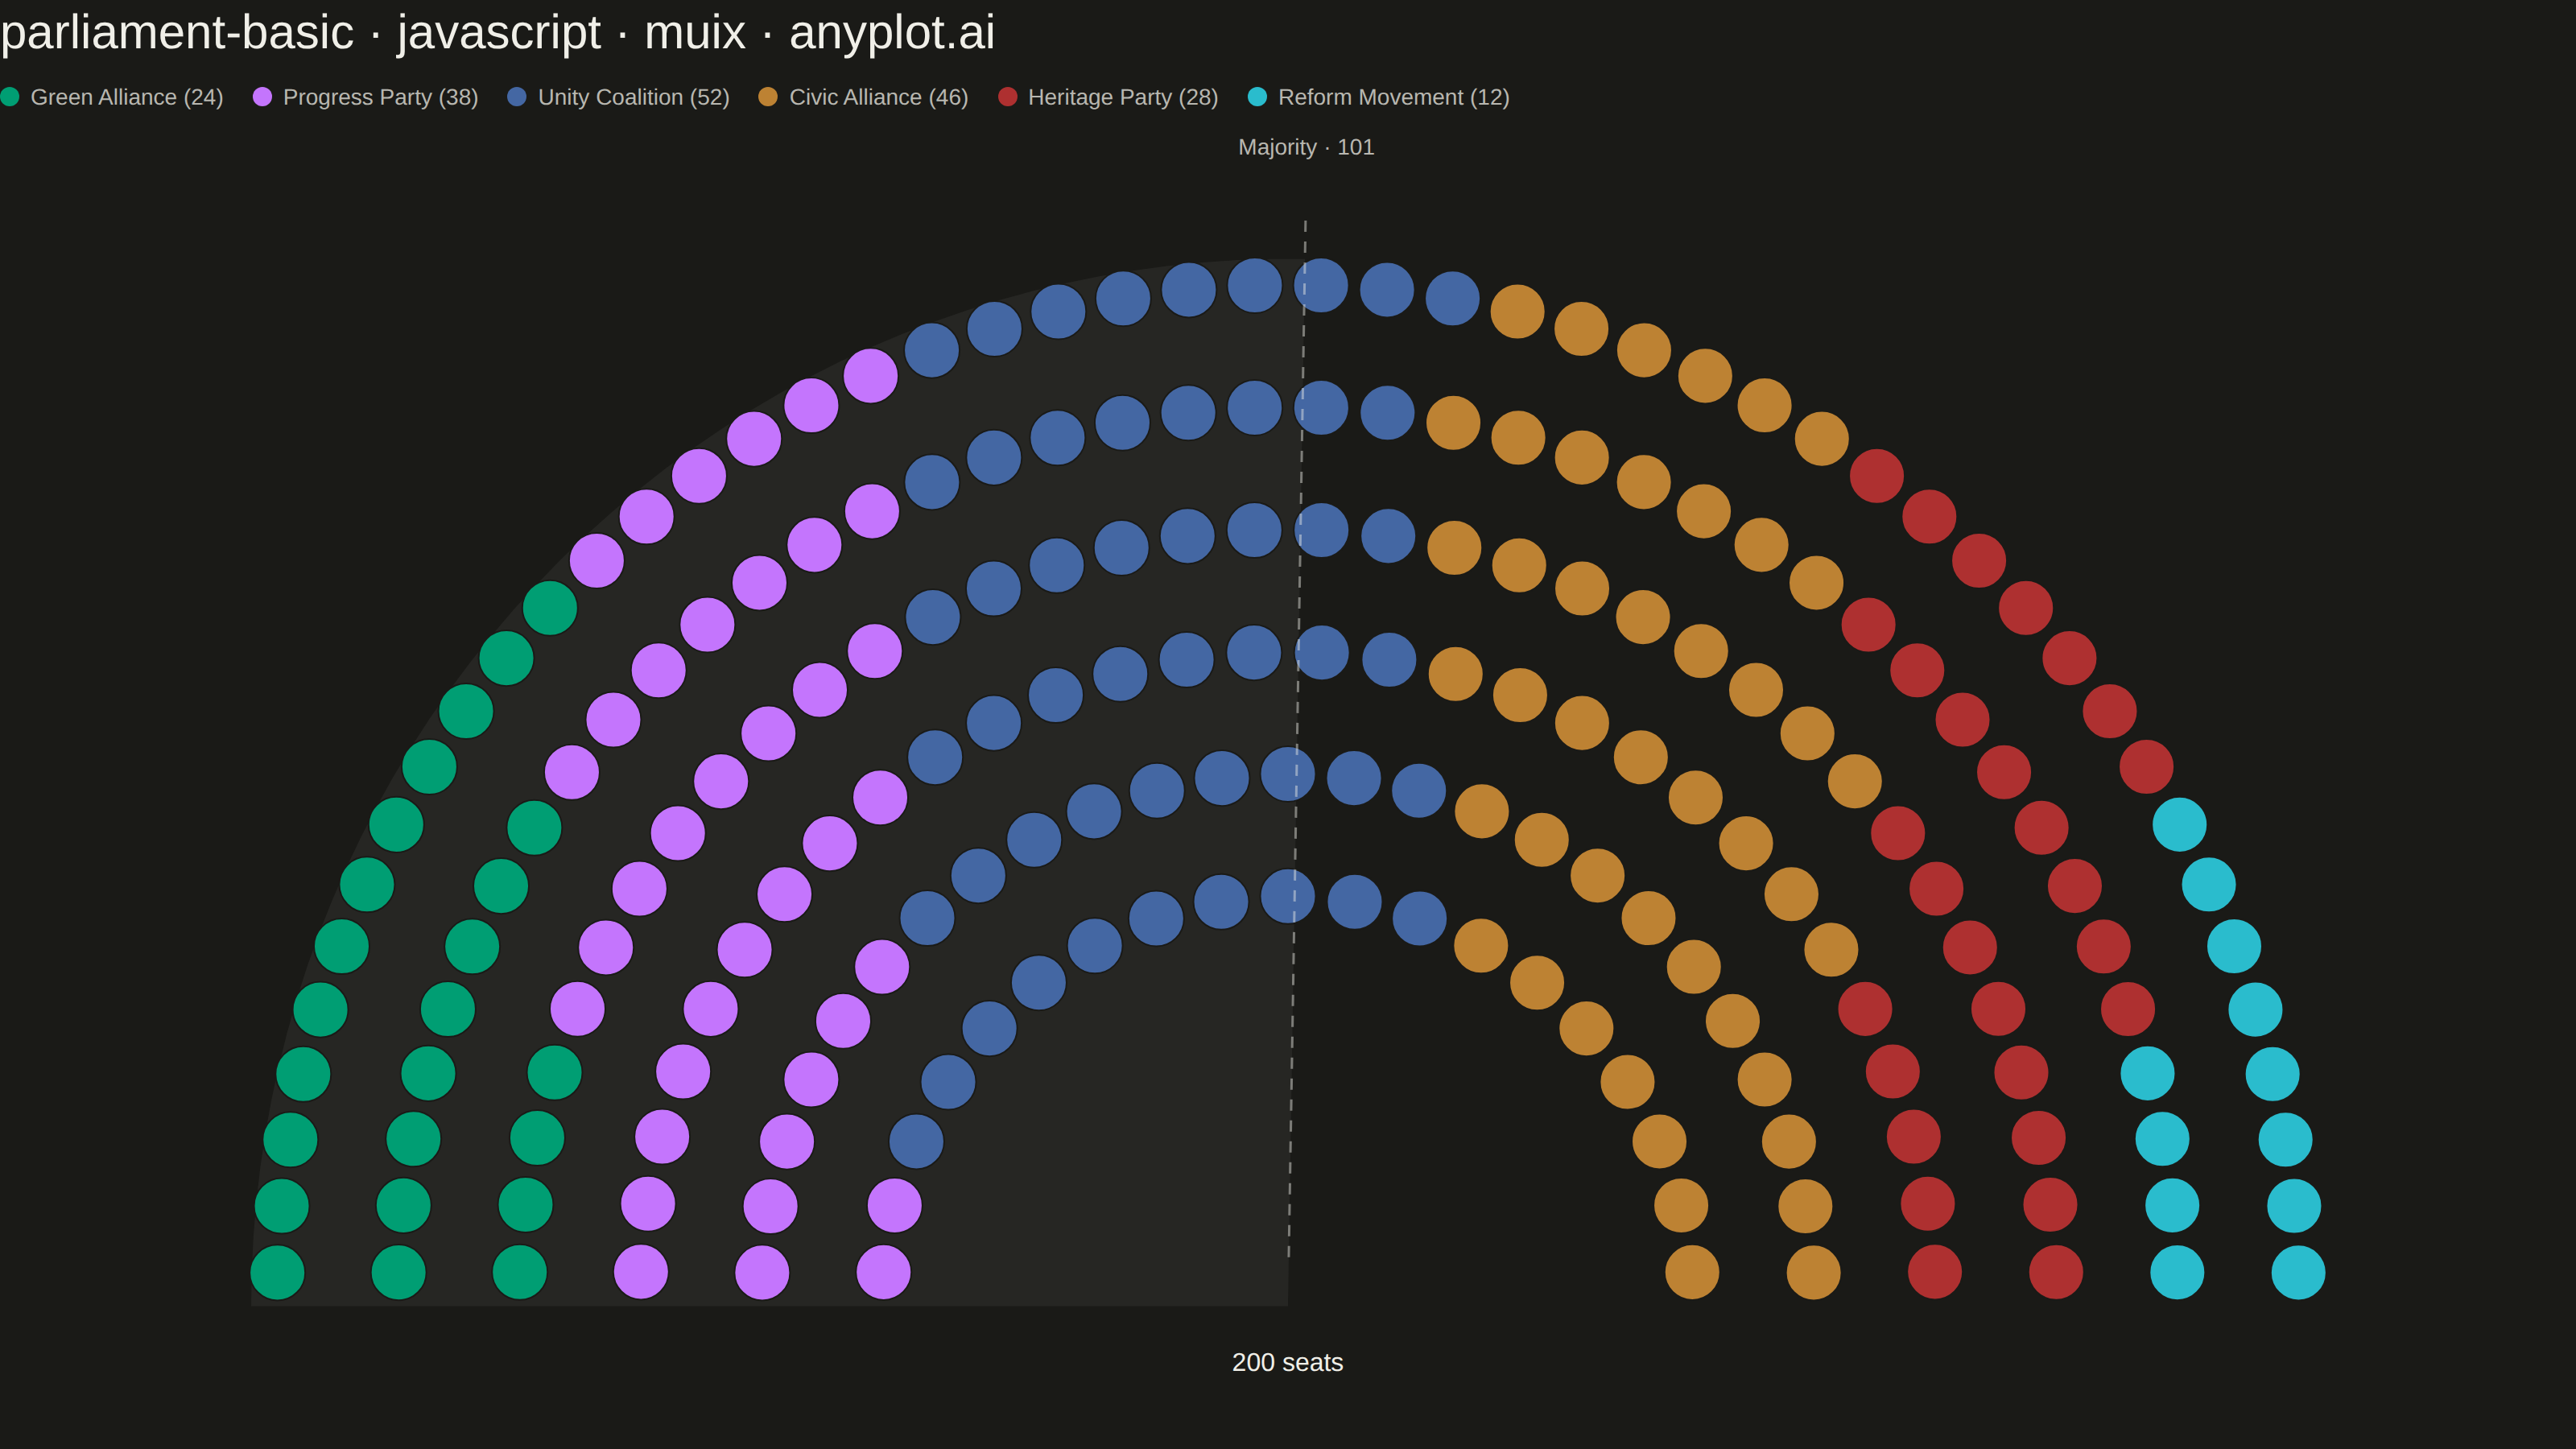
A semicircular parliament seat chart visualizes political party representation by arranging seats in concentric arcs. Each seat is displayed as an individual dot or segment, colored by party affiliation. This visualization is ideal for showing the composition of legislative bodies, election results, and voting bloc distributions at a glance.
// anyplot.ai
// parliament-basic: Parliament Seat Chart
// Library: muix 7.29.1 | JavaScript 22.23.2
// Quality: 91/100 | Created: 2026-09-02
import { ChartContainer } from "@mui/x-charts/ChartContainer";
import { useXScale, useYScale } from "@mui/x-charts/hooks";

const t = window.ANYPLOT_TOKENS;

// --- Data: fictional national assembly, ordered left-to-right along the
// political spectrum (in-memory, deterministic) -----------------------------
const PARTIES = [
  { name: "Green Alliance", seats: 24 },
  { name: "Progress Party", seats: 38 },
  { name: "Unity Coalition", seats: 52 },
  { name: "Civic Alliance", seats: 46 },
  { name: "Heritage Party", seats: 28 },
  { name: "Reform Movement", seats: 12 },
];
const TOTAL_SEATS = PARTIES.reduce((sum, party) => sum + party.seats, 0); // 200
const MAJORITY_SEATS = Math.floor(TOTAL_SEATS / 2) + 1;

// --- Seat geometry: concentric semicircular arcs. Each row's seat count is
// proportional to its arc length (radius), which keeps seat spacing roughly
// constant across rows. Seats are then handed to parties in left-to-right
// angular order, so each party forms a contiguous wedge across the arcs. ----
const OUTER_R = 628;
const INNER_R = 252;
const ROW_COUNT = Math.min(9, Math.max(3, Math.round(Math.sqrt(TOTAL_SEATS / 6))));

const rowRadii = Array.from({ length: ROW_COUNT }, (_, i) =>
  ROW_COUNT === 1 ? OUTER_R : INNER_R + (i * (OUTER_R - INNER_R)) / (ROW_COUNT - 1),
);
const radiusSum = rowRadii.reduce((sum, r) => sum + r, 0);
const rowCapacities = rowRadii.map((r) => Math.max(1, Math.round((TOTAL_SEATS * r) / radiusSum)));
const capacityDrift = TOTAL_SEATS - rowCapacities.reduce((sum, c) => sum + c, 0);
rowCapacities[ROW_COUNT - 1] += capacityDrift;

const slots = [];
rowRadii.forEach((r, rowIndex) => {
  const capacity = rowCapacities[rowIndex];
  for (let j = 0; j < capacity; j += 1) {
    const theta = ((j + 0.5) / capacity) * Math.PI;
    slots.push({ r, theta, x: r * Math.cos(theta), y: r * Math.sin(theta) });
  }
});
slots.sort((a, b) => a.x - b.x); // left-to-right, matches PARTIES order

const seats = [];
let cursor = 0;
PARTIES.forEach((party, partyIndex) => {
  for (let i = 0; i < party.seats; i += 1) {
    seats.push({ ...slots[cursor], party: partyIndex });
    cursor += 1;
  }
});

const rowRadialGap = ROW_COUNT > 1 ? (OUTER_R - INNER_R) / (ROW_COUNT - 1) : OUTER_R - INNER_R;
const minAngularSpacing = Math.min(...rowRadii.map((r, i) => (r * Math.PI) / rowCapacities[i]));
const SEAT_R = Math.min(20, Math.max(5, 0.42 * Math.min(rowRadialGap, minAngularSpacing)));

// Majority threshold: the angle bisecting the seat where the assembly tips 50%+1.
const majorityLower = slots[MAJORITY_SEATS - 1];
const majorityUpper = slots[MAJORITY_SEATS] ?? majorityLower;
const MAJORITY_THETA = (majorityLower.theta + majorityUpper.theta) / 2;

// --- Layout: domain sized so the x/y scale matches 1:1 (keeps seats circular
// and the arc a true semicircle instead of an ellipse). ---------------------
const TOP_PAD = 90;
const BOTTOM_PAD = 80;
const X_PAD = 164;
const domain = {
  xMin: -(OUTER_R + X_PAD),
  xMax: OUTER_R + X_PAD,
  yMin: -BOTTOM_PAD,
  yMax: OUTER_R + TOP_PAD,
};

// --- Custom SVG layers, positioned via the chart's own scales --------------
function Seats() {
  const xScale = useXScale();
  const yScale = useYScale();
  return (
    <g data-drawing-container>
      {seats.map((seat, i) => (
        <circle
          key={`seat-${i}`}
          cx={xScale(seat.x)}
          cy={yScale(seat.y)}
          r={SEAT_R}
          fill={t.palette[seat.party]}
          stroke={t.pageBg}
          strokeWidth={1}
        />
      ))}
    </g>
  );
}

// Subtle background wedge behind the seats spanning from the majority line to
// the leftmost edge — visually distinguishes the contiguous run of parties
// (Green Alliance -> ... ) whose combined seats cross the 101-seat threshold.
function MajorityHighlight() {
  const xScale = useXScale();
  const yScale = useYScale();
  const highlightR = OUTER_R + 16;
  const steps = 48;
  const arcPoints = Array.from({ length: steps + 1 }, (_, i) => {
    const theta = MAJORITY_THETA + ((Math.PI - MAJORITY_THETA) * i) / steps;
    return `${xScale(highlightR * Math.cos(theta))},${yScale(highlightR * Math.sin(theta))}`;
  });
  const pathD = `M ${xScale(0)} ${yScale(0)} L ${arcPoints.join(" L ")} Z`;
  return (
    <g data-drawing-container>
      <path d={pathD} fill={t.ink} fillOpacity={0.06} stroke="none" />
    </g>
  );
}

function MajorityLine() {
  const xScale = useXScale();
  const yScale = useYScale();
  const innerX = 30 * Math.cos(MAJORITY_THETA);
  const innerY = 30 * Math.sin(MAJORITY_THETA);
  const outerX = (OUTER_R + 44) * Math.cos(MAJORITY_THETA);
  const outerY = (OUTER_R + 44) * Math.sin(MAJORITY_THETA);
  const labelX = (OUTER_R + 80) * Math.cos(MAJORITY_THETA);
  const labelY = (OUTER_R + 80) * Math.sin(MAJORITY_THETA);
  return (
    <g data-drawing-container>
      <line
        x1={xScale(innerX)}
        y1={yScale(innerY)}
        x2={xScale(outerX)}
        y2={yScale(outerY)}
        stroke={t.ink}
        strokeOpacity={0.45}
        strokeWidth={1.5}
        strokeDasharray="7,6"
      />
      <text x={xScale(labelX)} y={yScale(labelY)} textAnchor="middle" fontSize={14} fill={t.inkSoft}>
        {`Majority · ${MAJORITY_SEATS}`}
      </text>
      <text
        x={xScale(0)}
        y={yScale(-BOTTOM_PAD * 0.5)}
        textAnchor="middle"
        fontSize={16}
        fontWeight={500}
        fill={t.ink}
      >
        {`${TOTAL_SEATS} seats`}
      </text>
    </g>
  );
}

// --- Title + legend chrome ---------------------------------------------------
const TITLE = "parliament-basic · javascript · muix · anyplot.ai";
const TITLE_FONT_DEFAULT = 30;
const titleFontSize =
  TITLE.length > 67 ? Math.round(TITLE_FONT_DEFAULT * (67 / TITLE.length)) : TITLE_FONT_DEFAULT;
const TITLE_H = 42;
const LEGEND_H = 36;

function Legend() {
  return (
    <div style={{ height: LEGEND_H, display: "flex", alignItems: "center", gap: "18px", flexWrap: "wrap" }}>
      {PARTIES.map((party, i) => (
        <div key={party.name} style={{ display: "flex", alignItems: "center", gap: "7px" }}>
          <span
            style={{
              width: "12px",
              height: "12px",
              borderRadius: "50%",
              backgroundColor: t.palette[i],
              display: "inline-block",
            }}
          />
          <span style={{ fontSize: "14px", color: t.inkSoft }}>
            {party.name} ({party.seats})
          </span>
        </div>
      ))}
    </div>
  );
}

// --- Chart (default-exported component — the harness mounts it) ------------
export default function Chart() {
  const { width, height } = window.ANYPLOT_SIZE;
  const chartHeight = height - TITLE_H - LEGEND_H;

  return (
    <div style={{ width, height, display: "flex", flexDirection: "column" }}>
      <div
        style={{
          height: `${TITLE_H}px`,
          lineHeight: `${TITLE_H}px`,
          fontSize: `${titleFontSize}px`,
          fontWeight: 500,
          color: t.ink,
        }}
      >
        {TITLE}
      </div>
      <Legend />
      <ChartContainer
        width={width}
        height={chartHeight}
        series={[]}
        margin={{ top: 8, bottom: 8, left: 8, right: 8 }}
        xAxis={[{ id: "x", scaleType: "linear", min: domain.xMin, max: domain.xMax }]}
        yAxis={[{ id: "y", scaleType: "linear", min: domain.yMin, max: domain.yMax }]}
        skipAnimation
      >
        <MajorityHighlight />
        <Seats />
        <MajorityLine />
      </ChartContainer>
    </div>
  );
}
Runnable source as JSON, for any HTTP client: https://api.anyplot.ai/specs/parliament-basic/muix/code. Any spec id and library id listed in llms-full.txt fit the same URL shape; every URL below is complete and callable.
{
  "spec_id": "parliament-basic",
  "language": "javascript",
  "library": "muix",
  "page": "https://anyplot.ai/parliament-basic/javascript/muix",
  "hub": "https://anyplot.ai/parliament-basic",
  "code_json": "https://api.anyplot.ai/specs/parliament-basic/muix/code",
  "spec_json": "https://api.anyplot.ai/specs/parliament-basic",
  "render_light_png": "https://storage.googleapis.com/anyplot-images/plots/parliament-basic/javascript/muix/plot-light.png",
  "render_dark_png": "https://storage.googleapis.com/anyplot-images/plots/parliament-basic/javascript/muix/plot-dark.png",
  "interactive_light_html": "https://storage.googleapis.com/anyplot-images/plots/parliament-basic/javascript/muix/plot-light.html",
  "interactive_dark_html": "https://storage.googleapis.com/anyplot-images/plots/parliament-basic/javascript/muix/plot-dark.html",
  "quality_score": 91.0,
  "license": "MIT",
  "guide": "https://anyplot.ai/llms.txt"
}
Part of Parliament Seat Chart on anyplot.ai.