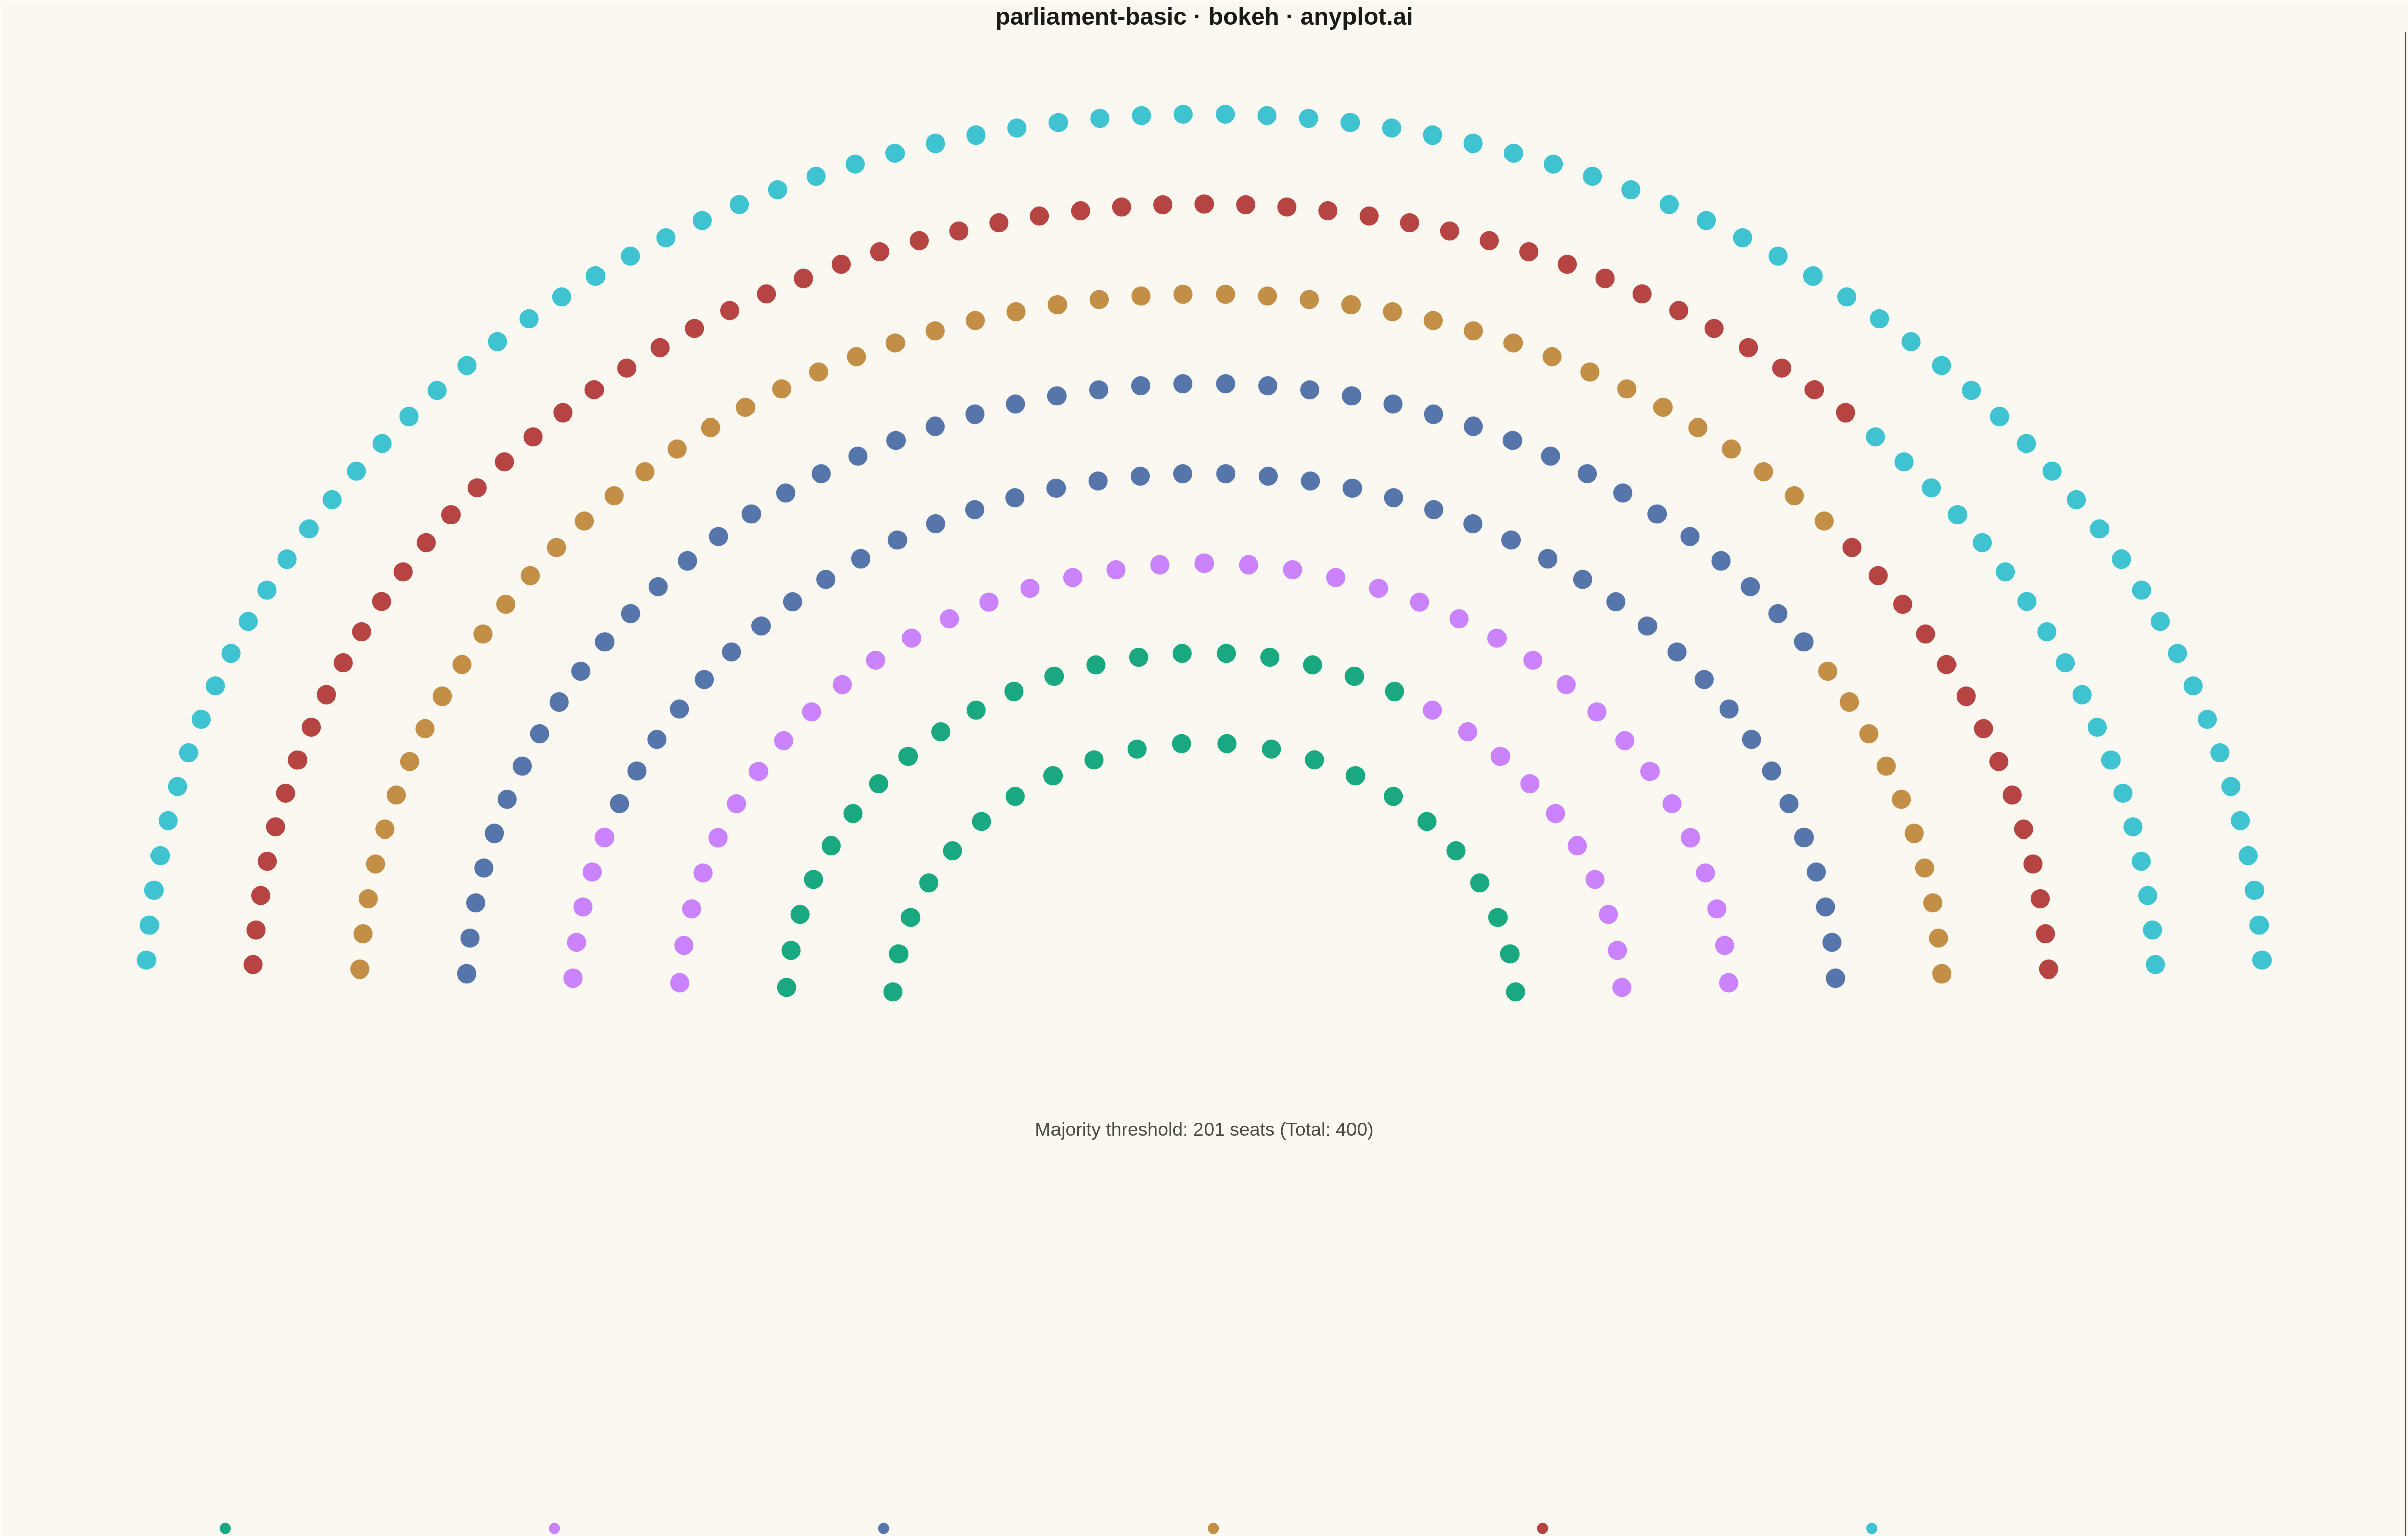
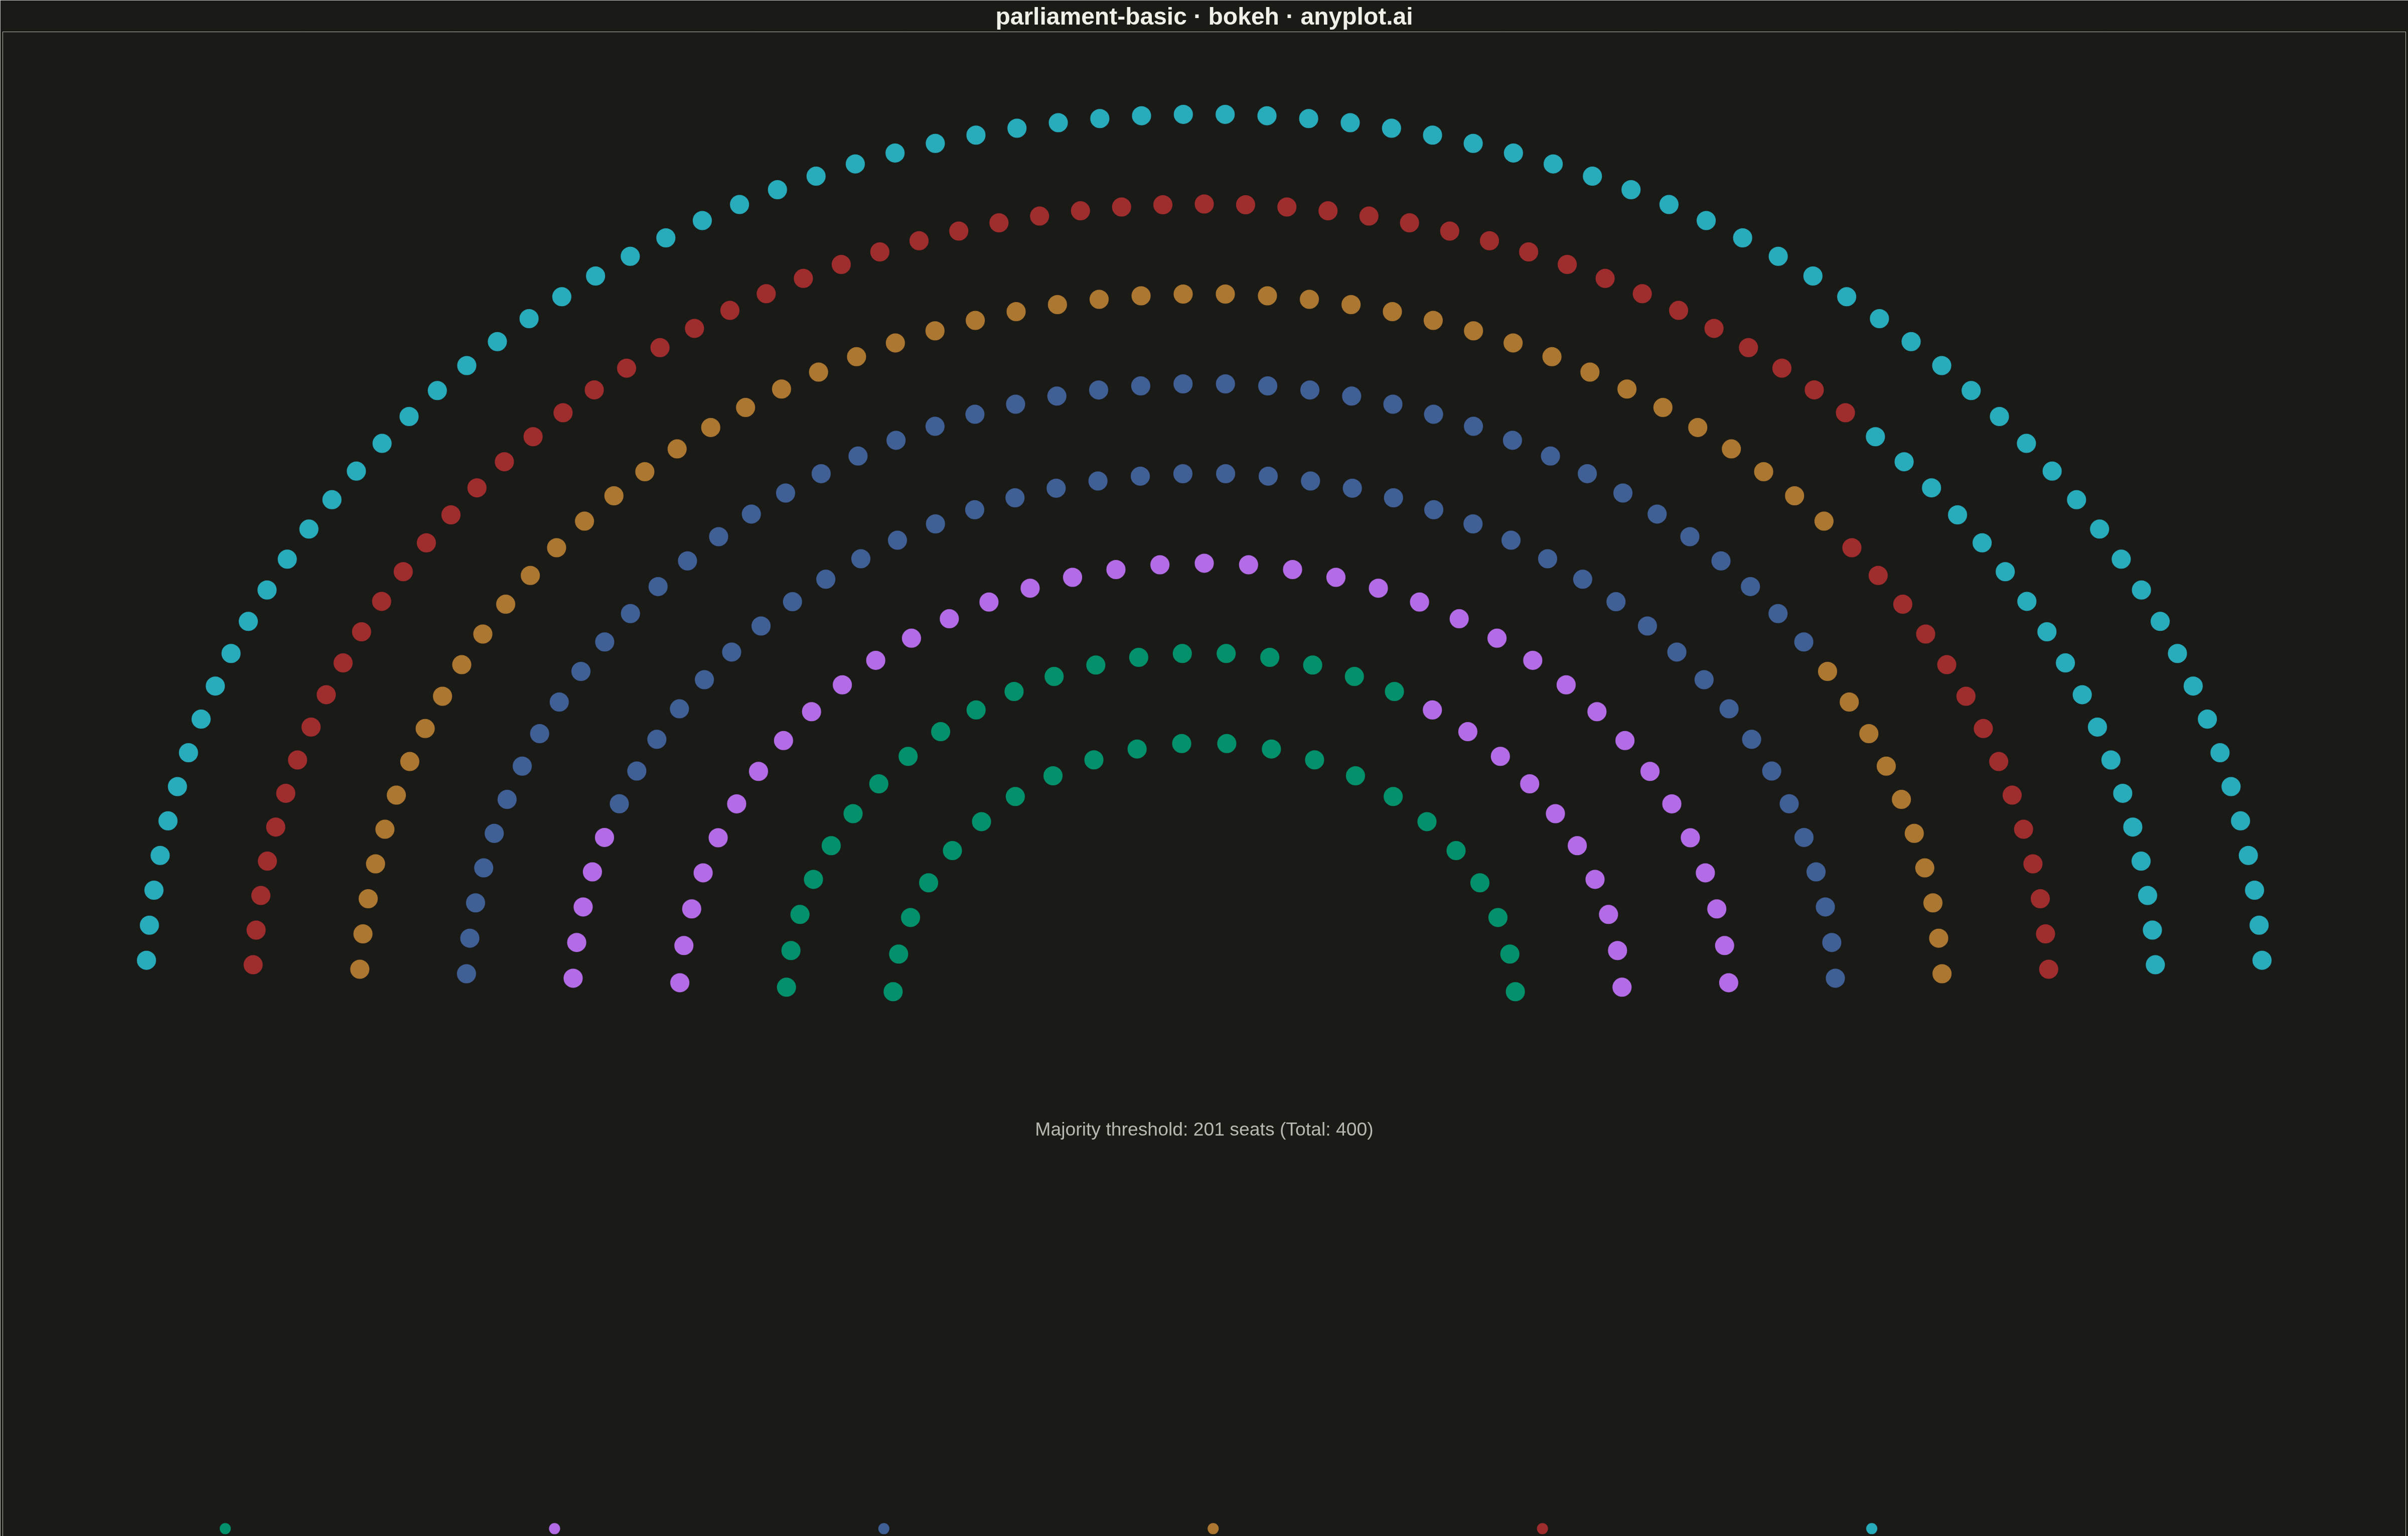
A semicircular parliament seat chart visualizes political party representation by arranging seats in concentric arcs. Each seat is displayed as an individual dot or segment, colored by party affiliation. This visualization is ideal for showing the composition of legislative bodies, election results, and voting bloc distributions at a glance.
""" anyplot.ai
parliament-basic: Parliament Seat Chart
Library: bokeh 3.9.0 | Python 3.13.13
Quality: 82/100 | Updated: 2026-05-17
"""

import os
import sys
import time
from pathlib import Path

import numpy as np


# Workaround: remove the script directory from sys.path to avoid shadowing bokeh module
script_dir = os.path.dirname(__file__)
sys.path = [p for p in sys.path if p != script_dir and os.path.abspath(p) != os.path.abspath(script_dir)]

from bokeh.io import output_file, save
from bokeh.models import ColumnDataSource
from bokeh.plotting import figure
from selenium import webdriver
from selenium.webdriver.chrome.options import Options


# Theme tokens
THEME = os.getenv("ANYPLOT_THEME", "light")
PAGE_BG = "#FAF8F1" if THEME == "light" else "#1A1A17"
ELEVATED_BG = "#FFFDF6" if THEME == "light" else "#242420"
INK = "#1A1A17" if THEME == "light" else "#F0EFE8"
INK_SOFT = "#4A4A44" if THEME == "light" else "#B8B7B0"

# Okabe-Ito palette (first series always #009E73)
IMPRINT = ["#009E73", "#C475FD", "#4467A3", "#BD8233", "#AE3030", "#2ABCCD"]

# Data - Political parties left-to-right by political spectrum
# Left parties first, then center, then right
parties = [
    "Green Coalition",
    "Labor Party",
    "Progressive Alliance",
    "Center Party",
    "Liberal Democrats",
    "Conservative Union",
]
seats = [42, 52, 85, 58, 67, 96]
total_seats = sum(seats)

# Calculate seat positions in semicircular arcs
rows = 8
base_radius = 0.35
radius_step = 0.12

# Calculate seats per row based on arc length (outer rows have more seats)
seats_per_row = []
for i in range(rows):
    radius = base_radius + i * radius_step
    row_capacity = int(radius * 30)
    seats_per_row.append(row_capacity)

# Normalize to match total seats
total_capacity = sum(seats_per_row)
seats_per_row = [int(s * total_seats / total_capacity) for s in seats_per_row]

# Adjust to match total exactly
diff = total_seats - sum(seats_per_row)
for i in range(abs(diff)):
    idx = (rows - 1 - i) % rows if diff > 0 else i % rows
    seats_per_row[idx] += 1 if diff > 0 else -1

# Build party assignment - each seat gets a party in order
party_assignments = []
for i, (party, seat_count) in enumerate(zip(parties, seats, strict=True)):
    party_assignments.extend([(party, IMPRINT[i % len(IMPRINT)])] * seat_count)

# Generate seat positions - fill row by row
x_positions = []
y_positions = []
seat_colors = []
seat_parties = []

seat_idx = 0
for row in range(rows):
    row_seat_count = seats_per_row[row]
    if row_seat_count <= 0 or seat_idx >= total_seats:
        continue

    radius = base_radius + row * radius_step
    angles = np.linspace(np.pi - 0.05, 0.05, row_seat_count)

    for angle in angles:
        if seat_idx >= total_seats:
            break
        x = radius * np.cos(angle)
        y = radius * np.sin(angle)
        x_positions.append(x)
        y_positions.append(y)
        party, color = party_assignments[seat_idx]
        seat_colors.append(color)
        seat_parties.append(party)
        seat_idx += 1

# Create data source
source = ColumnDataSource(data={"x": x_positions, "y": y_positions, "color": seat_colors, "party": seat_parties})

# Create figure - landscape format to accommodate legend below
p = figure(
    width=4800,
    height=3200,
    title="parliament-basic · bokeh · anyplot.ai",
    tools="",
    toolbar_location=None,
    x_range=(-1.35, 1.35),
    y_range=(-0.8, 1.3),
)

# Plot seats - increased size for better canvas visibility
p.scatter(x="x", y="y", source=source, color="color", size=40, alpha=0.9, line_color=PAGE_BG, line_width=2)

# Create legend with party colors and counts below the chart
legend_y_pos = -0.7
for i, (party, seat_count, color) in enumerate(zip(parties, seats, IMPRINT[: len(parties)], strict=True)):
    # Horizontal spacing for legend items
    x_offset = -1.1 + i * 0.37

    # Plot legend dot
    legend_dot = ColumnDataSource(data={"x": [x_offset], "y": [legend_y_pos]})
    p.scatter(x="x", y="y", source=legend_dot, color=color, size=24, alpha=0.9, line_color=PAGE_BG, line_width=2)

    # Add legend text
    p.text(
        x=[x_offset],
        y=[legend_y_pos - 0.15],
        text=[f"{party}\n({seat_count})"],
        text_align="center",
        text_font_size="16pt",
        text_color=INK_SOFT,
    )

# Add majority threshold annotation
majority = total_seats // 2 + 1
p.text(
    x=[0],
    y=[-0.18],
    text=[f"Majority threshold: {majority} seats (Total: {total_seats})"],
    text_align="center",
    text_font_size="28pt",
    text_color=INK_SOFT,
)

# Style the plot
p.title.text_font_size = "36pt"
p.title.text_color = INK
p.title.align = "center"
p.xaxis.visible = False
p.yaxis.visible = False
p.xgrid.visible = False
p.ygrid.visible = False
p.outline_line_color = INK_SOFT
p.background_fill_color = PAGE_BG
p.border_fill_color = PAGE_BG

# Save HTML
output_file(f"plot-{THEME}.html")
save(p)

# Screenshot with headless Chrome via Selenium
W, H = 4800, 3200  # Match figure dimensions
opts = Options()
for arg in (
    "--headless=new",
    "--no-sandbox",
    "--disable-dev-shm-usage",
    "--disable-gpu",
    f"--window-size={W},{H}",
    "--hide-scrollbars",
):
    opts.add_argument(arg)

try:
    driver = webdriver.Chrome(options=opts)
    driver.set_window_size(W, H)
    html_path = Path(f"plot-{THEME}.html").resolve()
    driver.get(f"file://{html_path}")
    time.sleep(2)  # Let bokeh's JS render the canvas
    driver.save_screenshot(f"plot-{THEME}.png")
finally:
    try:
        driver.quit()
    except Exception:
        pass
Runnable source as JSON, for any HTTP client: https://api.anyplot.ai/specs/parliament-basic/bokeh/code. Any spec id and library id listed in llms-full.txt fit the same URL shape; every URL below is complete and callable.
{
  "spec_id": "parliament-basic",
  "language": "python",
  "library": "bokeh",
  "page": "https://anyplot.ai/parliament-basic/python/bokeh",
  "hub": "https://anyplot.ai/parliament-basic",
  "code_json": "https://api.anyplot.ai/specs/parliament-basic/bokeh/code",
  "spec_json": "https://api.anyplot.ai/specs/parliament-basic",
  "render_light_png": "https://storage.googleapis.com/anyplot-images/plots/parliament-basic/python/bokeh/plot-light.png",
  "render_dark_png": "https://storage.googleapis.com/anyplot-images/plots/parliament-basic/python/bokeh/plot-dark.png",
  "interactive_light_html": "https://storage.googleapis.com/anyplot-images/plots/parliament-basic/python/bokeh/plot-light.html",
  "interactive_dark_html": "https://storage.googleapis.com/anyplot-images/plots/parliament-basic/python/bokeh/plot-dark.html",
  "quality_score": 82.0,
  "license": "MIT",
  "guide": "https://anyplot.ai/llms.txt"
}
Part of Parliament Seat Chart on anyplot.ai.