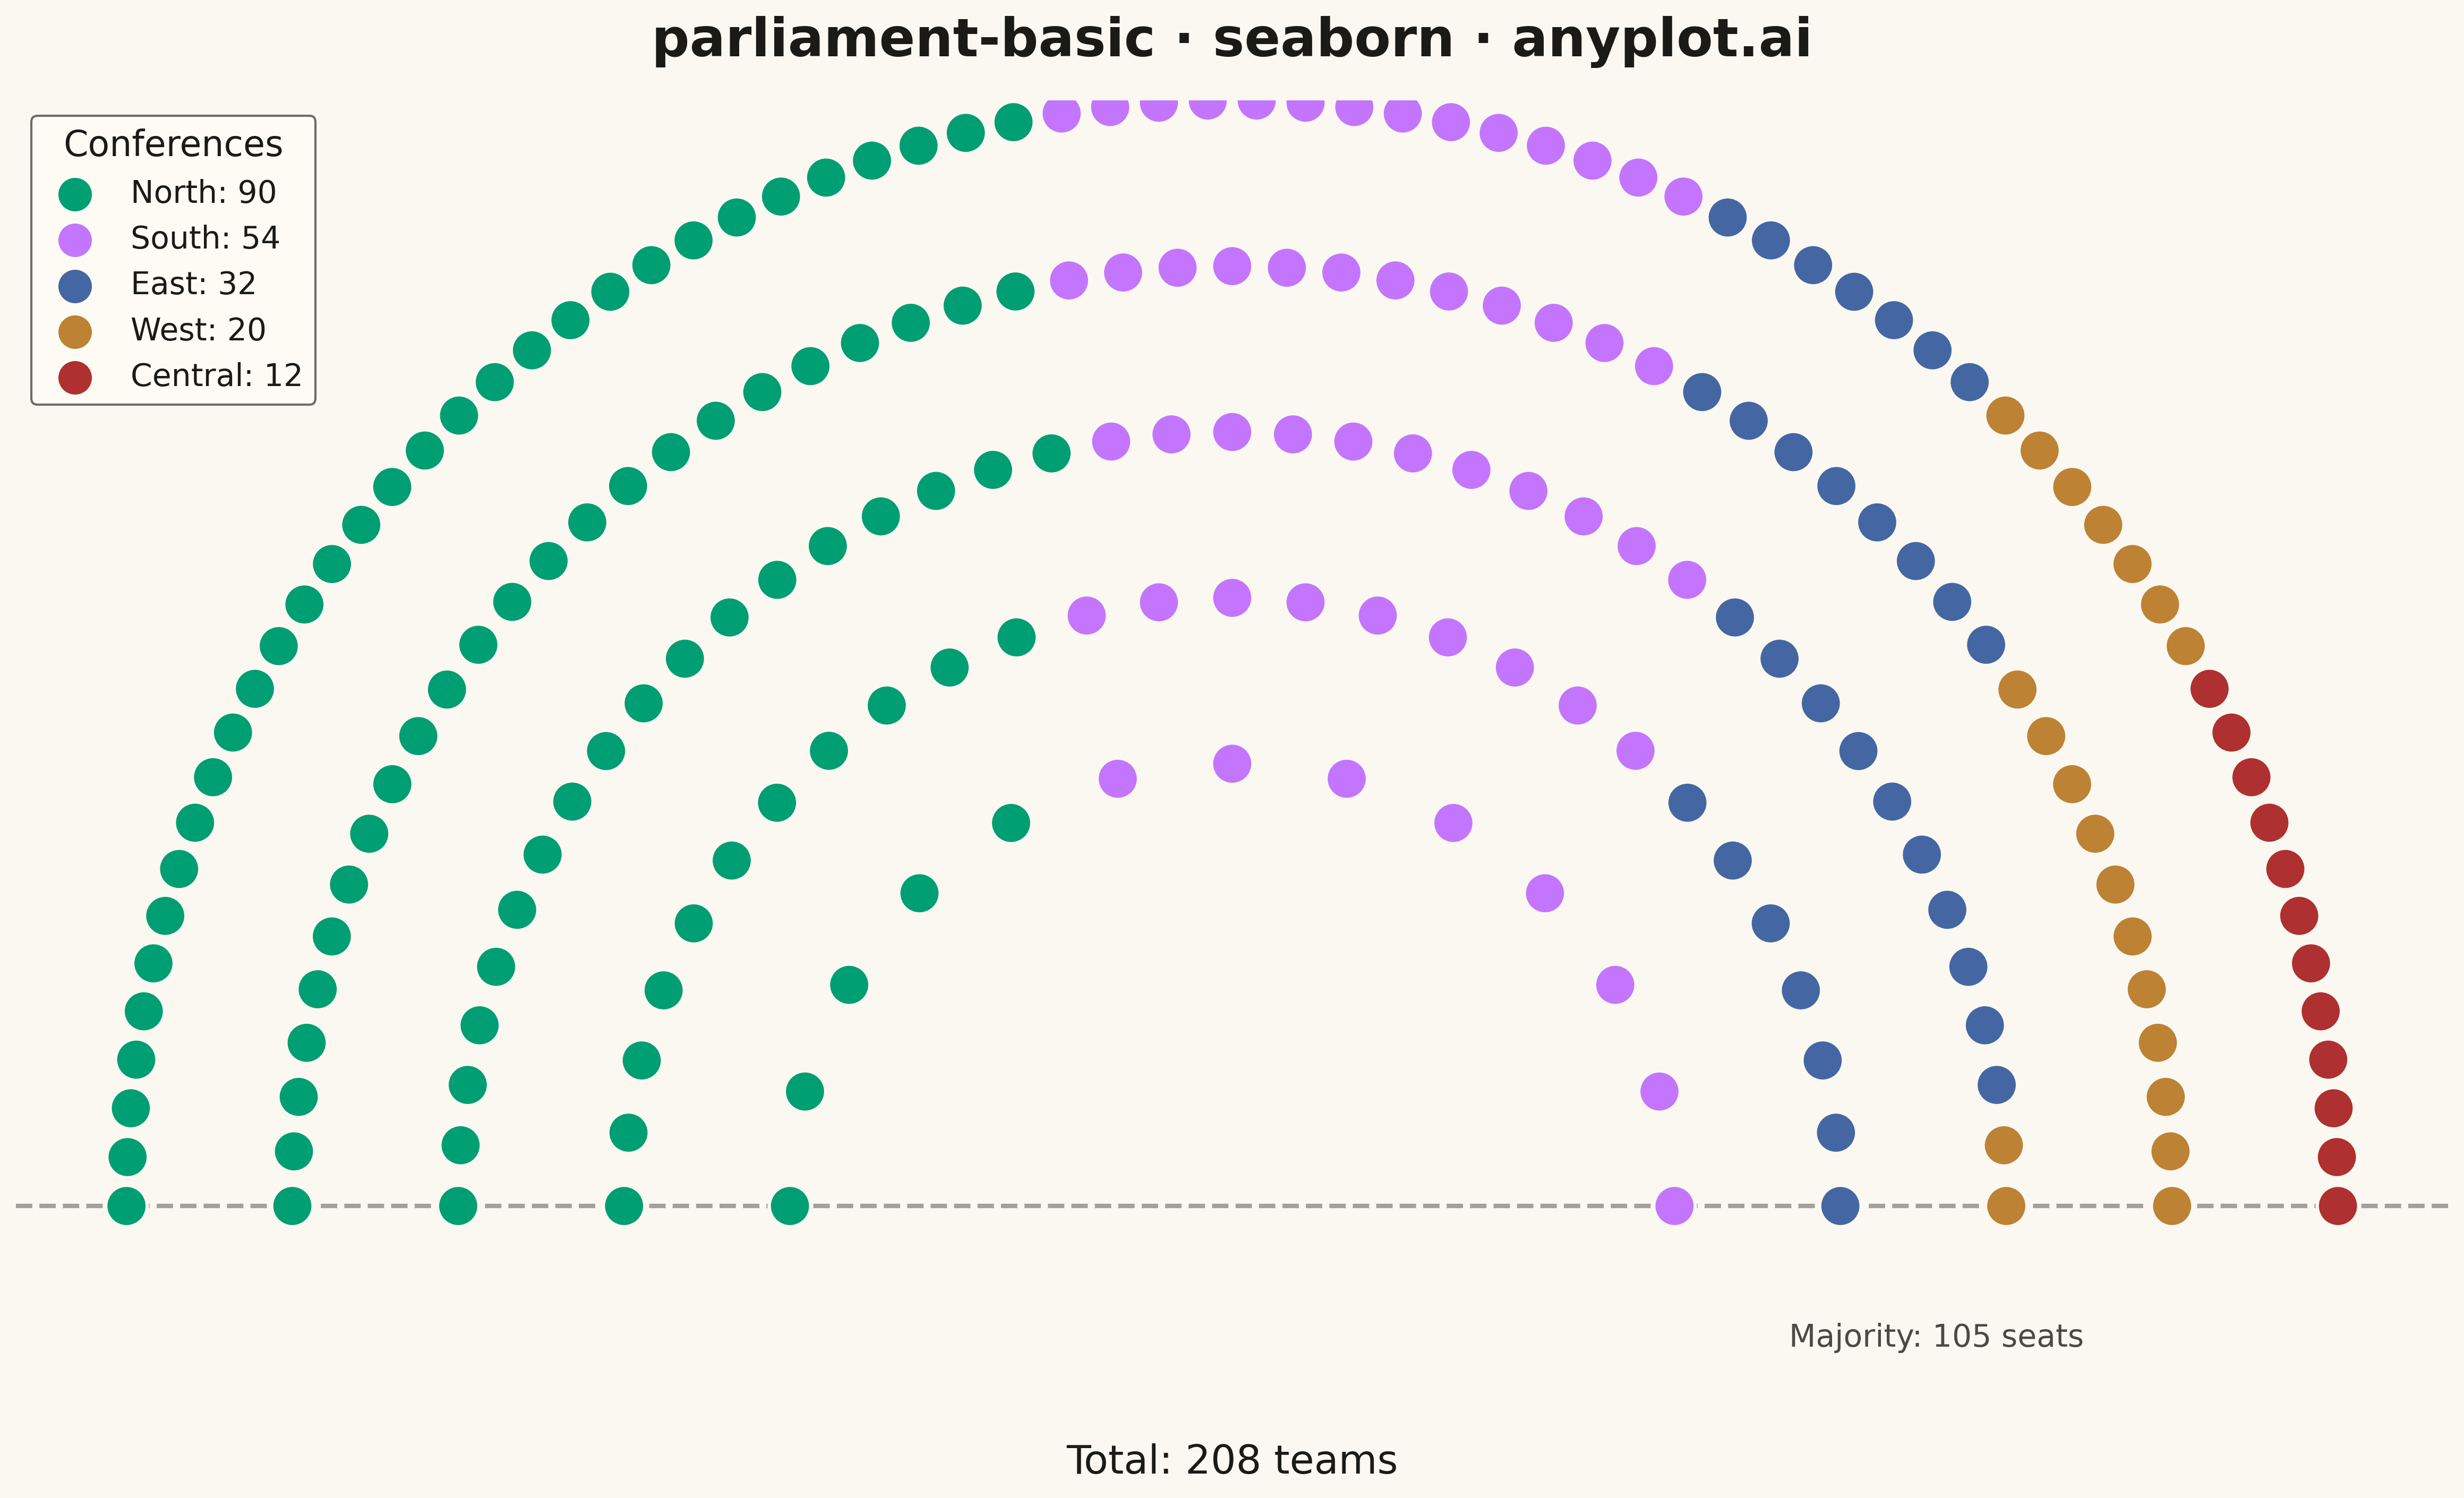
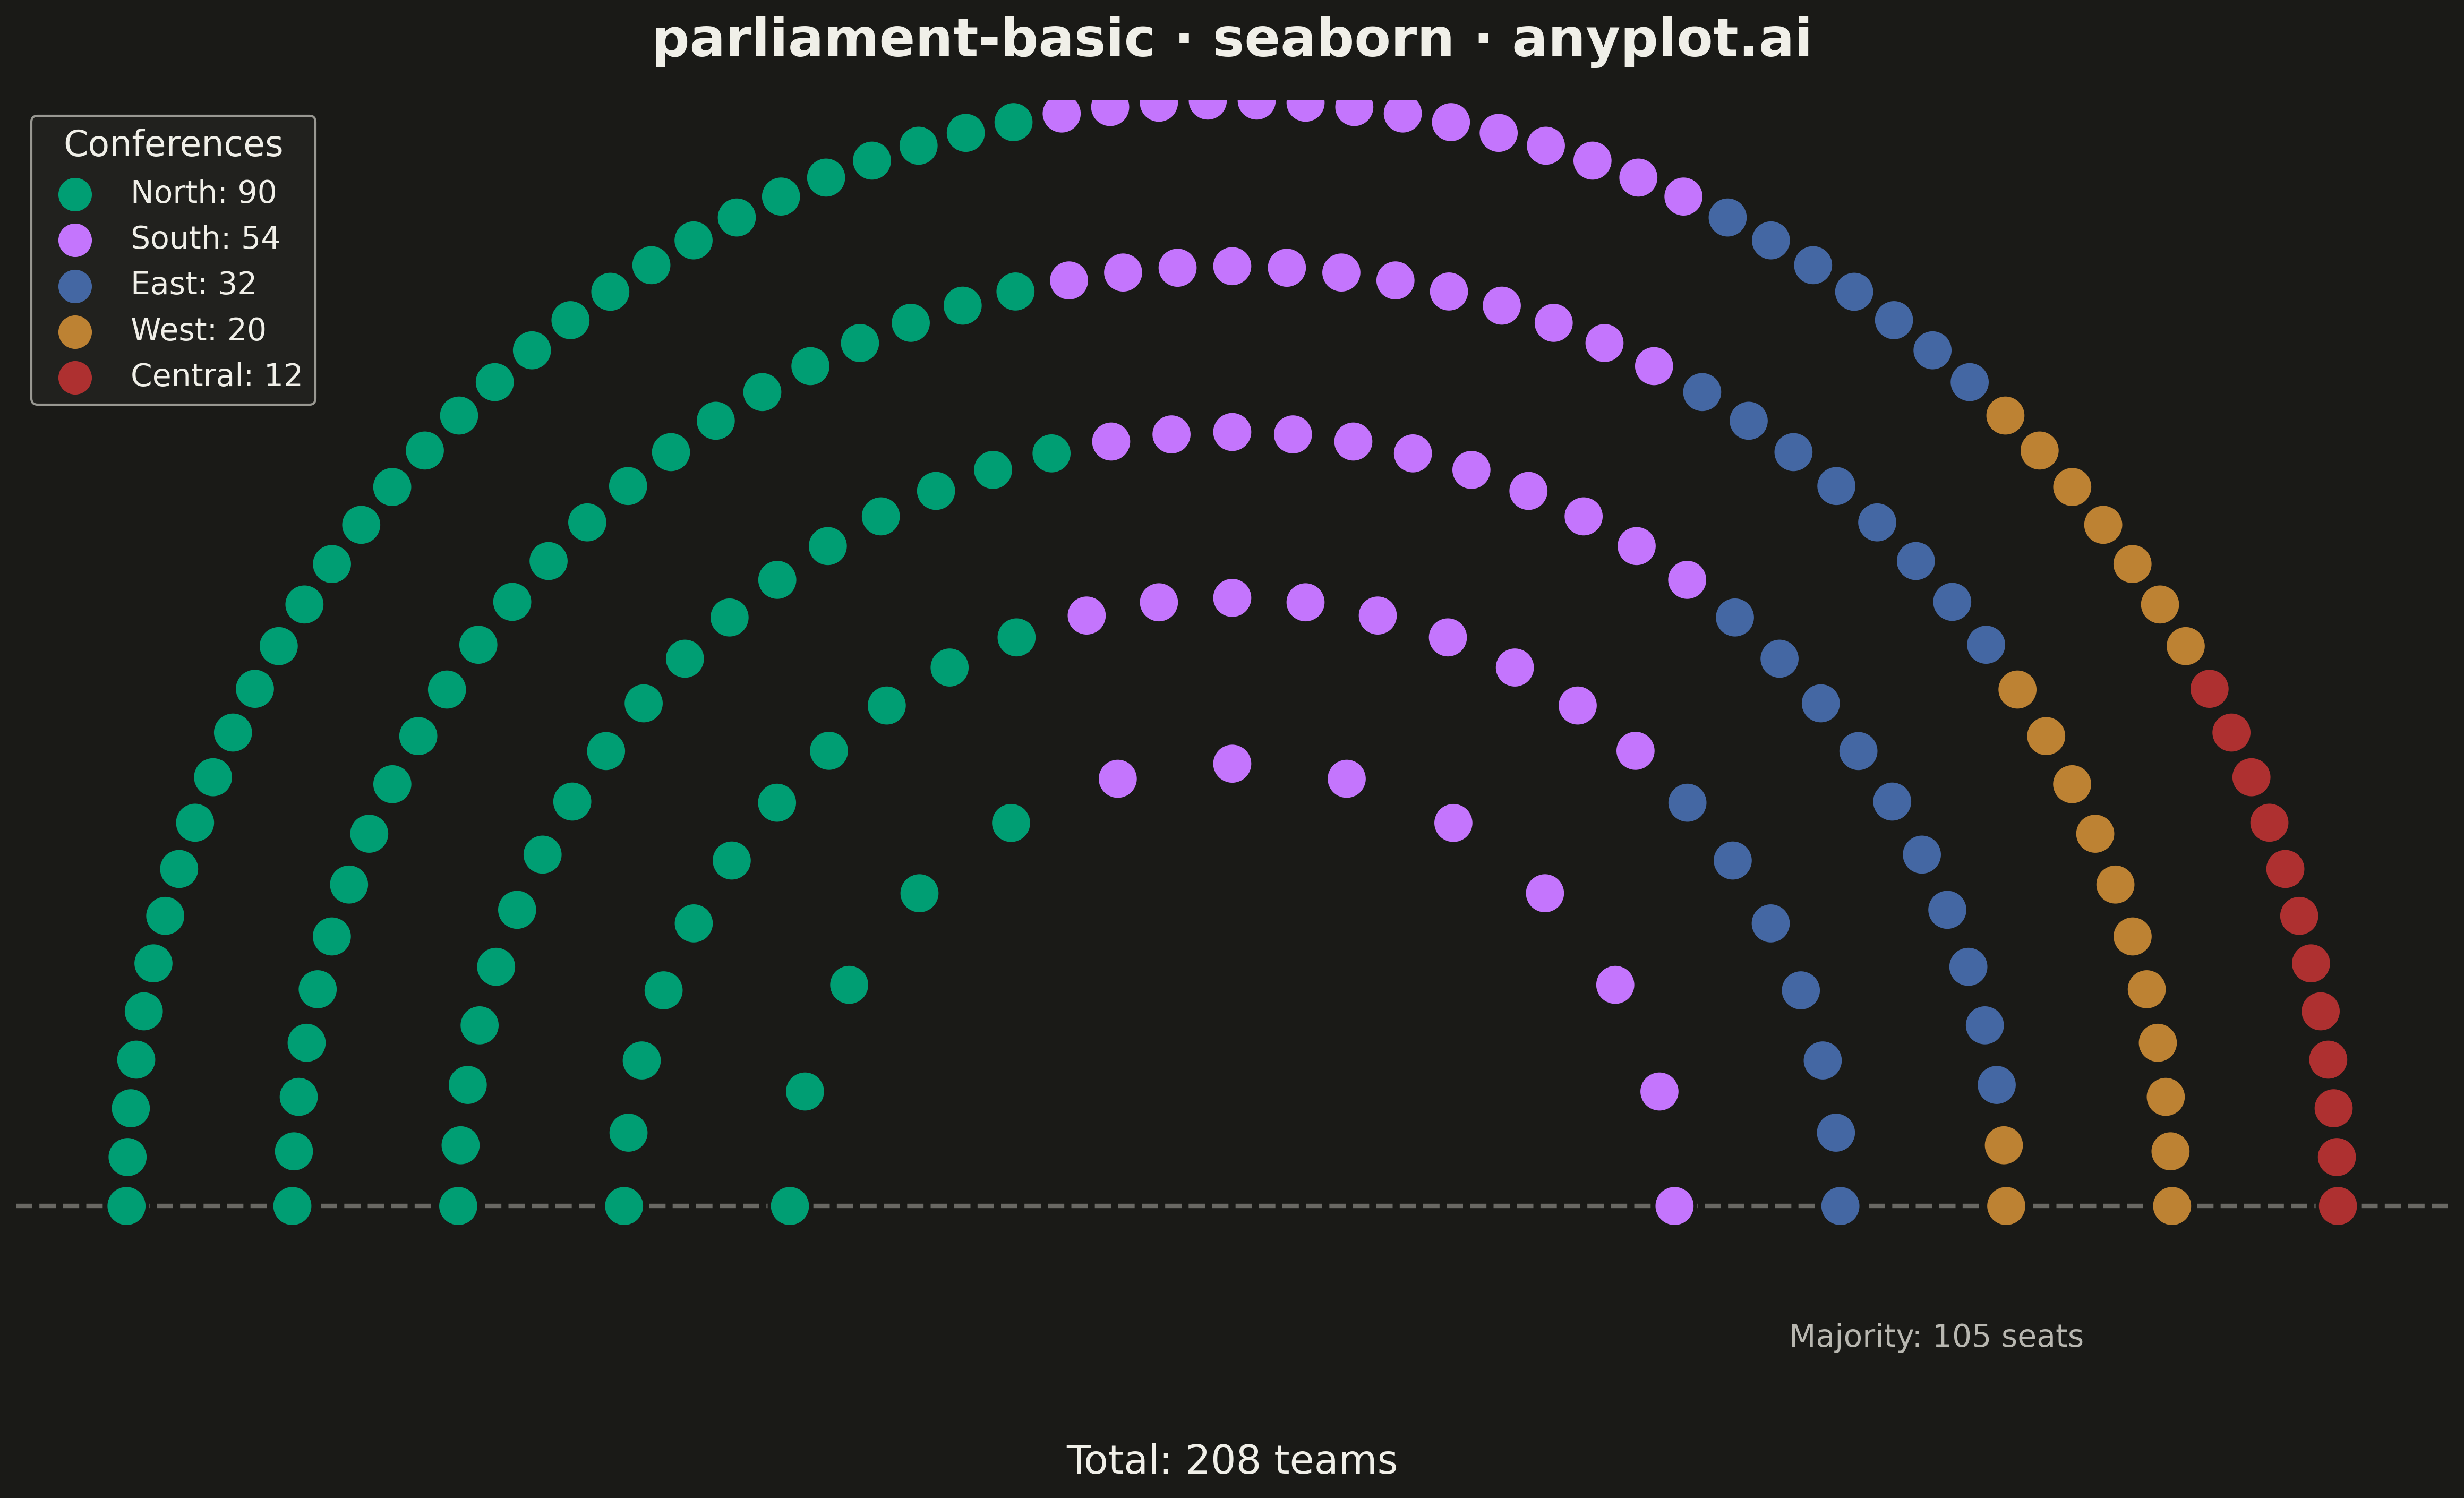
A semicircular parliament seat chart visualizes political party representation by arranging seats in concentric arcs. Each seat is displayed as an individual dot or segment, colored by party affiliation. This visualization is ideal for showing the composition of legislative bodies, election results, and voting bloc distributions at a glance.
""" anyplot.ai
parliament-basic: Parliament Seat Chart
Library: seaborn 0.13.2 | Python 3.13.13
Quality: 86/100 | Updated: 2026-05-17
"""

import os

import matplotlib.pyplot as plt
import numpy as np
import pandas as pd
import seaborn as sns


# Theme tokens
THEME = os.getenv("ANYPLOT_THEME", "light")
PAGE_BG = "#FAF8F1" if THEME == "light" else "#1A1A17"
ELEVATED_BG = "#FFFDF6" if THEME == "light" else "#242420"
INK = "#1A1A17" if THEME == "light" else "#F0EFE8"
INK_SOFT = "#4A4A44" if THEME == "light" else "#B8B7B0"

# Okabe-Ito palette
IMPRINT = [
    "#009E73",  # bluish green (brand)
    "#C475FD",  # vermillion
    "#4467A3",  # blue
    "#BD8233",  # reddish purple
    "#AE3030",  # orange
    "#2ABCCD",  # sky blue
]

# Data: Sports league team distribution across regional conferences
# Different decay pattern: geometric progression instead of linear
conferences = ["North", "South", "East", "West", "Central"]
teams = [90, 54, 32, 20, 12]  # Geometric decay pattern (roughly 0.6x each step)
total_seats = sum(teams)

# Set seaborn theme with proper chrome tokens
sns.set_theme(
    style="ticks",
    rc={
        "figure.facecolor": PAGE_BG,
        "axes.facecolor": PAGE_BG,
        "axes.edgecolor": INK_SOFT,
        "axes.labelcolor": INK,
        "text.color": INK,
        "xtick.color": INK_SOFT,
        "ytick.color": INK_SOFT,
        "grid.color": INK,
        "grid.alpha": 0.10,
        "legend.facecolor": ELEVATED_BG,
        "legend.edgecolor": INK_SOFT,
    },
)

# Create figure
fig, ax = plt.subplots(figsize=(16, 9))

# Calculate parliament layout - semicircular arrangement with 5 rows
n_rows = 5
row_proportions = [(i + 1) for i in range(n_rows)]
total_prop = sum(row_proportions)
seats_per_row = [int(total_seats * p / total_prop) for p in row_proportions]
seats_per_row[-1] += total_seats - sum(seats_per_row)  # Adjust for rounding

# Create all seat positions in concentric arcs
all_positions = []
for row_idx, n_seats_row in enumerate(seats_per_row):
    radius = 0.4 + row_idx * 0.15
    angles = np.linspace(np.pi, 0, n_seats_row)
    for angle in angles:
        all_positions.append((radius * np.cos(angle), radius * np.sin(angle), row_idx))

# Sort positions left to right for natural group ordering
all_positions.sort(key=lambda p: (p[0], -p[1]))

# Build DataFrame for seaborn plotting
x_coords, y_coords, group_labels = [], [], []
seat_idx = 0
for group_idx, n_seats in enumerate(teams):
    for _ in range(n_seats):
        if seat_idx < len(all_positions):
            x_coords.append(all_positions[seat_idx][0])
            y_coords.append(all_positions[seat_idx][1])
            group_labels.append(conferences[group_idx])
            seat_idx += 1

# Create DataFrame for seaborn
df = pd.DataFrame({"x": x_coords, "y": y_coords, "group": group_labels})

# Plot seats using seaborn scatterplot
sns.scatterplot(
    data=df,
    x="x",
    y="y",
    hue="group",
    hue_order=conferences,
    palette=IMPRINT[: len(conferences)],
    s=350,
    edgecolor=PAGE_BG,
    linewidth=1.5,
    legend=False,
    ax=ax,
    zorder=2,
)

# Add majority threshold line
majority = total_seats // 2 + 1
ax.axhline(y=0, color=INK_SOFT, linestyle="--", linewidth=2, alpha=0.5, zorder=1)
ax.text(0.85, 0.02, f"Majority: {majority} seats", fontsize=14, color=INK_SOFT, ha="right", transform=ax.transAxes)

# Create legend with seat counts
legend_elements = [
    plt.scatter([], [], c=[IMPRINT[i % len(IMPRINT)]], s=200, label=f"{conf}: {count}")
    for i, (conf, count) in enumerate(zip(conferences, teams, strict=True))
]
ax.legend(
    handles=legend_elements,
    loc="upper left",
    fontsize=14,
    frameon=True,
    facecolor=ELEVATED_BG,
    edgecolor=INK_SOFT,
    title="Conferences",
    title_fontsize=16,
)

# Style adjustments
ax.set_xlim(-1.1, 1.1)
ax.set_ylim(-0.15, 1.0)
ax.set_aspect("equal")
ax.axis("off")

# Title
ax.set_title("parliament-basic · seaborn · anyplot.ai", fontsize=24, fontweight="bold", pad=20, color=INK)

# Add total seats annotation
ax.text(0.5, -0.08, f"Total: {total_seats} teams", fontsize=18, ha="center", transform=ax.transAxes, color=INK)

plt.tight_layout()
plt.savefig(f"plot-{THEME}.png", dpi=300, bbox_inches="tight", facecolor=PAGE_BG)
Runnable source as JSON, for any HTTP client: https://api.anyplot.ai/specs/parliament-basic/seaborn/code. Any spec id and library id listed in llms-full.txt fit the same URL shape; every URL below is complete and callable.
{
  "spec_id": "parliament-basic",
  "language": "python",
  "library": "seaborn",
  "page": "https://anyplot.ai/parliament-basic/python/seaborn",
  "hub": "https://anyplot.ai/parliament-basic",
  "code_json": "https://api.anyplot.ai/specs/parliament-basic/seaborn/code",
  "spec_json": "https://api.anyplot.ai/specs/parliament-basic",
  "render_light_png": "https://storage.googleapis.com/anyplot-images/plots/parliament-basic/python/seaborn/plot-light.png",
  "render_dark_png": "https://storage.googleapis.com/anyplot-images/plots/parliament-basic/python/seaborn/plot-dark.png",
  "quality_score": 86.0,
  "license": "MIT",
  "guide": "https://anyplot.ai/llms.txt"
}
Part of Parliament Seat Chart on anyplot.ai.