The same plot in 14 other libraries — Python: Altair, Bokeh, lets-plot, Matplotlib, Plotly, plotnine, Pygal, Seaborn; Julia: Makie.jl; JavaScript: Chart.js, D3.js, Apache ECharts, Highcharts, MUI X Charts. Compare all 15 side by side: Parliament Seat Chart in Python, R, Julia and JavaScript.
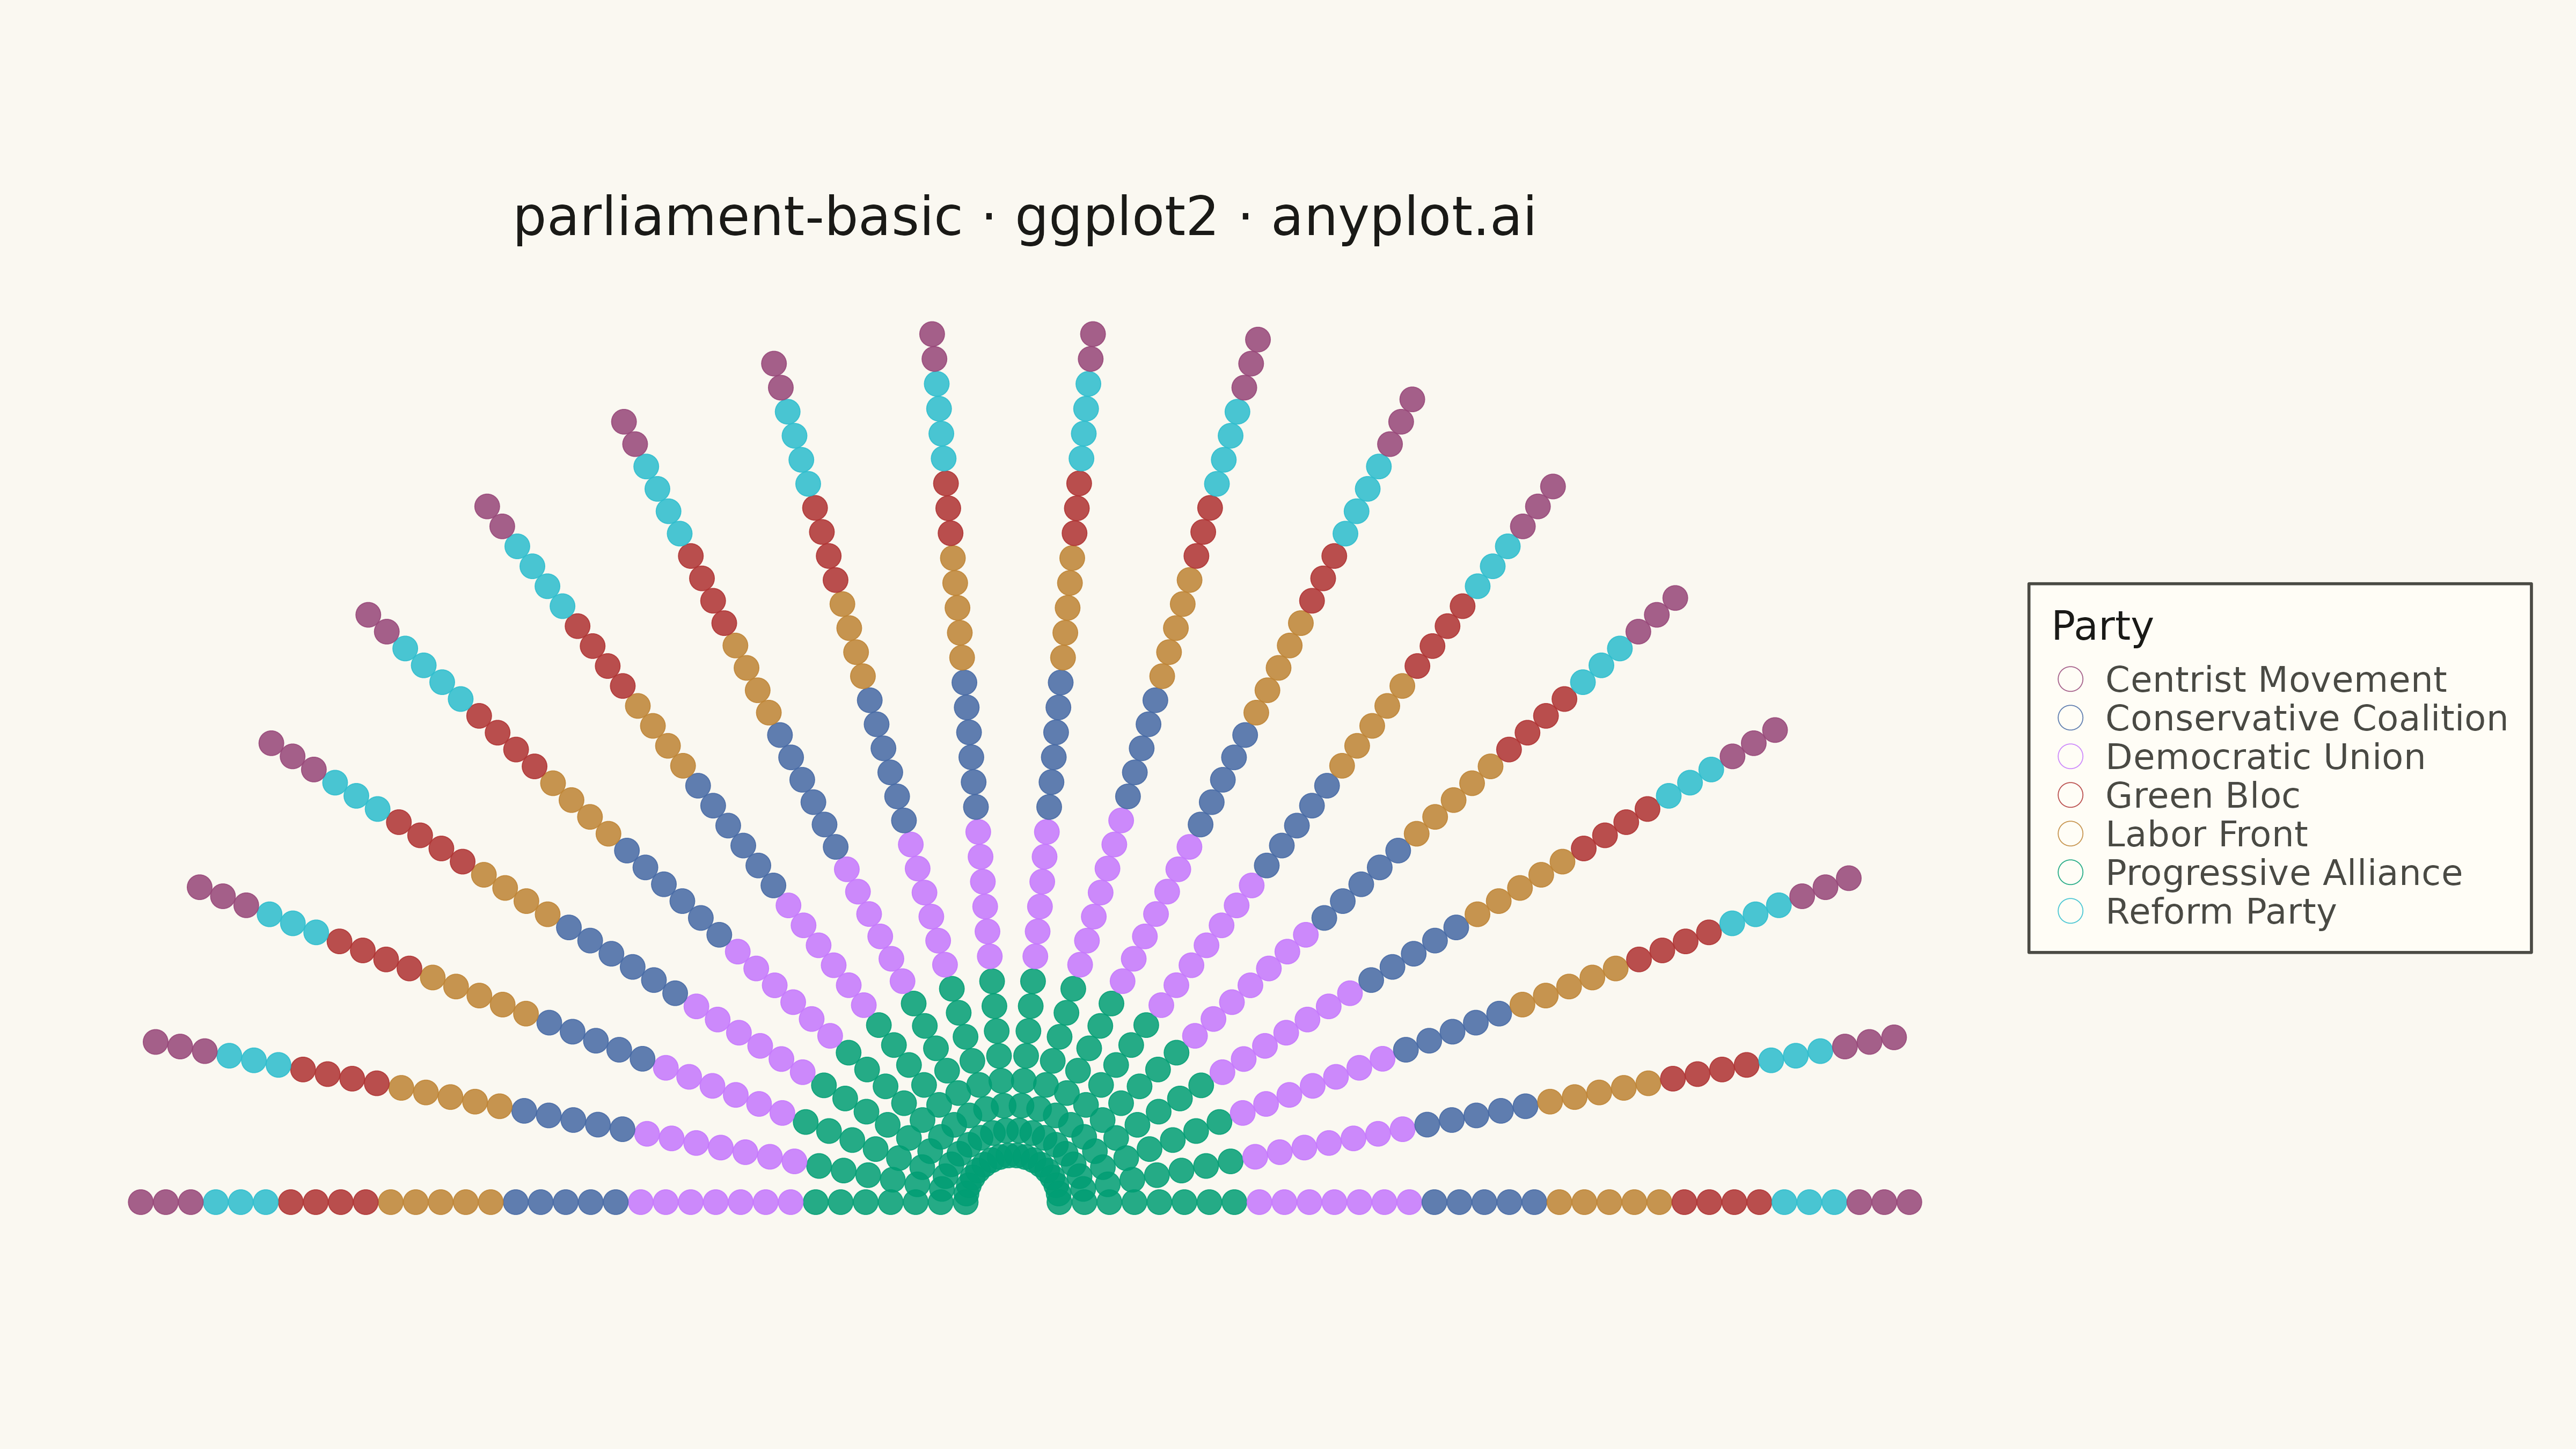
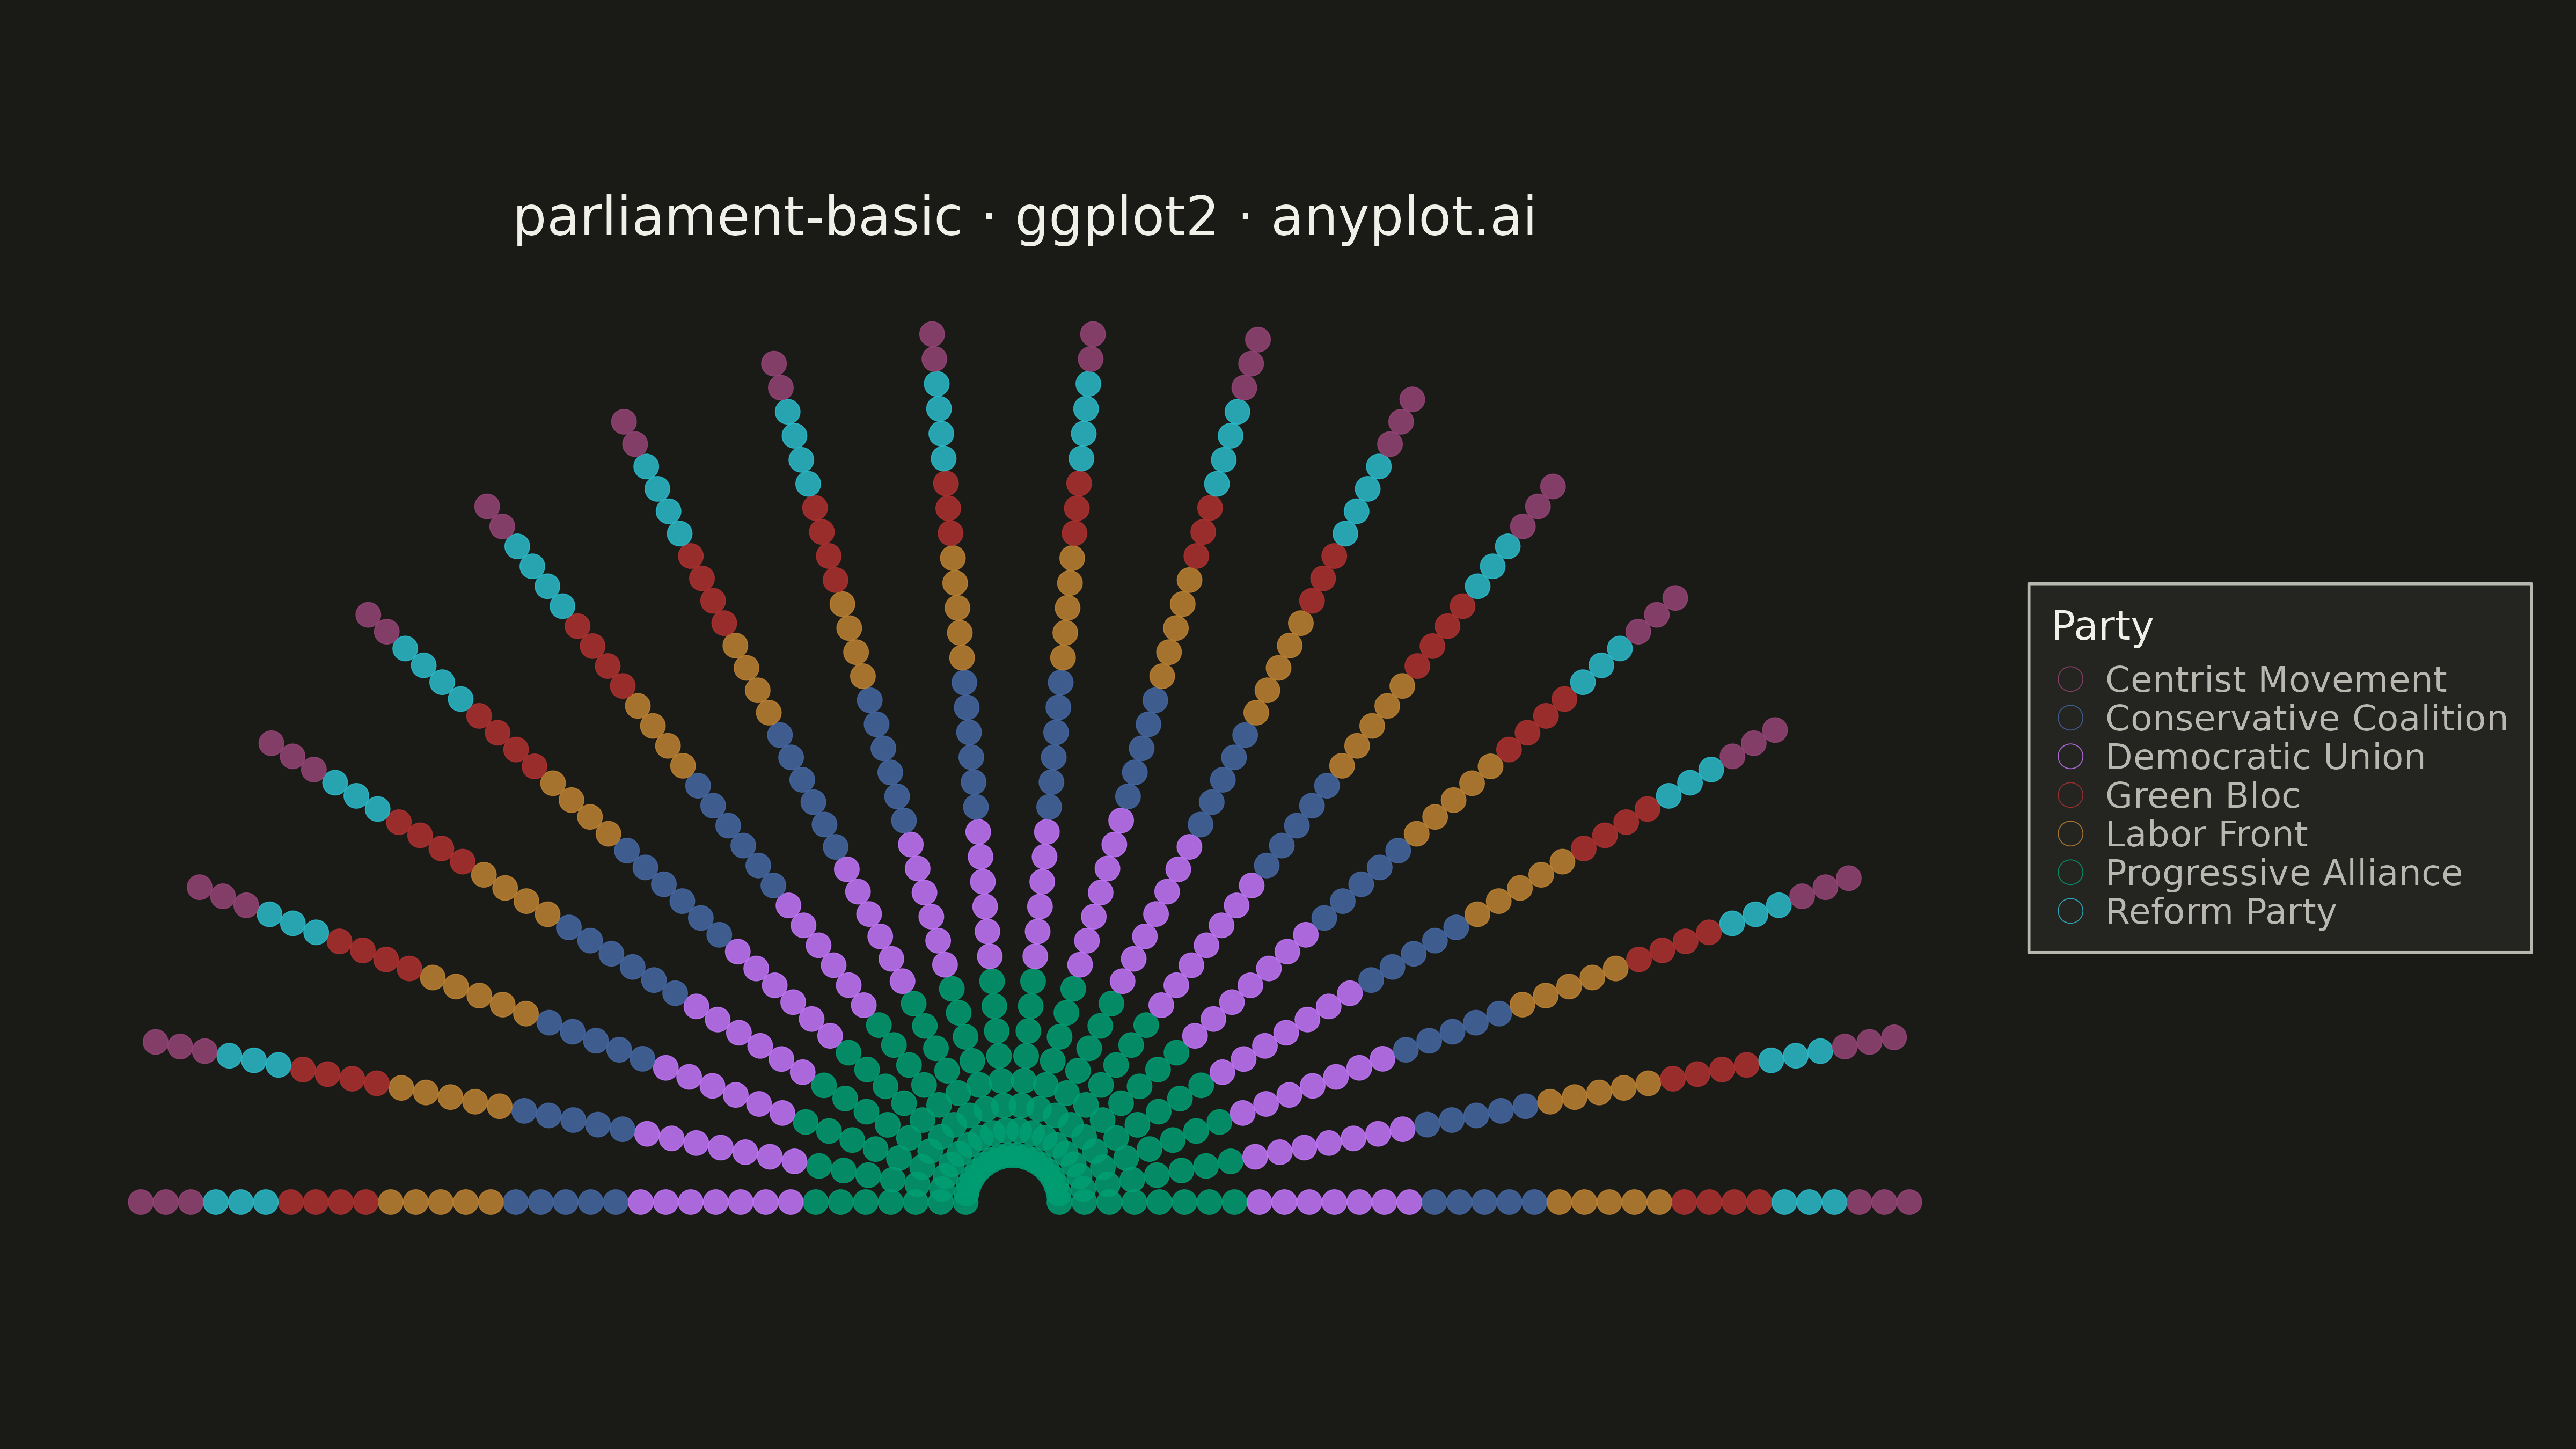
A semicircular parliament seat chart visualizes political party representation by arranging seats in concentric arcs. Each seat is displayed as an individual dot or segment, colored by party affiliation. This visualization is ideal for showing the composition of legislative bodies, election results, and voting bloc distributions at a glance.
#' anyplot.ai
#' parliament-basic: Parliament Seat Chart
#' Library: ggplot2 3.5.1 | R 4.4.1
#' Quality: 91/100 | Created: 2026-05-17

library(ggplot2)
library(dplyr)
library(tidyr)
library(ragg)

set.seed(42)

# --- Theme tokens -----------------------------------------------------------
THEME       <- Sys.getenv("ANYPLOT_THEME", "light")
PAGE_BG     <- if (THEME == "light") "#FAF8F1" else "#1A1A17"
ELEVATED_BG <- if (THEME == "light") "#FFFDF6" else "#242420"
INK         <- if (THEME == "light") "#1A1A17" else "#F0EFE8"
INK_SOFT    <- if (THEME == "light") "#4A4A44" else "#B8B7B0"
IMPRINT   <- c("#009E73", "#C475FD", "#4467A3", "#BD8233",
                 "#AE3030", "#2ABCCD", "#954477")

# --- Data -------------------------------------------------------------------
# Create party data with seat counts
parties <- data.frame(
  party = c("Progressive Alliance", "Democratic Union", "Conservative Coalition",
            "Labor Front", "Green Bloc", "Reform Party", "Centrist Movement"),
  seats = c(142, 118, 97, 85, 68, 62, 48),
  stringsAsFactors = FALSE
)

# Generate seat coordinates in semicircular parliament layout
# Semicircle arrangement: left to right, bottom to top (multiple arcs)
seats_per_row <- 18
total_seats <- sum(parties$seats)
num_rows <- ceiling(total_seats / seats_per_row)

# Create seat positions
seat_data <- data.frame()
seat_idx <- 1

for (i in 1:nrow(parties)) {
  party_name <- parties$party[i]
  party_seats <- parties$seats[i]
  party_color_idx <- min(i, length(IMPRINT))

  for (j in 1:party_seats) {
    row_idx <- ceiling(seat_idx / seats_per_row)
    col_idx <- ((seat_idx - 1) %% seats_per_row) + 1

    # Semicircular geometry: position seats in concentric arcs
    # Angle spans from 0 to pi (semicircle)
    angle <- (col_idx - 1) / (seats_per_row - 1) * pi
    radius <- 1.5 + (row_idx - 1) * 0.8

    x <- radius * cos(angle)
    y <- radius * sin(angle)

    seat_data <- rbind(seat_data, data.frame(
      x = x,
      y = y,
      party = party_name,
      color_idx = party_color_idx,
      seat_id = seat_idx,
      stringsAsFactors = FALSE
    ))

    seat_idx <- seat_idx + 1
  }
}

# Map color indices to actual colors
seat_data$color <- IMPRINT[seat_data$color_idx]

# --- Plot -------------------------------------------------------------------
p <- ggplot(seat_data, aes(x = x, y = y, fill = party)) +
  geom_point(
    aes(color = party),
    size = 5,
    alpha = 0.85,
    shape = 21,
    stroke = 0.3,
    show.legend = TRUE
  ) +
  scale_color_manual(
    values = setNames(IMPRINT[1:nrow(parties)], parties$party),
    guide = guide_legend(ncol = 1, title = "Party", title.position = "top")
  ) +
  scale_fill_manual(
    values = setNames(IMPRINT[1:nrow(parties)], parties$party),
    guide = "none"
  ) +
  coord_fixed() +
  labs(
    title = "parliament-basic · ggplot2 · anyplot.ai",
    x = NULL,
    y = NULL
  ) +
  theme_minimal(base_size = 14) +
  theme(
    plot.background   = element_rect(fill = PAGE_BG, color = PAGE_BG),
    panel.background  = element_rect(fill = PAGE_BG, color = NA),
    panel.grid.major  = element_blank(),
    panel.grid.minor  = element_blank(),
    panel.border      = element_blank(),
    axis.title        = element_blank(),
    axis.text         = element_blank(),
    axis.ticks        = element_blank(),
    plot.title        = element_text(color = INK, size = 24, hjust = 0.5, margin = margin(b = 20)),
    plot.margin       = margin(20, 20, 20, 20),
    legend.background = element_rect(fill = ELEVATED_BG, color = INK_SOFT),
    legend.text       = element_text(color = INK_SOFT, size = 16),
    legend.title      = element_text(color = INK, size = 18),
    legend.position   = "right",
    legend.margin     = margin(10, 10, 10, 10)
  )

# --- Save -------------------------------------------------------------------
ggsave(
  filename = sprintf("plot-%s.png", THEME),
  plot     = p,
  device   = ragg::agg_png,
  width    = 16,
  height   = 9,
  units    = "in",
  dpi      = 300
)
Runnable source as JSON, for any HTTP client: https://api.anyplot.ai/specs/parliament-basic/ggplot2/code. Any spec id and library id listed in llms-full.txt fit the same URL shape; every URL below is complete and callable.
{
  "spec_id": "parliament-basic",
  "language": "r",
  "library": "ggplot2",
  "page": "https://anyplot.ai/parliament-basic/r/ggplot2",
  "hub": "https://anyplot.ai/parliament-basic",
  "code_json": "https://api.anyplot.ai/specs/parliament-basic/ggplot2/code",
  "spec_json": "https://api.anyplot.ai/specs/parliament-basic",
  "render_light_png": "https://storage.googleapis.com/anyplot-images/plots/parliament-basic/r/ggplot2/plot-light.png",
  "render_dark_png": "https://storage.googleapis.com/anyplot-images/plots/parliament-basic/r/ggplot2/plot-dark.png",
  "quality_score": 91.0,
  "license": "MIT",
  "guide": "https://anyplot.ai/llms.txt"
}
Part of Parliament Seat Chart on anyplot.ai.