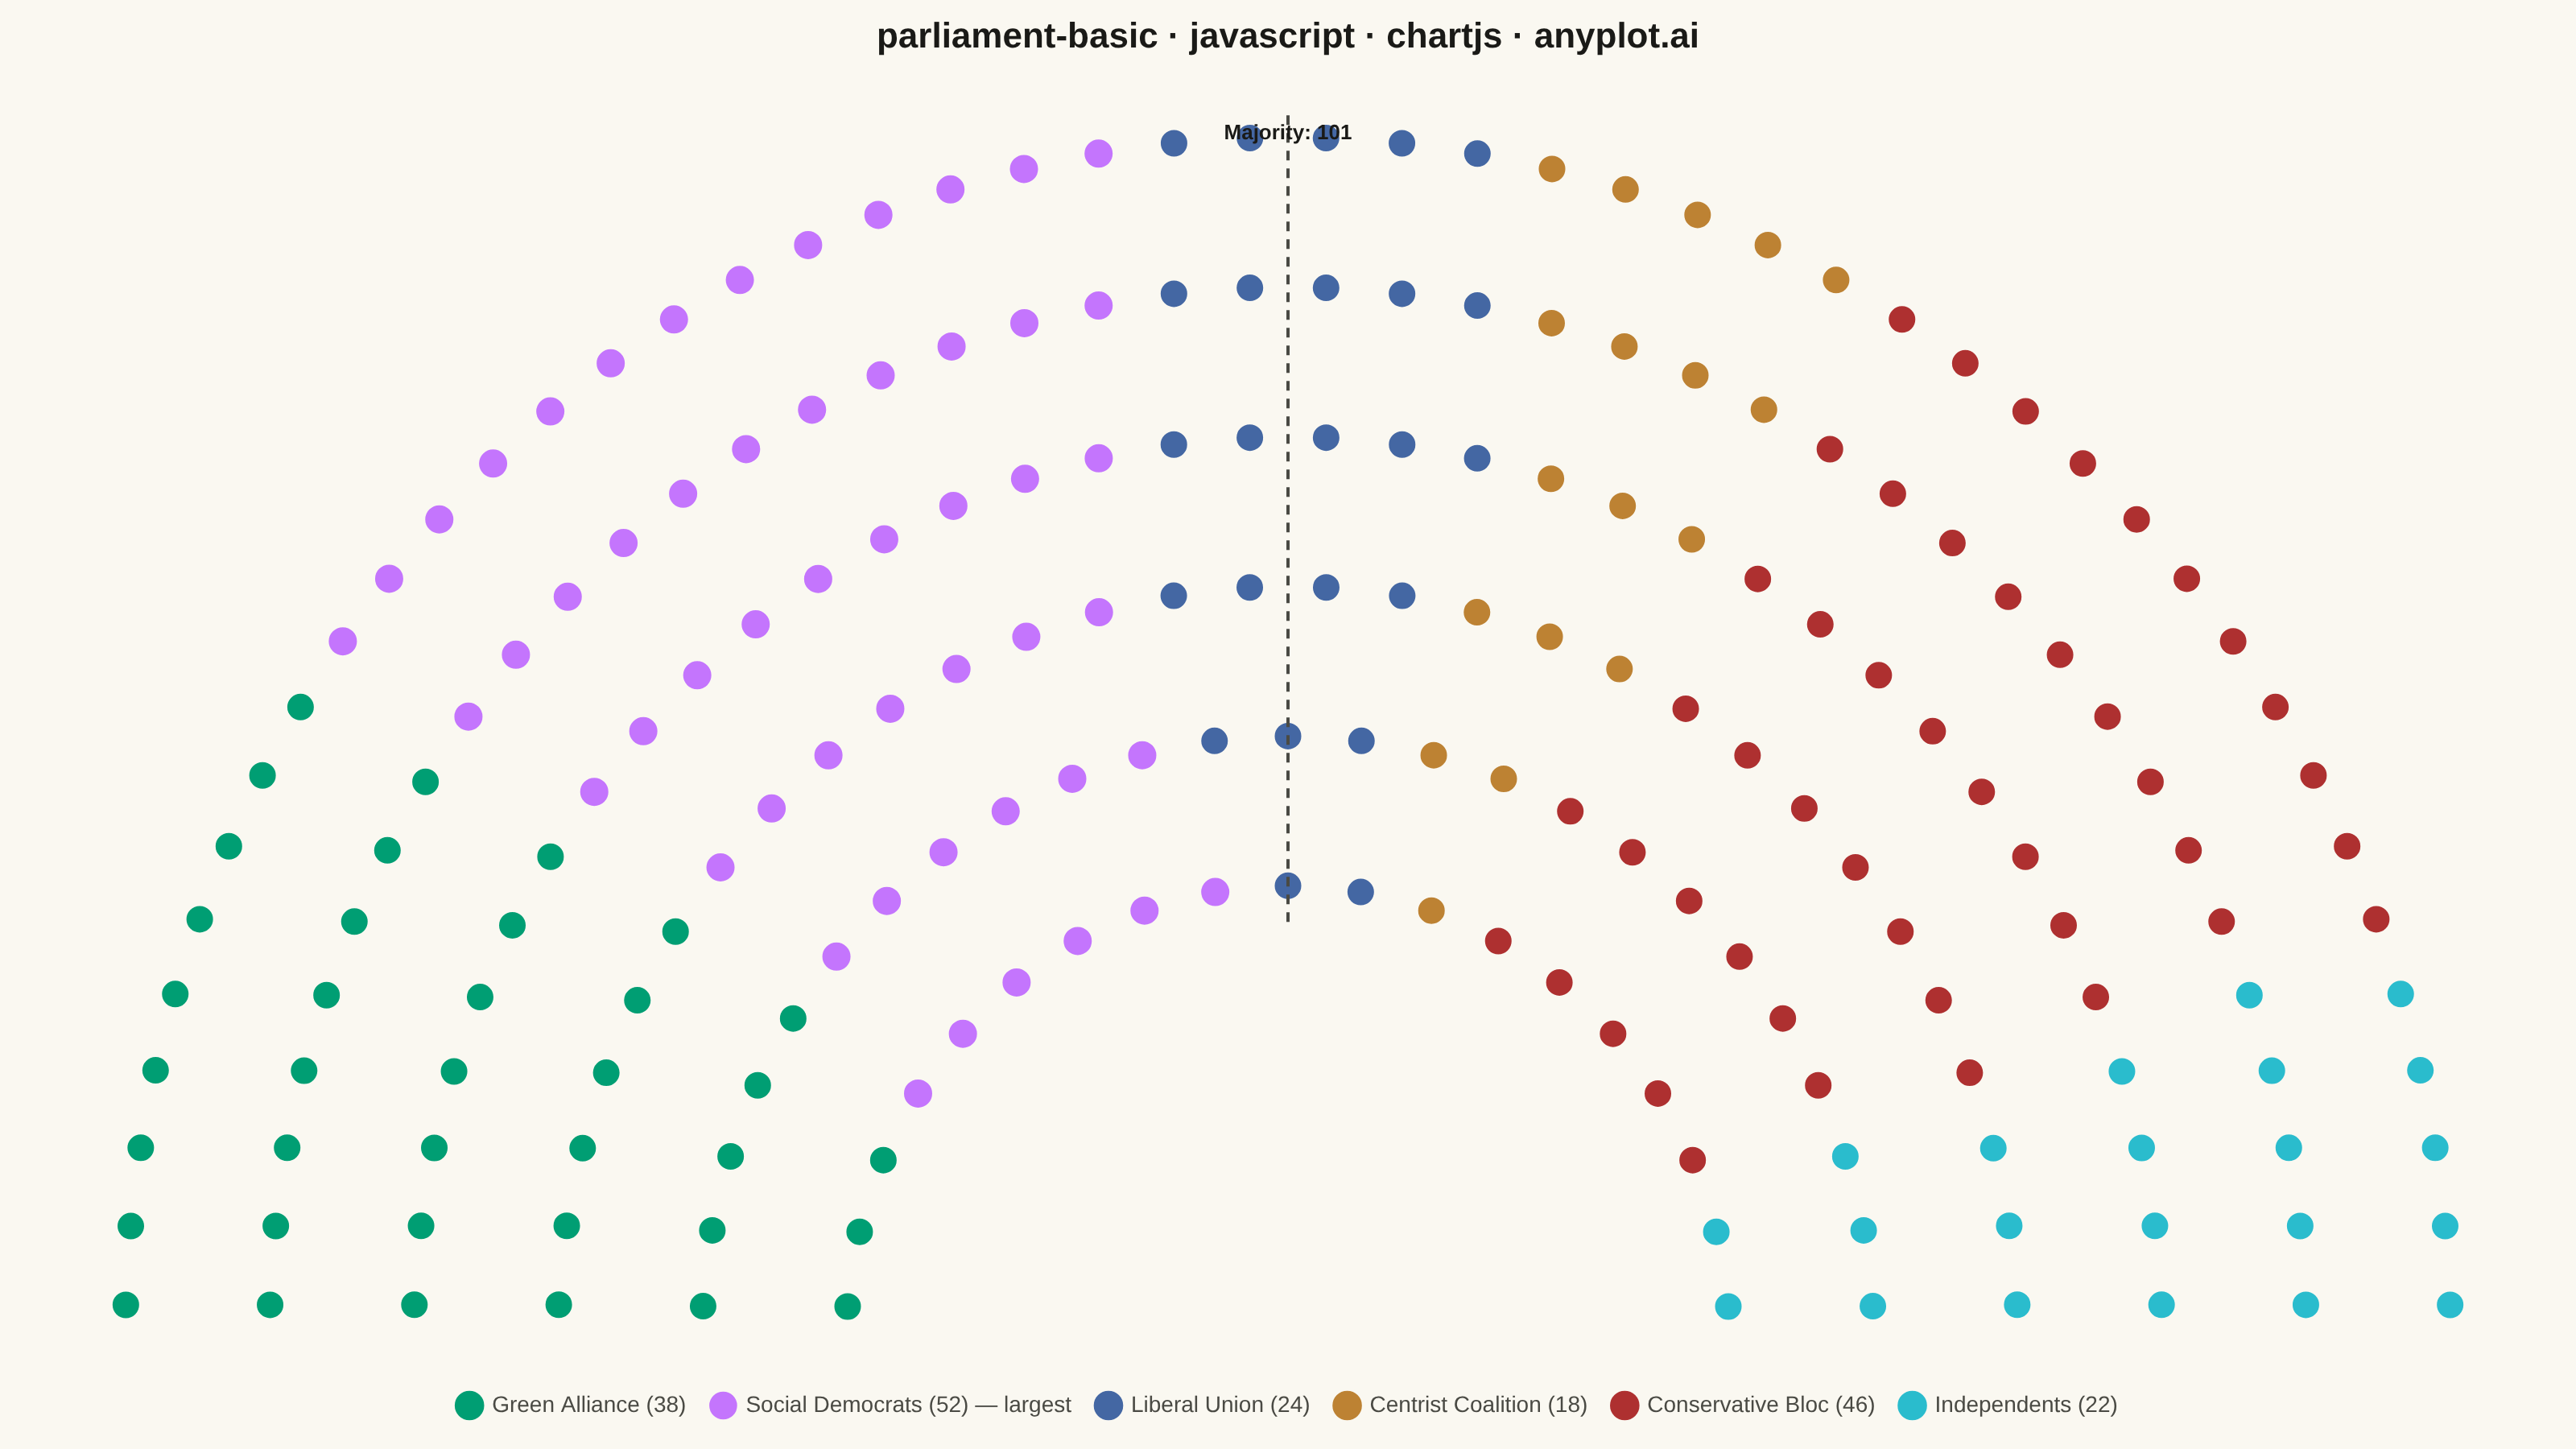
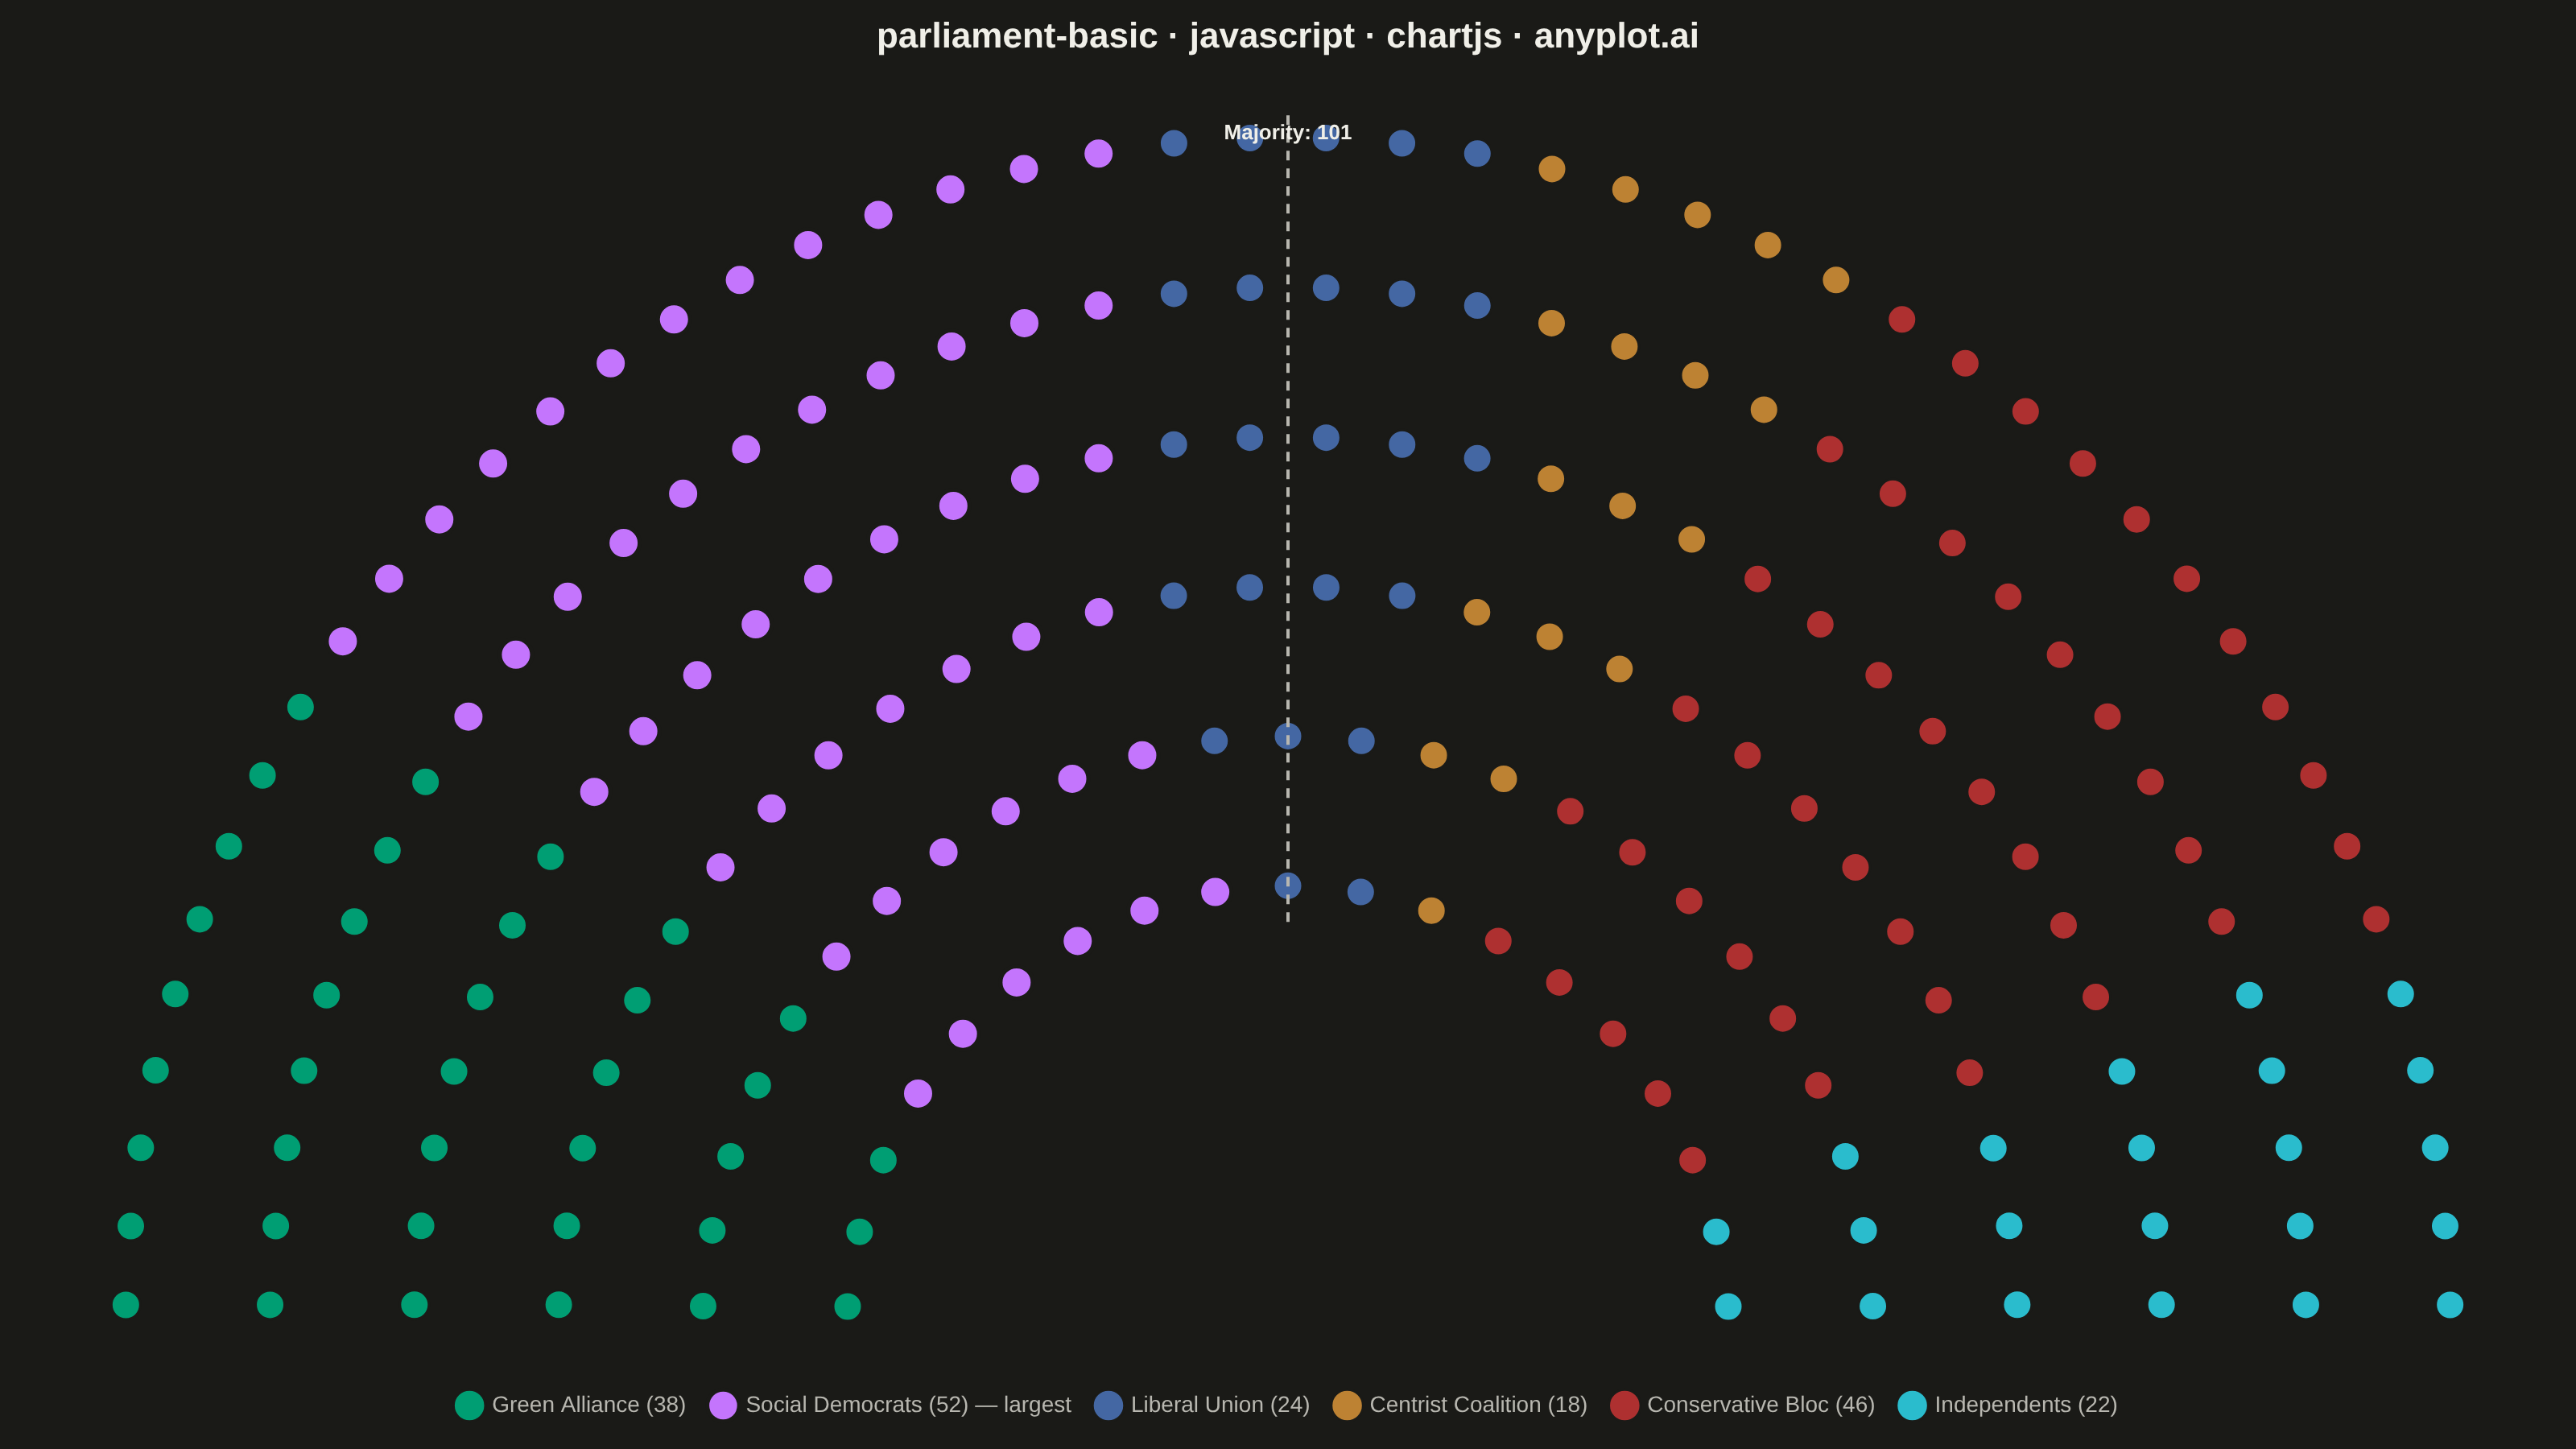
The same plot in 14 other libraries — JavaScript: D3.js, Apache ECharts, Highcharts, MUI X Charts; Python: Altair, Bokeh, lets-plot, Matplotlib, Plotly, plotnine, Pygal, Seaborn; R: ggplot2; Julia: Makie.jl. Compare all 15 side by side: Parliament Seat Chart in Python, R, Julia and JavaScript.
A semicircular parliament seat chart visualizes political party representation by arranging seats in concentric arcs. Each seat is displayed as an individual dot or segment, colored by party affiliation. This visualization is ideal for showing the composition of legislative bodies, election results, and voting bloc distributions at a glance.
// anyplot.ai
// parliament-basic: Parliament Seat Chart
// Library: chartjs 4.4.7 | JavaScript 22.23.2
// Quality: 88/100 | Created: 2026-09-02

const t = window.ANYPLOT_TOKENS;

// --- Data (in-memory, deterministic) ----------------------------------------
// Generic fictional legislature, ordered left-to-right along the political
// spectrum so seat blocks read naturally once laid out below.
const parties = [
  { name: "Green Alliance", seats: 38 },
  { name: "Social Democrats", seats: 52 },
  { name: "Liberal Union", seats: 24 },
  { name: "Centrist Coalition", seats: 18 },
  { name: "Conservative Bloc", seats: 46 },
  { name: "Independents", seats: 22 },
];
const totalSeats = parties.reduce((sum, p) => sum + p.seats, 0);

// --- Semicircular seat layout ------------------------------------------------
// Seats sit on concentric arcs; each arc's seat capacity scales with its
// radius (longer arc = more room), so dot spacing stays roughly even across
// rows. Seats are then globally ordered by angle (left = pi, right = 0) so
// each party forms a contiguous wedge from the outer edge to the center.
const numRows = 6;
const rMin = 0.38;
const rMax = 1.0;
const rowRadii = Array.from({ length: numRows }, (_, i) => rMin + (i * (rMax - rMin)) / (numRows - 1));
const capacitySum = rowRadii.reduce((sum, r) => sum + r, 0);

// Largest-remainder apportionment: floor each row's exact share, then hand the
// leftover seats to the rows with the biggest fractional remainder. This keeps
// per-seat arc spacing far more even across rows than dumping all rounding
// slack into the last row (which visibly starved the innermost arc).
const exactRowSeats = rowRadii.map((radius) => (totalSeats * radius) / capacitySum);
const seatsPerRow = exactRowSeats.map(Math.floor);
let remainder = totalSeats - seatsPerRow.reduce((sum, n) => sum + n, 0);
const byRemainder = exactRowSeats
  .map((exact, i) => ({ i, frac: exact - Math.floor(exact) }))
  .sort((a, b) => b.frac - a.frac);
for (let k = 0; k < remainder; k++) seatsPerRow[byRemainder[k].i] += 1;

const seatPositions = [];
rowRadii.forEach((radius, i) => {
  const rowSeats = seatsPerRow[i];
  for (let j = 0; j < rowSeats; j++) {
    const angle = Math.PI - ((j + 0.5) / rowSeats) * Math.PI;
    seatPositions.push({ x: radius * Math.cos(angle), y: radius * Math.sin(angle), angle });
  }
});
seatPositions.sort((a, b) => b.angle - a.angle);

// --- Data storytelling: majority threshold + plurality emphasis -------------
// The 200-seat chamber needs 101 seats for a majority; that seat falls inside
// whichever party's wedge crosses the 101st position once seats are ordered
// left-to-right (angle descending), which is the same order used below to
// slice seats into party datasets.
const majoritySeatCount = Math.floor(totalSeats / 2) + 1;
const majorityAngle = seatPositions[majoritySeatCount - 1].angle;
const pluralityParty = parties.reduce((max, p) => (p.seats > max.seats ? p : max), parties[0]);

let cursor = 0;
const datasets = parties.map((party, i) => {
  const points = seatPositions.slice(cursor, cursor + party.seats).map(({ x, y }) => ({ x, y }));
  cursor += party.seats;
  const isPlurality = party.name === pluralityParty.name;
  return {
    label: `${party.name} (${party.seats})${isPlurality ? " — largest" : ""}`,
    data: points,
    backgroundColor: t.palette[i % t.palette.length],
    pointBorderColor: t.pageBg,
    pointBorderWidth: isPlurality ? 2.5 : 1.5,
    pointRadius: isPlurality ? 10 : 9,
    pointHoverRadius: isPlurality ? 10 : 9,
  };
});

// A small custom plugin draws a dashed radial line at the majority-threshold
// angle plus its seat count, giving the chart a focal point beyond the raw
// seat scatter (Chart.js has no built-in "reference line" for scatter data).
const majorityLinePlugin = {
  id: "majorityLine",
  afterDatasetsDraw(chart) {
    const { ctx, scales, chartArea } = chart;
    const rInner = rMin - 0.03;
    const rOuter = rMax + 0.06;
    const x1 = scales.x.getPixelForValue(rInner * Math.cos(majorityAngle));
    const y1 = scales.y.getPixelForValue(rInner * Math.sin(majorityAngle));
    const x2 = scales.x.getPixelForValue(rOuter * Math.cos(majorityAngle));
    // Clamp the line tip to the chart area so it (and its label) never pokes
    // above into the title's reserved space, whatever angle the threshold falls at.
    const y2 = Math.max(scales.y.getPixelForValue(rOuter * Math.sin(majorityAngle)), chartArea.top);

    ctx.save();
    ctx.strokeStyle = t.inkSoft;
    ctx.lineWidth = 2;
    ctx.setLineDash([6, 5]);
    ctx.beginPath();
    ctx.moveTo(x1, y1);
    ctx.lineTo(x2, y2);
    ctx.stroke();

    ctx.setLineDash([]);
    ctx.fillStyle = t.ink;
    ctx.font = "600 13px sans-serif";
    ctx.textAlign = majorityAngle > Math.PI / 2 + 0.05 ? "right" : majorityAngle < Math.PI / 2 - 0.05 ? "left" : "center";
    ctx.textBaseline = "top";
    ctx.fillText(`Majority: ${majoritySeatCount}`, x2, y2 + 6);
    ctx.restore();
  },
};

// --- Mount -------------------------------------------------------------------
const canvas = document.createElement("canvas");
document.getElementById("container").appendChild(canvas);

// --- Chart ---------------------------------------------------------------
new Chart(canvas, {
  type: "scatter",
  data: { datasets },
  plugins: [majorityLinePlugin],
  options: {
    responsive: true,
    maintainAspectRatio: false,
    animation: false,
    layout: { padding: { top: 10, bottom: 10, left: 20, right: 20 } },
    plugins: {
      title: {
        display: true,
        text: "parliament-basic · javascript · chartjs · anyplot.ai",
        color: t.ink,
        font: { size: 22 },
        padding: { bottom: 34 },
      },
      legend: {
        position: "bottom",
        labels: {
          color: t.inkSoft,
          font: { size: 14 },
          usePointStyle: true,
          pointStyle: "circle",
          padding: 16,
        },
      },
      tooltip: {
        callbacks: {
          title: () => "",
          label: (ctx) => ctx.dataset.label,
        },
      },
    },
    scales: {
      x: { display: false, min: -1.08, max: 1.08 },
      y: { display: false, min: -0.02, max: 1.02 },
    },
  },
});
Runnable source as JSON, for any HTTP client: https://api.anyplot.ai/specs/parliament-basic/chartjs/code. Any spec id and library id listed in llms-full.txt fit the same URL shape; every URL below is complete and callable.
{
  "spec_id": "parliament-basic",
  "language": "javascript",
  "library": "chartjs",
  "page": "https://anyplot.ai/parliament-basic/javascript/chartjs",
  "hub": "https://anyplot.ai/parliament-basic",
  "code_json": "https://api.anyplot.ai/specs/parliament-basic/chartjs/code",
  "spec_json": "https://api.anyplot.ai/specs/parliament-basic",
  "render_light_png": "https://storage.googleapis.com/anyplot-images/plots/parliament-basic/javascript/chartjs/plot-light.png",
  "render_dark_png": "https://storage.googleapis.com/anyplot-images/plots/parliament-basic/javascript/chartjs/plot-dark.png",
  "interactive_light_html": "https://storage.googleapis.com/anyplot-images/plots/parliament-basic/javascript/chartjs/plot-light.html",
  "interactive_dark_html": "https://storage.googleapis.com/anyplot-images/plots/parliament-basic/javascript/chartjs/plot-dark.html",
  "quality_score": 88.0,
  "license": "MIT",
  "guide": "https://anyplot.ai/llms.txt"
}
Part of Parliament Seat Chart on anyplot.ai.