The same plot in 14 other libraries — JavaScript: Chart.js, Apache ECharts, Highcharts, MUI X Charts; Python: Altair, Bokeh, lets-plot, Matplotlib, Plotly, plotnine, Pygal, Seaborn; R: ggplot2; Julia: Makie.jl. Compare all 15 side by side: Parliament Seat Chart in Python, R, Julia and JavaScript.
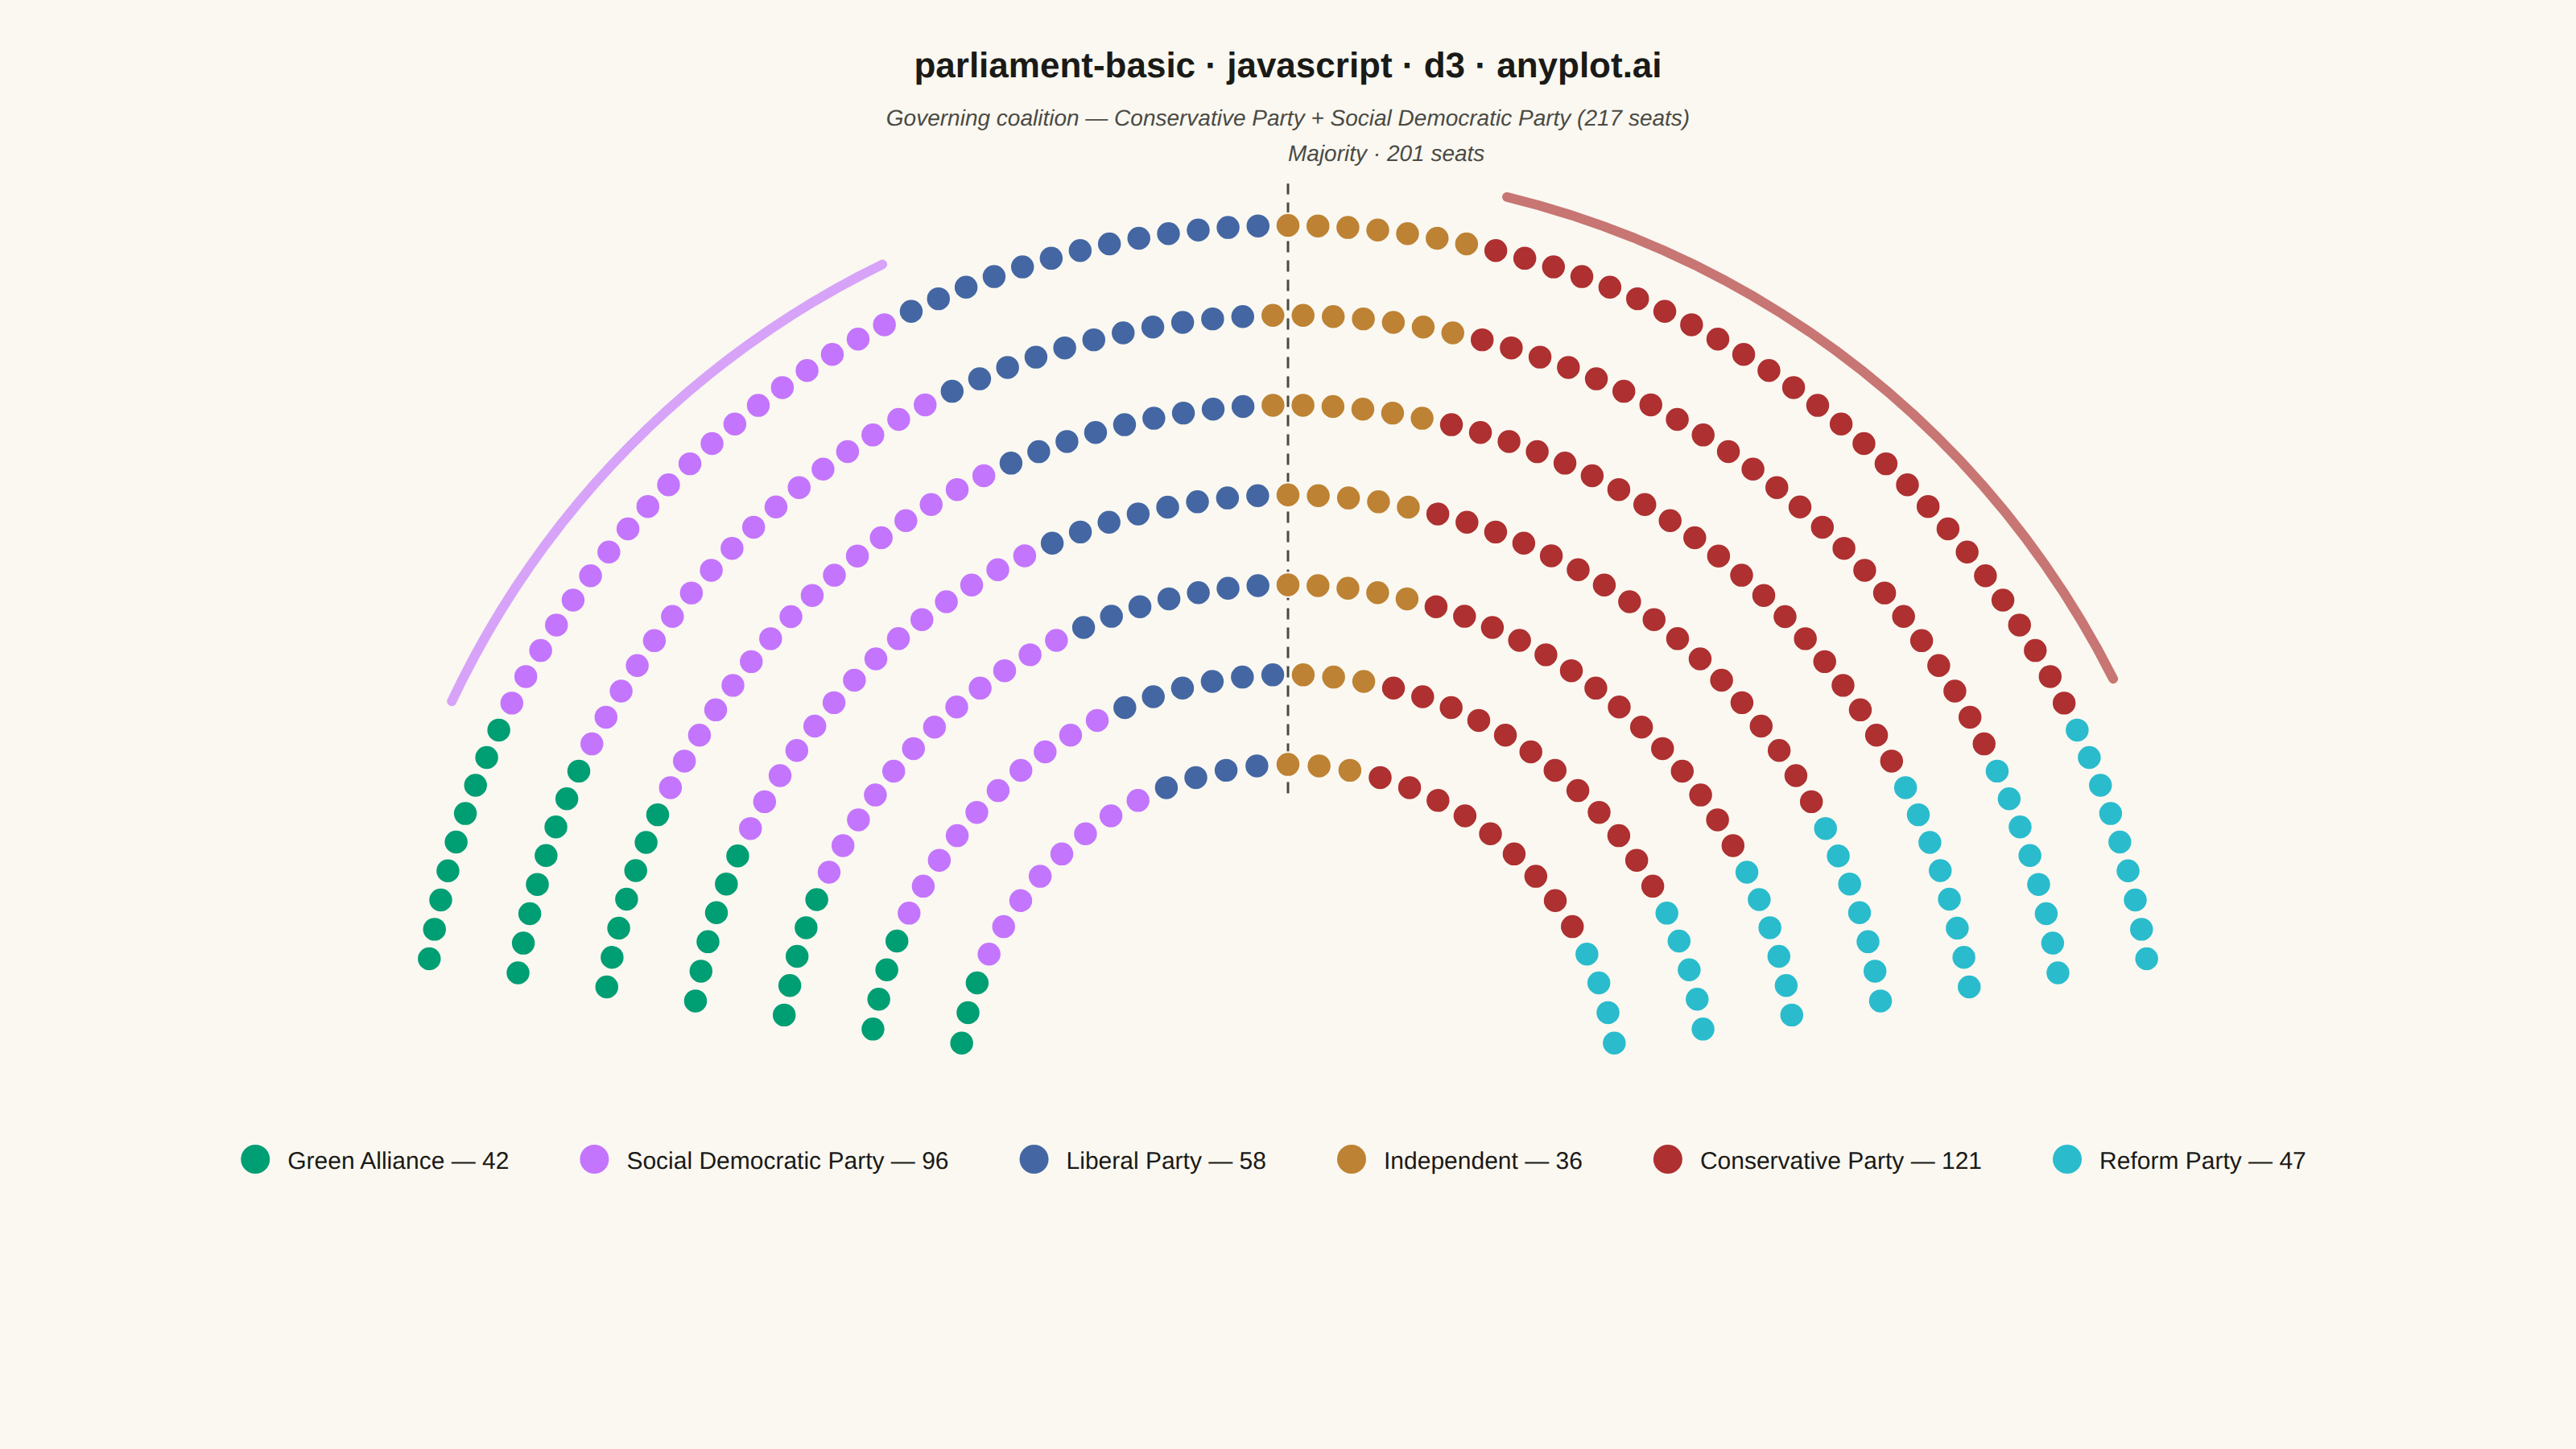
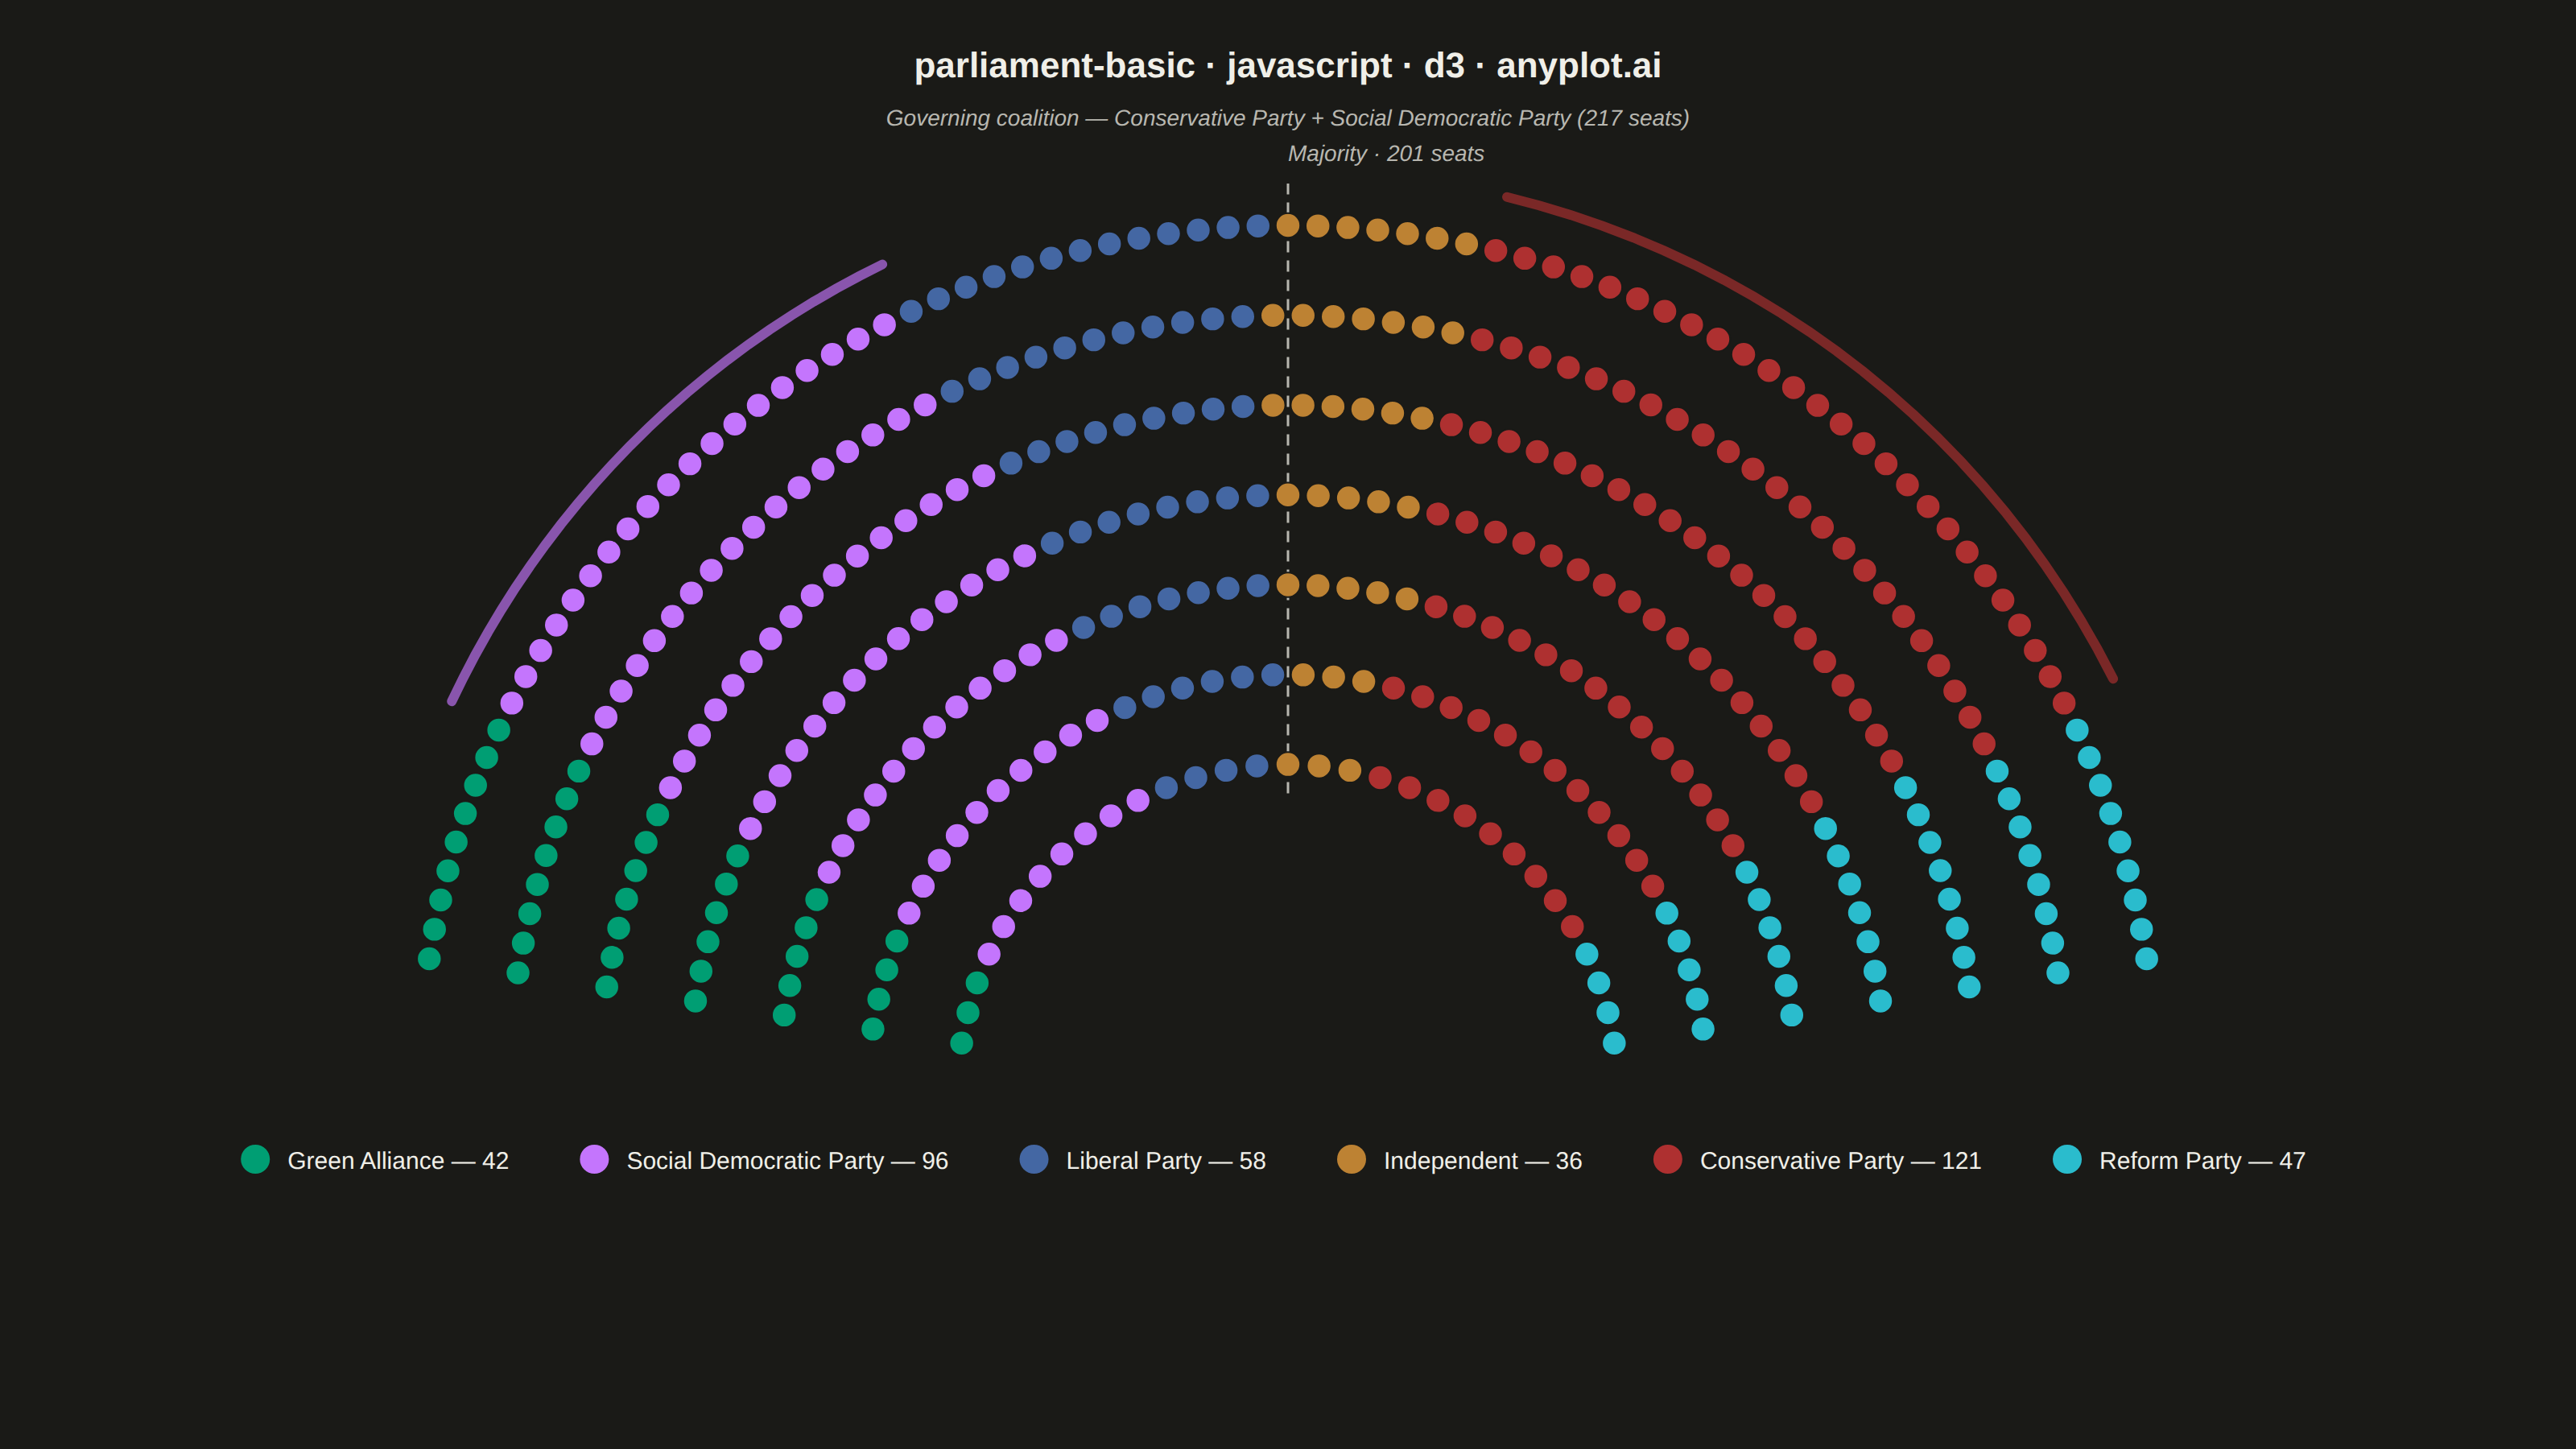
A semicircular parliament seat chart visualizes political party representation by arranging seats in concentric arcs. Each seat is displayed as an individual dot or segment, colored by party affiliation. This visualization is ideal for showing the composition of legislative bodies, election results, and voting bloc distributions at a glance.
// anyplot.ai
// parliament-basic: Parliament Seat Chart
// Library: d3 7.9.0 | JavaScript 22.23.2
// Quality: 91/100 | Created: 2026-09-02

const t = window.ANYPLOT_TOKENS;
const { width, height } = window.ANYPLOT_SIZE;

// --- Data: fictional legislature, ordered left-to-right along the political
// spectrum. Independent sits centrist (between Liberal and Conservative)
// rather than at a spectrum edge, since it is unaligned rather than extreme.
// Colors come from a categorical scale, keyed by name, so the first party
// (leftmost, "Green Alliance") lands on Imprint position 1 (#009E73). ------
const parties = [
  { name: "Green Alliance", seats: 42 },
  { name: "Social Democratic Party", seats: 96 },
  { name: "Liberal Party", seats: 58 },
  { name: "Independent", seats: 36 },
  { name: "Conservative Party", seats: 121 },
  { name: "Reform Party", seats: 47 },
];
const color = d3.scaleOrdinal().domain(parties.map((p) => p.name)).range(t.palette);
parties.forEach((p) => (p.color = color(p.name)));
const totalSeats = d3.sum(parties, (d) => d.seats);
const majority = Math.floor(totalSeats / 2) + 1;

// --- Layout geometry ---------------------------------------------------------
const margin = { top: 100, bottom: 220, left: 70, right: 70 };
const plotW = width - margin.left - margin.right;
const plotH = height - margin.top - margin.bottom;
const cx = width / 2;
const cy = margin.top + plotH; // flat baseline of the semicircle

const rMax = Math.min(plotW / 2, plotH) - 40;
const rMin = rMax * 0.38;

// Concentric arcs: pick a row count that keeps seats/row in a legible range,
// then space rows evenly in radius between rMin and rMax.
const numRows = Math.max(4, Math.min(9, Math.round(Math.sqrt(totalSeats / 9))));
const radii = d3.range(numRows).map((k) =>
  numRows === 1 ? rMax : rMin + (k * (rMax - rMin)) / (numRows - 1)
);

// Seats per row proportional to row circumference (~radius), largest-remainder
// rounding so the row totals sum exactly to totalSeats.
const rawCounts = radii.map((r) => (r / d3.sum(radii)) * totalSeats);
const rowCounts = rawCounts.map(Math.floor);
let leftover = totalSeats - d3.sum(rowCounts);
const remainderOrder = d3.range(numRows)
  .sort((a, b) => (rawCounts[b] - rowCounts[b]) - (rawCounts[a] - rowCounts[a]));
for (let k = 0; k < leftover; k++) rowCounts[remainderOrder[k]] += 1;

// Seat radius bounded by the tightest row (arc length / seat count) so dots
// never overlap along any row.
const anglePad = 0.05 * Math.PI;
const seatRadius = Math.min(
  16,
  Math.max(
    4,
    d3.min(
      radii
        .map((r, k) => (rowCounts[k] > 0 ? (r * (Math.PI - 2 * anglePad)) / rowCounts[k] / 2.4 : Infinity))
    )
  )
);

// --- Seat slots: one per row, angle sweeping left (pi) to right (0) --------
const slots = [];
radii.forEach((r, k) => {
  const n = rowCounts[k];
  for (let j = 0; j < n; j++) {
    const angle = n > 1
      ? Math.PI - anglePad - (j * (Math.PI - 2 * anglePad)) / (n - 1)
      : Math.PI / 2;
    slots.push({ radius: r, angle });
  }
});
slots.sort((a, b) => b.angle - a.angle); // leftmost (largest angle) first

// Assign each slot to a party by cumulative seat count, preserving the
// left-to-right party order so each party forms a contiguous angular wedge.
let cursor = 0;
const seatData = [];
for (const party of parties) {
  for (let i = 0; i < party.seats; i++) {
    const slot = slots[cursor++];
    seatData.push({ ...slot, color: party.color, party: party.name });
  }
}

// Majority threshold sits at the boundary between seat (majority-1) and seat majority
const thetaMaj = majority >= 2
  ? (slots[majority - 1].angle + slots[majority - 2].angle) / 2
  : slots[0].angle;

// --- SVG mount ----------------------------------------------------------------
const svg = d3.select("#container").append("svg").attr("width", width).attr("height", height);
const seatX = (r, a) => cx + r * Math.cos(a);
const seatY = (r, a) => cy - r * Math.sin(a);

// --- Majority threshold line (drawn first, under the seats) -----------------
svg.append("line")
  .attr("x1", seatX(rMin - 18, thetaMaj)).attr("y1", seatY(rMin - 18, thetaMaj))
  .attr("x2", seatX(rMax + 26, thetaMaj)).attr("y2", seatY(rMax + 26, thetaMaj))
  .attr("stroke", t.inkSoft).attr("stroke-width", 1.5).attr("stroke-dasharray", "7,5");
svg.append("text")
  .attr("x", seatX(rMax + 40, thetaMaj)).attr("y", seatY(rMax + 40, thetaMaj))
  .attr("text-anchor", Math.cos(thetaMaj) < 0 ? "end" : "start")
  .attr("fill", t.inkSoft).style("font-size", "14px").style("font-style", "italic")
  .text(`Majority · ${majority} seats`);

// --- Seats --------------------------------------------------------------------
svg.selectAll("circle.seat").data(seatData).join("circle")
  .attr("class", "seat")
  .attr("cx", (d) => seatX(d.radius, d.angle))
  .attr("cy", (d) => seatY(d.radius, d.angle))
  .attr("r", seatRadius)
  .attr("fill", (d) => d.color)
  .attr("stroke", t.pageBg)
  .attr("stroke-width", 1);

// --- Governing coalition: the fewest, largest parties whose seats combined
// cross the majority line — a concrete answer to "which coalition governs?"
// rather than stopping at the threshold line alone. -------------------------
const bySeatsDesc = [...parties].sort((a, b) => b.seats - a.seats);
const coalition = [];
let coalitionSeats = 0;
for (const p of bySeatsDesc) {
  if (coalitionSeats >= majority) break;
  coalition.push(p);
  coalitionSeats += p.seats;
}

const partyExtent = new Map(
  parties.map((p) => {
    const angles = seatData.filter((d) => d.party === p.name).map((d) => d.angle);
    return [p.name, [d3.min(angles), d3.max(angles)]];
  })
);
const bandR = rMax + 34;
const bandLine = d3.line();
const bandPoints = (aStart, aEnd, steps = 24) =>
  d3.range(steps + 1).map((i) => {
    const a = aStart + ((aEnd - aStart) * i) / steps;
    return [seatX(bandR, a), seatY(bandR, a)];
  });

coalition.forEach((p) => {
  const [aMin, aMax] = partyExtent.get(p.name);
  svg.append("path")
    .attr("d", bandLine(bandPoints(aMin, aMax)))
    .attr("fill", "none")
    .attr("stroke", p.color)
    .attr("stroke-width", 6)
    .attr("stroke-linecap", "round")
    .attr("opacity", 0.65);
});
svg.append("text")
  .attr("x", width / 2).attr("y", margin.top - 22)
  .attr("text-anchor", "middle")
  .attr("fill", t.inkSoft).style("font-size", "14px").style("font-style", "italic")
  .text(`Governing coalition — ${coalition.map((p) => p.name).join(" + ")} (${coalitionSeats} seats)`);

// --- Legend: swatch + name + seat count, wrapped into rows and centered ------
const legendG = svg.append("g");
const itemGs = legendG.selectAll("g.item").data(parties).join("g").attr("class", "item");
itemGs.each(function (d) {
  const g = d3.select(this);
  g.append("circle").attr("r", 9).attr("cy", -4).attr("fill", d.color);
  g.append("text").attr("x", 20).attr("y", 2)
    .attr("fill", t.ink).style("font-size", "15px")
    .text(`${d.name} — ${d.seats}`);
});

const gap = 44;
const itemWidths = itemGs.nodes().map((n) => n.getBBox().width);
const rows = [];
let current = [];
let currentWidth = 0;
parties.forEach((d, i) => {
  const w = itemWidths[i];
  const addW = current.length === 0 ? w : w + gap;
  if (currentWidth + addW > plotW && current.length > 0) {
    rows.push(current);
    current = [{ i, w }];
    currentWidth = w;
  } else {
    current.push({ i, w });
    currentWidth += addW;
  }
});
if (current.length) rows.push(current);

const legendTop = cy + 44;
const rowHeight = 36;
const itemNodes = itemGs.nodes();
rows.forEach((row, ri) => {
  const totalW = d3.sum(row, (item) => item.w) + gap * (row.length - 1);
  let x = cx - totalW / 2;
  row.forEach((item) => {
    d3.select(itemNodes[item.i]).attr("transform", `translate(${x},${legendTop + ri * rowHeight})`);
    x += item.w + gap;
  });
});

// --- Title ----------------------------------------------------------------
svg.append("text")
  .attr("x", width / 2).attr("y", 48)
  .attr("text-anchor", "middle")
  .attr("fill", t.ink).style("font-size", "22px").style("font-weight", "600")
  .text("parliament-basic · javascript · d3 · anyplot.ai");
Runnable source as JSON, for any HTTP client: https://api.anyplot.ai/specs/parliament-basic/d3/code. Any spec id and library id listed in llms-full.txt fit the same URL shape; every URL below is complete and callable.
{
  "spec_id": "parliament-basic",
  "language": "javascript",
  "library": "d3",
  "page": "https://anyplot.ai/parliament-basic/javascript/d3",
  "hub": "https://anyplot.ai/parliament-basic",
  "code_json": "https://api.anyplot.ai/specs/parliament-basic/d3/code",
  "spec_json": "https://api.anyplot.ai/specs/parliament-basic",
  "render_light_png": "https://storage.googleapis.com/anyplot-images/plots/parliament-basic/javascript/d3/plot-light.png",
  "render_dark_png": "https://storage.googleapis.com/anyplot-images/plots/parliament-basic/javascript/d3/plot-dark.png",
  "interactive_light_html": "https://storage.googleapis.com/anyplot-images/plots/parliament-basic/javascript/d3/plot-light.html",
  "interactive_dark_html": "https://storage.googleapis.com/anyplot-images/plots/parliament-basic/javascript/d3/plot-dark.html",
  "quality_score": 91.0,
  "license": "MIT",
  "guide": "https://anyplot.ai/llms.txt"
}
Part of Parliament Seat Chart on anyplot.ai.