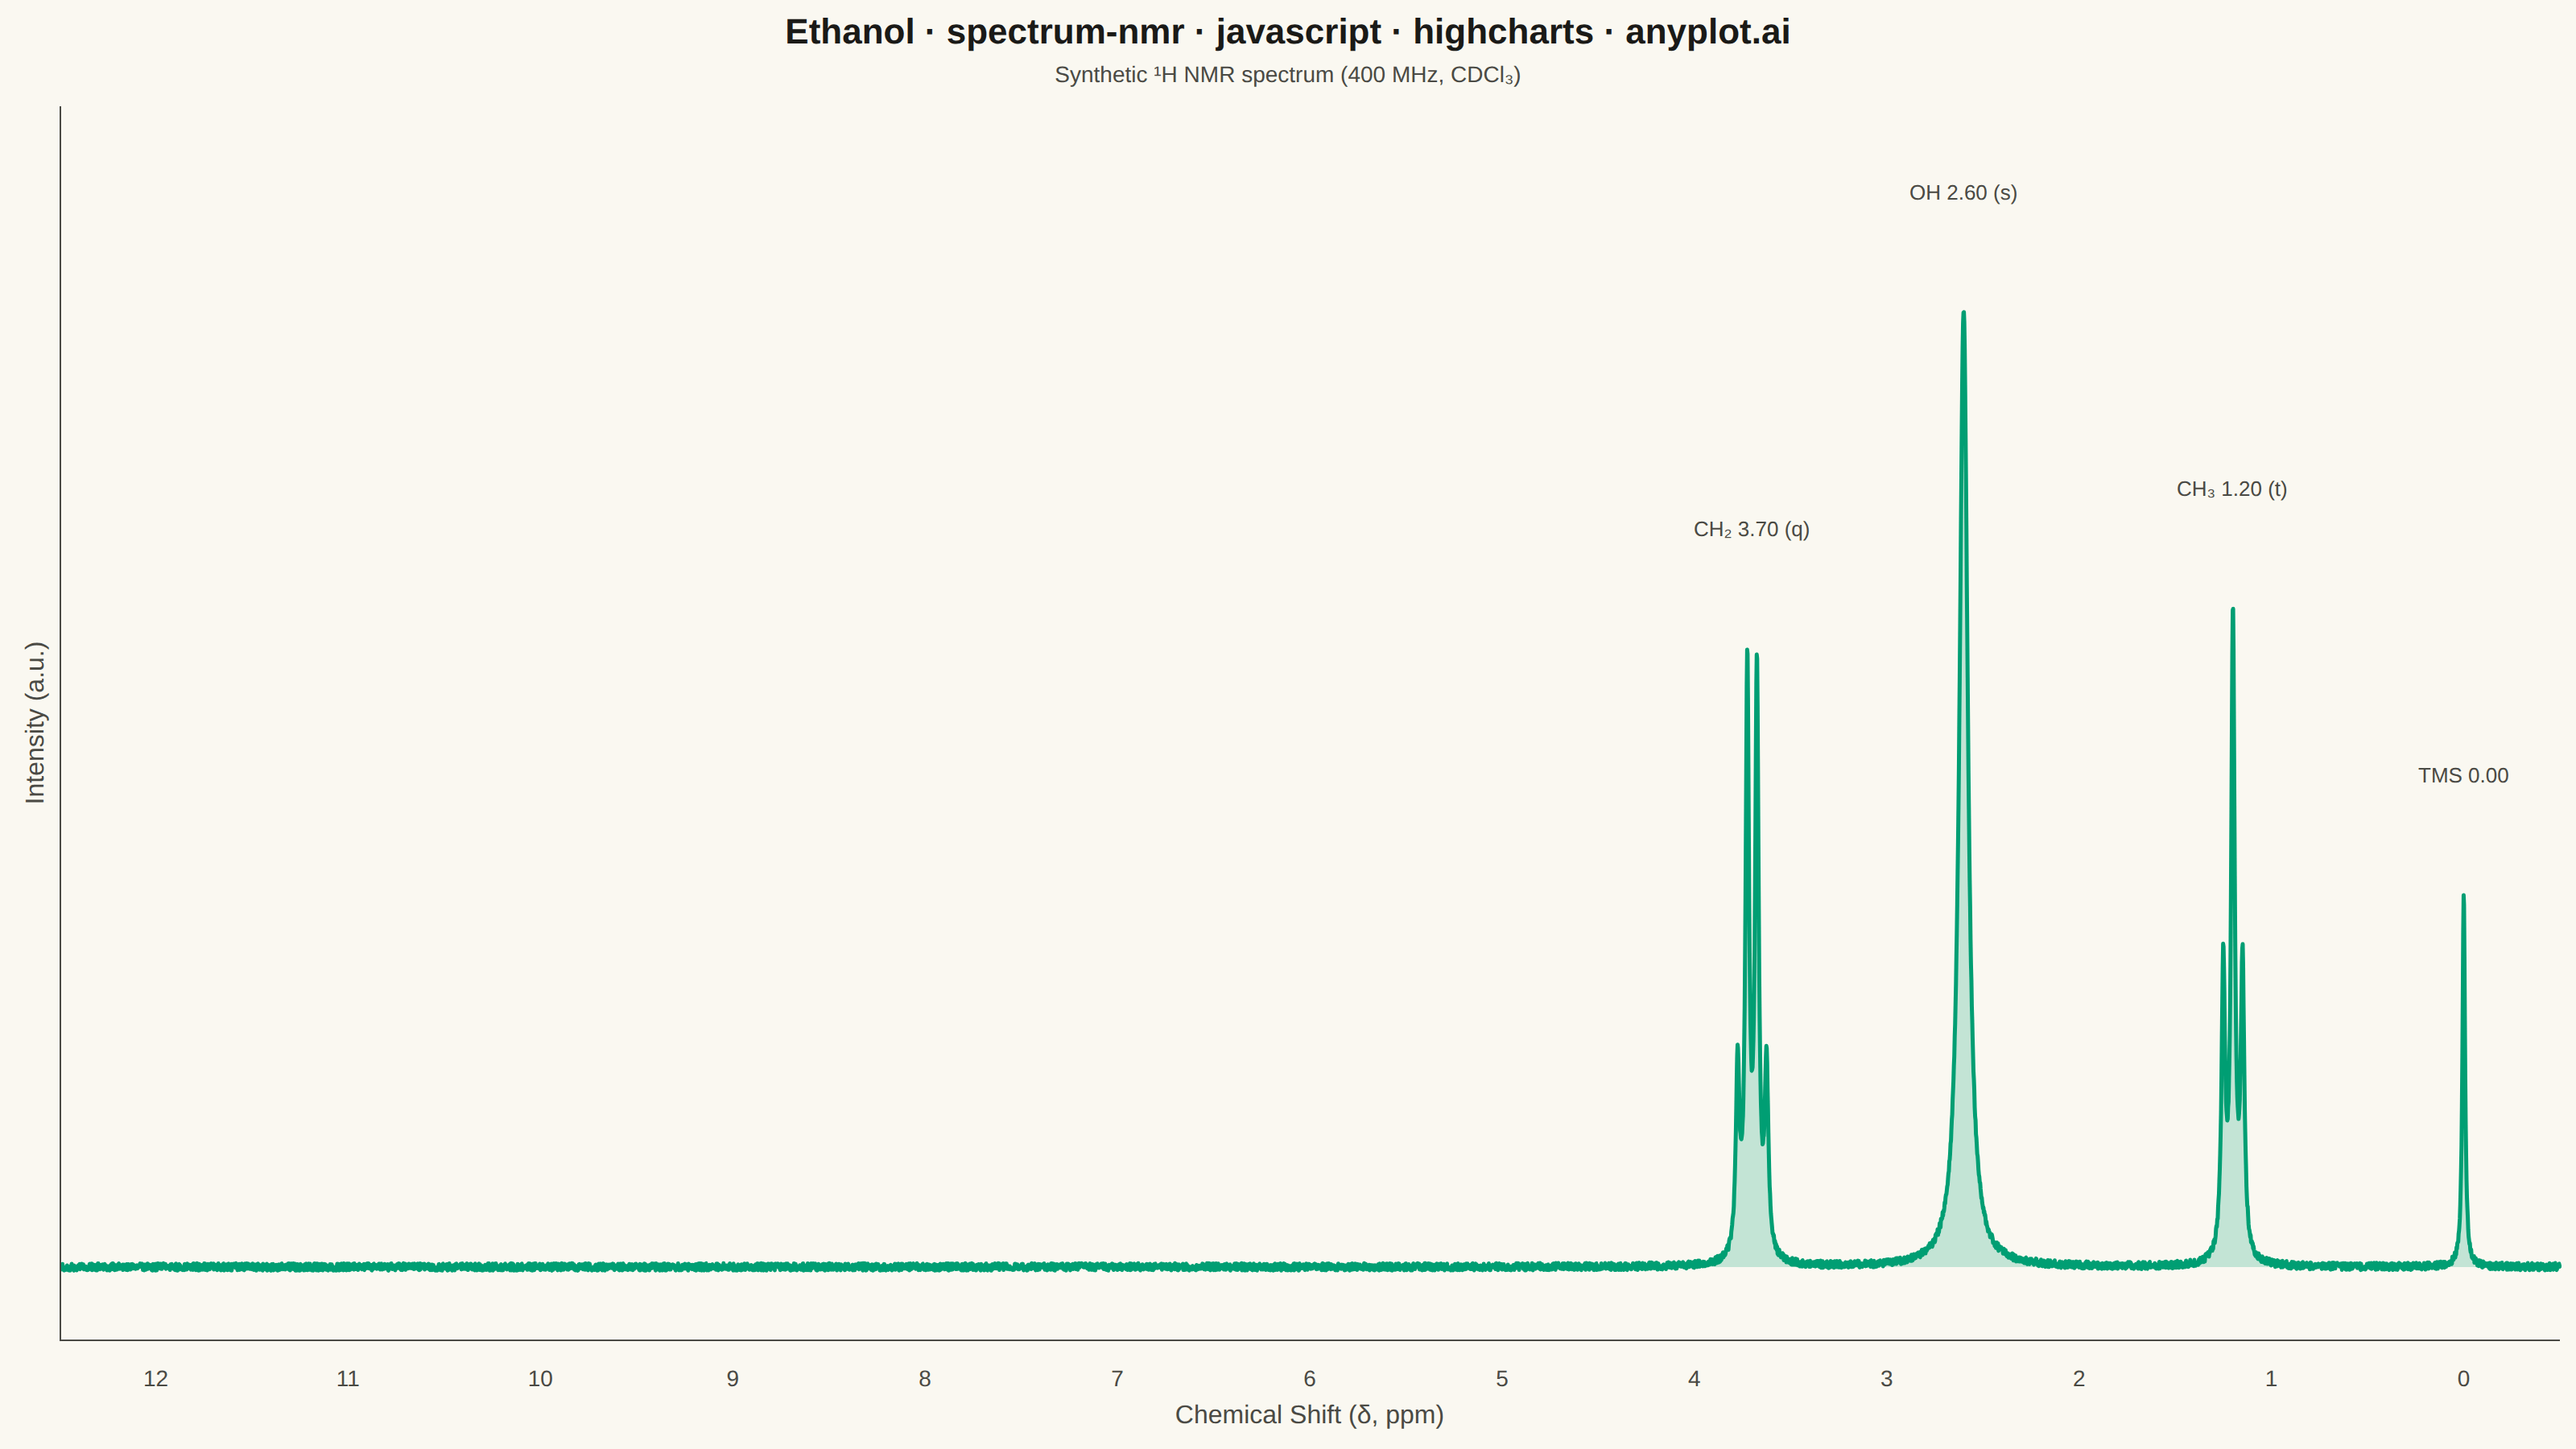
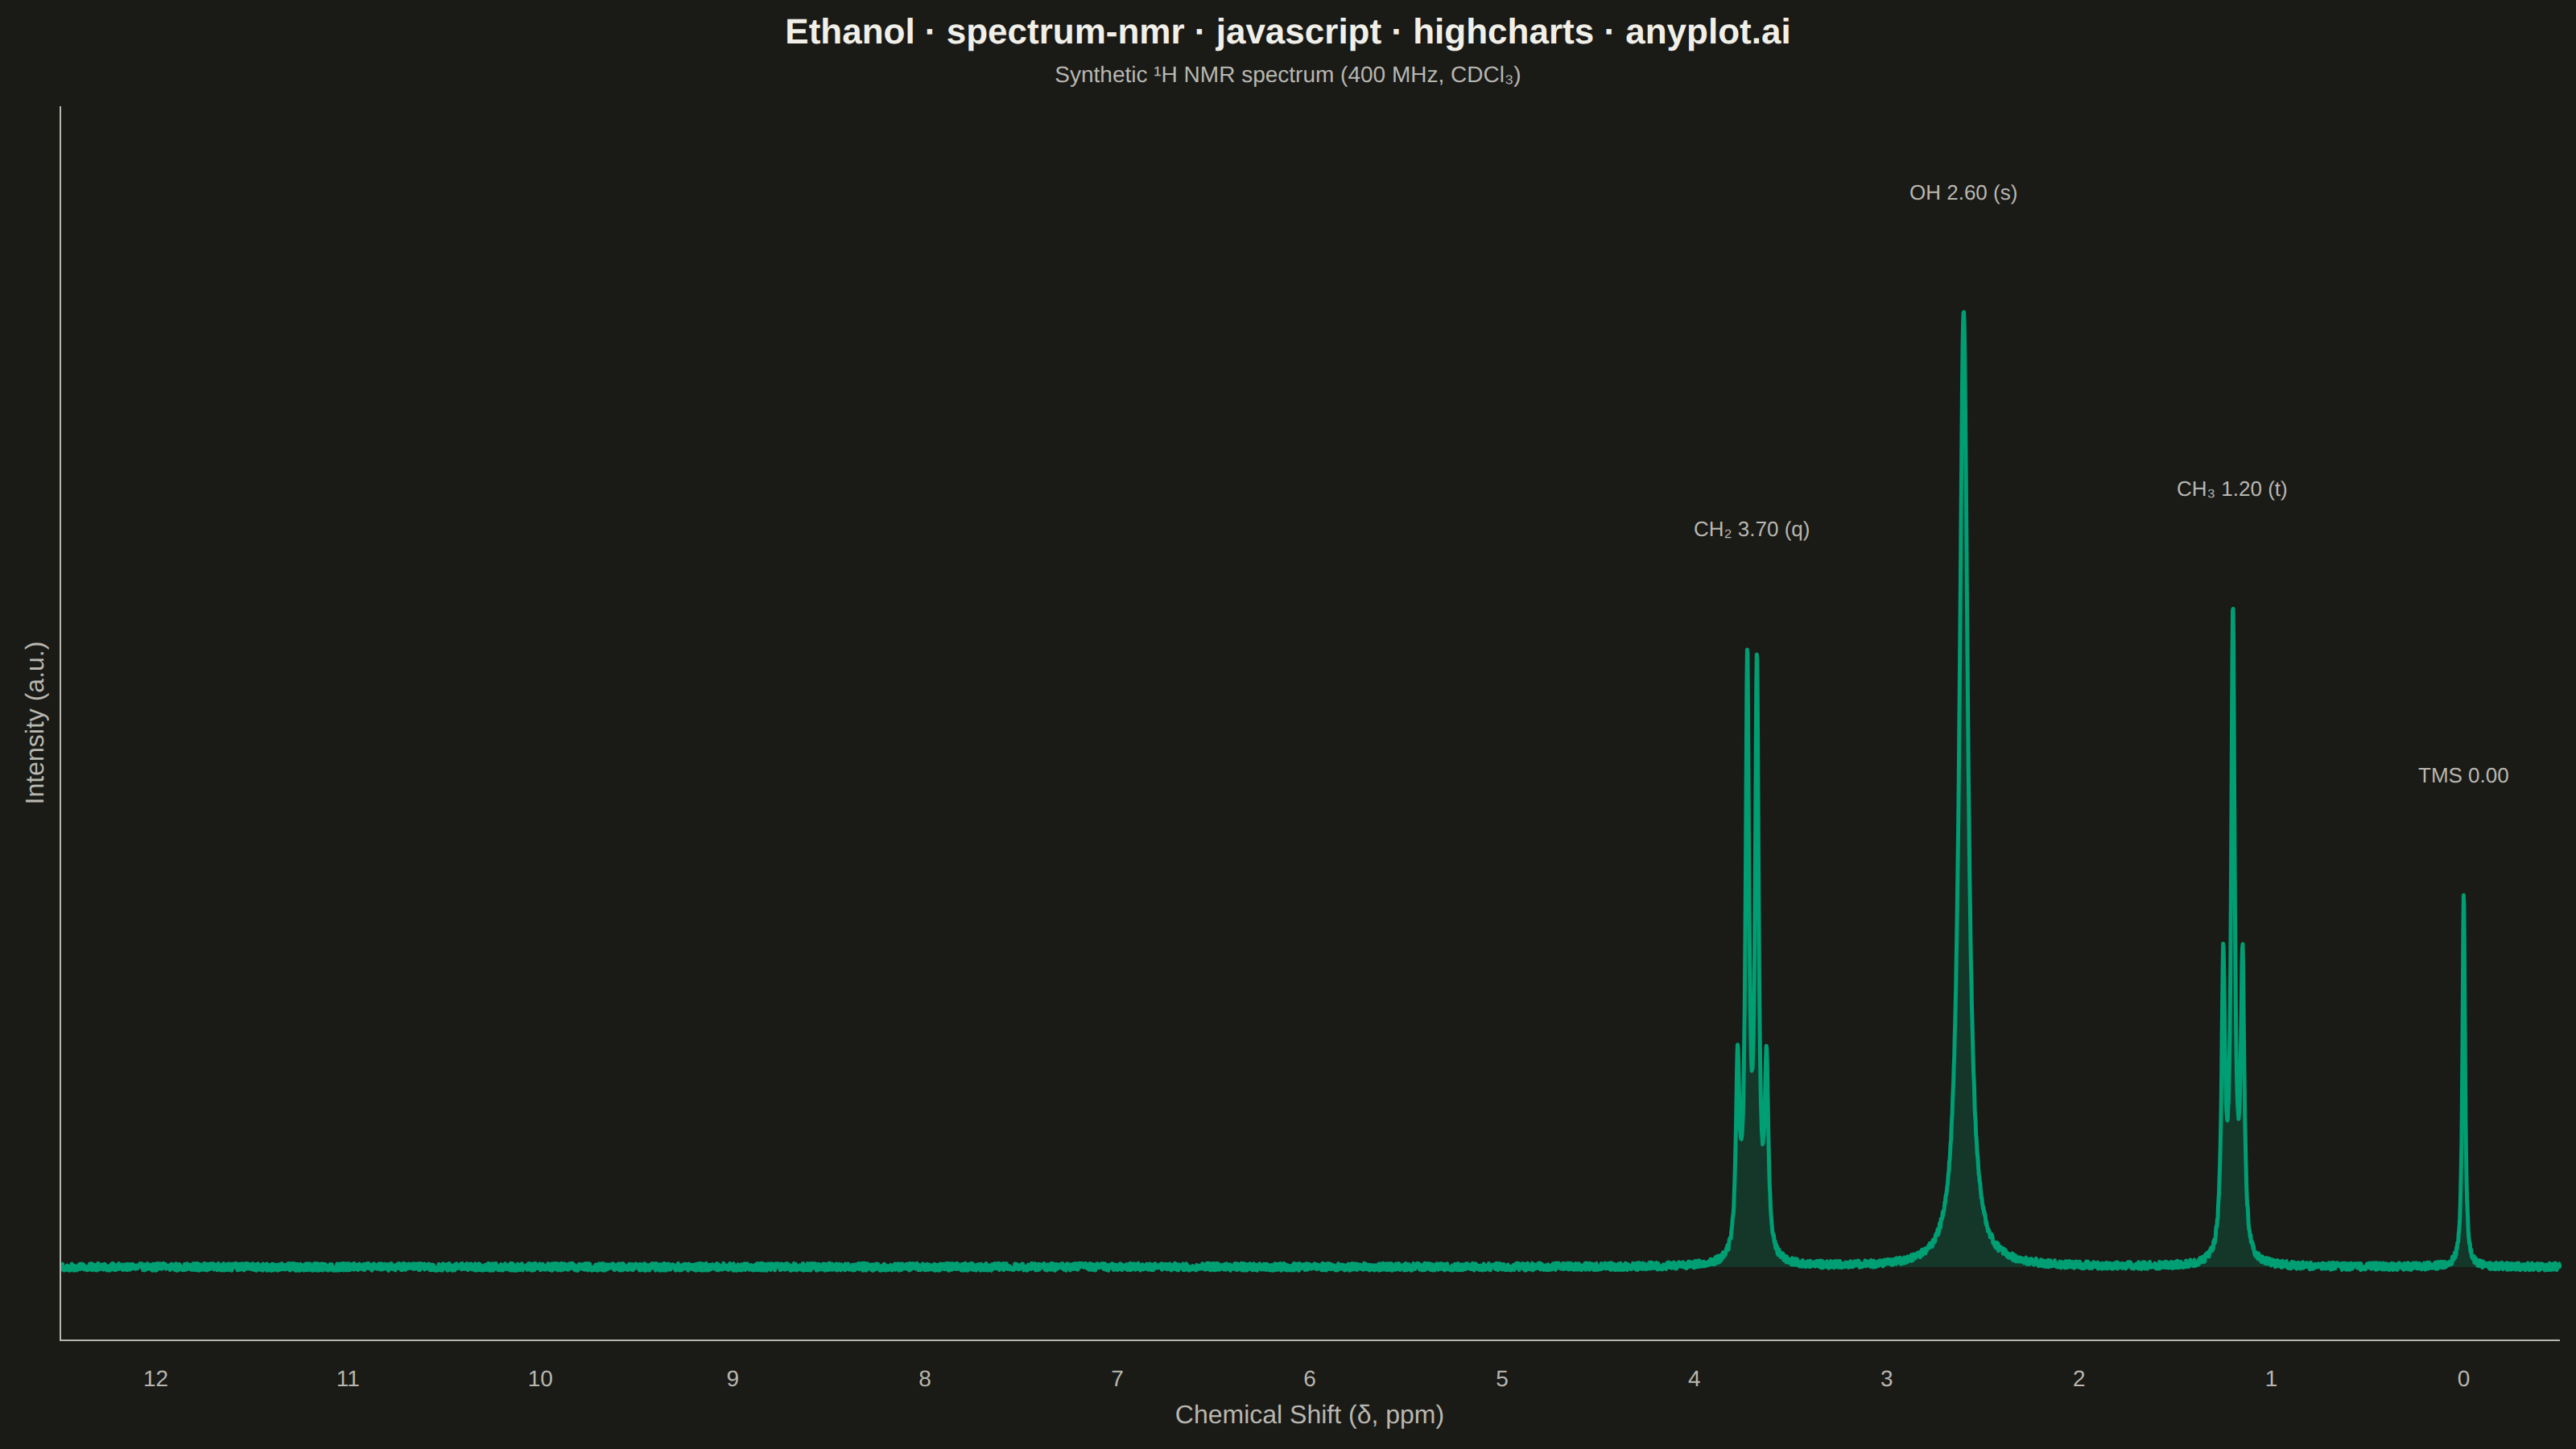
The same plot in 14 other libraries — JavaScript: Chart.js, D3.js, Apache ECharts, MUI X Charts; Python: Altair, Bokeh, lets-plot, Matplotlib, Plotly, plotnine, Pygal, Seaborn; R: ggplot2; Julia: Makie.jl. Compare all 15 side by side: NMR Spectrum (Nuclear Magnetic Resonance) in Python, R, Julia and JavaScript.
An NMR spectrum plots signal intensity versus chemical shift (in ppm) to reveal the electronic environment of atomic nuclei in a molecule. It is the primary analytical tool in organic chemistry for determining molecular structure, with peak positions indicating functional groups and splitting patterns (multiplets) revealing connectivity between neighboring atoms. The x-axis is conventionally reversed (high ppm on the left) and peaks appear as sharp signals rising from a baseline.
// anyplot.ai
// spectrum-nmr: NMR Spectrum (Nuclear Magnetic Resonance)
// Library: highcharts 12.6.0 | JavaScript 22.23.2
// Quality: 90/100 | Created: 2026-08-24
//# anyplot-orientation: landscape
// anyplot.ai
// spectrum-nmr: NMR Spectrum (Nuclear Magnetic Resonance)
// Library: Highcharts 12.6.0 | Node 22
// License: Highcharts — commercial license, free for non-commercial use (highcharts.com/license)
// Quality: pending | Created: 2026-08-24

const t = window.ANYPLOT_TOKENS;

// --- Data (in-memory, deterministic) ---------------------------------------
// Synthetic 1H NMR spectrum of ethanol (CH3-CH2-OH). Each signal is a
// Lorentzian line shape; multiplets sum split component lines following the
// n+1 rule (triplet 1:2:1 for CH3, quartet 1:3:3:1 for CH2).
function lorentzian(shift, center, height, halfWidth) {
  return (height * halfWidth * halfWidth) / ((shift - center) * (shift - center) + halfWidth * halfWidth);
}

// Tiny fixed-seed LCG for a touch of baseline noise (no seeded RNG in the browser)
let noiseSeed = 42;
function nextNoise() {
  noiseSeed = (noiseSeed * 1103515245 + 12345) & 0x7fffffff;
  return noiseSeed / 0x7fffffff - 0.5;
}

const minShift = -0.5;
const maxShift = 12.5;
const pointCount = 6000;
const step = (maxShift - minShift) / (pointCount - 1);

// [center ppm, height, half-width ppm]
const lines = [
  [0.0, 26, 0.008], // TMS reference singlet
  [1.15, 20, 0.011], [1.2, 44, 0.011], [1.25, 20, 0.011], // CH3 triplet, 1:2:1
  [2.6, 66, 0.026], // OH singlet, broadened (exchangeable proton)
  [3.625, 13, 0.011], [3.675, 40, 0.011], [3.725, 40, 0.011], [3.775, 13, 0.011], // CH2 quartet, 1:3:3:1
];

const spectrum = [];
for (let i = 0; i < pointCount; i++) {
  const shift = minShift + i * step;
  let intensity = 0;
  for (const [center, height, halfWidth] of lines) {
    intensity += lorentzian(shift, center, height, halfWidth);
  }
  intensity += nextNoise() * 0.5;
  spectrum.push([Number(shift.toFixed(4)), Number(intensity.toFixed(3))]);
}

function apexNear(centerPpm, windowPpm) {
  let best = -Infinity;
  for (const [x, y] of spectrum) {
    if (Math.abs(x - centerPpm) <= windowPpm) best = Math.max(best, y);
  }
  return best;
}

const peakCallouts = [
  { value: 0.0, window: 0.02, name: "TMS 0.00" },
  { value: 1.2, window: 0.1, name: "CH₃ 1.20 (t)" },
  { value: 2.6, window: 0.05, name: "OH 2.60 (s)" },
  { value: 3.7, window: 0.15, name: "CH₂ 3.70 (q)" },
].map((peak) => ({ x: peak.value, y: apexNear(peak.value, peak.window) + 7, name: peak.name }));

// --- Chart -----------------------------------------------------------------
Highcharts.chart("container", {
  chart: {
    type: "area",
    backgroundColor: "transparent",
    animation: false,
    style: { fontFamily: "inherit" },
  },
  credits: { enabled: false },
  colors: t.palette,
  title: {
    text: "Ethanol · spectrum-nmr · javascript · highcharts · anyplot.ai",
    style: { color: t.ink, fontSize: "22px", fontWeight: "600" },
  },
  subtitle: {
    text: "Synthetic ¹H NMR spectrum (400 MHz, CDCl₃)",
    style: { color: t.inkSoft, fontSize: "14px" },
  },
  xAxis: {
    title: { text: "Chemical Shift (δ, ppm)", style: { color: t.inkSoft, fontSize: "16px" } },
    reversed: true,
    min: minShift,
    max: maxShift,
    tickInterval: 1,
    tickWidth: 0,
    gridLineWidth: 0,
    lineColor: t.inkSoft,
    labels: { style: { color: t.inkSoft, fontSize: "14px" } },
  },
  yAxis: {
    title: { text: "Intensity (a.u.)", style: { color: t.inkSoft, fontSize: "16px" } },
    labels: { enabled: false },
    gridLineWidth: 0,
    tickWidth: 0,
    lineWidth: 1,
    lineColor: t.inkSoft,
    min: -3,
  },
  legend: { enabled: false },
  tooltip: {
    headerFormat: "",
    pointFormat: "δ {point.x:.2f} ppm — intensity {point.y:.1f}",
  },
  plotOptions: {
    series: { animation: false },
    area: { lineWidth: 2.5, fillOpacity: 0.22, marker: { enabled: false }, threshold: 0 },
  },
  series: [
    { name: "Signal Intensity", data: spectrum },
    {
      name: "Peak Assignments",
      type: "scatter",
      data: peakCallouts,
      marker: { enabled: false },
      enableMouseTracking: false,
      dataLabels: {
        enabled: true,
        format: "{point.name}",
        align: "center",
        verticalAlign: "bottom",
        style: { color: t.inkSoft, fontSize: "13px", fontWeight: "500", textOutline: "none" },
      },
    },
  ],
});
Runnable source as JSON, for any HTTP client: https://api.anyplot.ai/specs/spectrum-nmr/highcharts/code. Any spec id and library id listed in llms-full.txt fit the same URL shape; every URL below is complete and callable.
{
  "spec_id": "spectrum-nmr",
  "language": "javascript",
  "library": "highcharts",
  "page": "https://anyplot.ai/spectrum-nmr/javascript/highcharts",
  "hub": "https://anyplot.ai/spectrum-nmr",
  "code_json": "https://api.anyplot.ai/specs/spectrum-nmr/highcharts/code",
  "spec_json": "https://api.anyplot.ai/specs/spectrum-nmr",
  "render_light_png": "https://storage.googleapis.com/anyplot-images/plots/spectrum-nmr/javascript/highcharts/plot-light.png",
  "render_dark_png": "https://storage.googleapis.com/anyplot-images/plots/spectrum-nmr/javascript/highcharts/plot-dark.png",
  "interactive_light_html": "https://storage.googleapis.com/anyplot-images/plots/spectrum-nmr/javascript/highcharts/plot-light.html",
  "interactive_dark_html": "https://storage.googleapis.com/anyplot-images/plots/spectrum-nmr/javascript/highcharts/plot-dark.html",
  "quality_score": 90.0,
  "license": "MIT",
  "guide": "https://anyplot.ai/llms.txt"
}
Part of NMR Spectrum (Nuclear Magnetic Resonance) on anyplot.ai.