The same plot in 14 other libraries — Python: Altair, Bokeh, lets-plot, Matplotlib, Plotly, plotnine, Pygal, Seaborn; R: ggplot2; JavaScript: Chart.js, D3.js, Apache ECharts, Highcharts, MUI X Charts. Compare all 15 side by side: NMR Spectrum (Nuclear Magnetic Resonance) in Python, R, Julia and JavaScript.
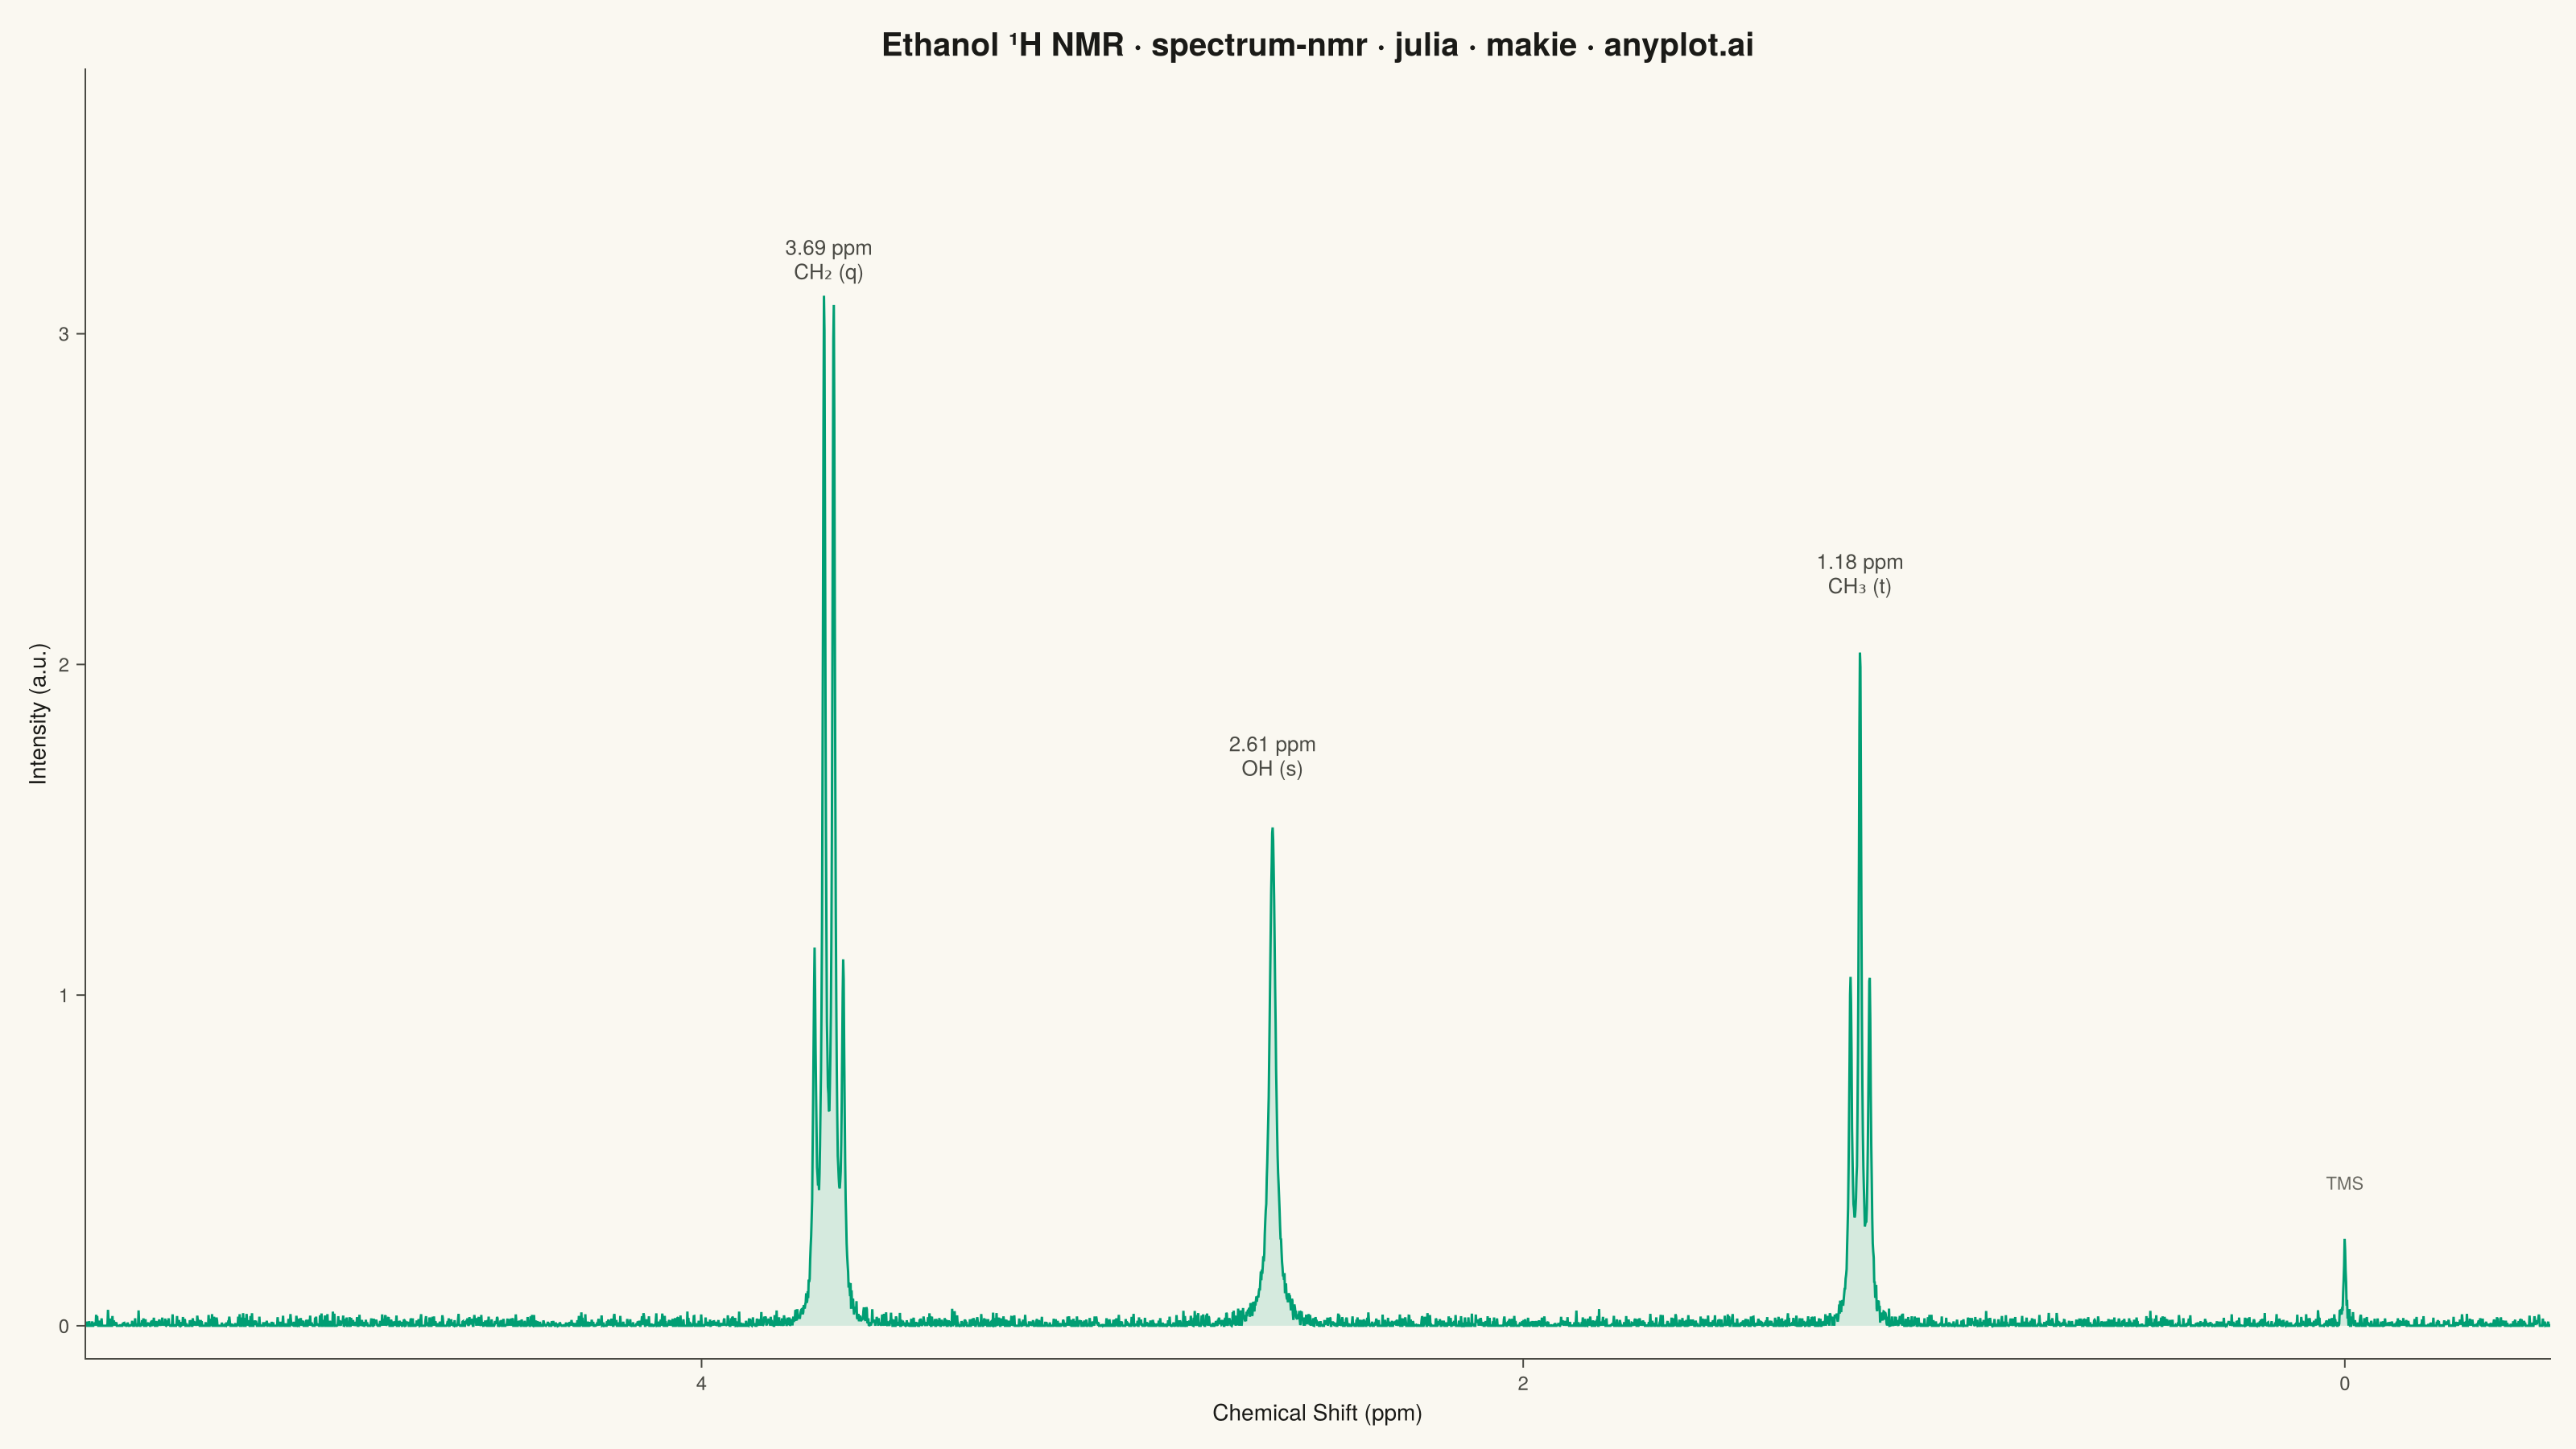
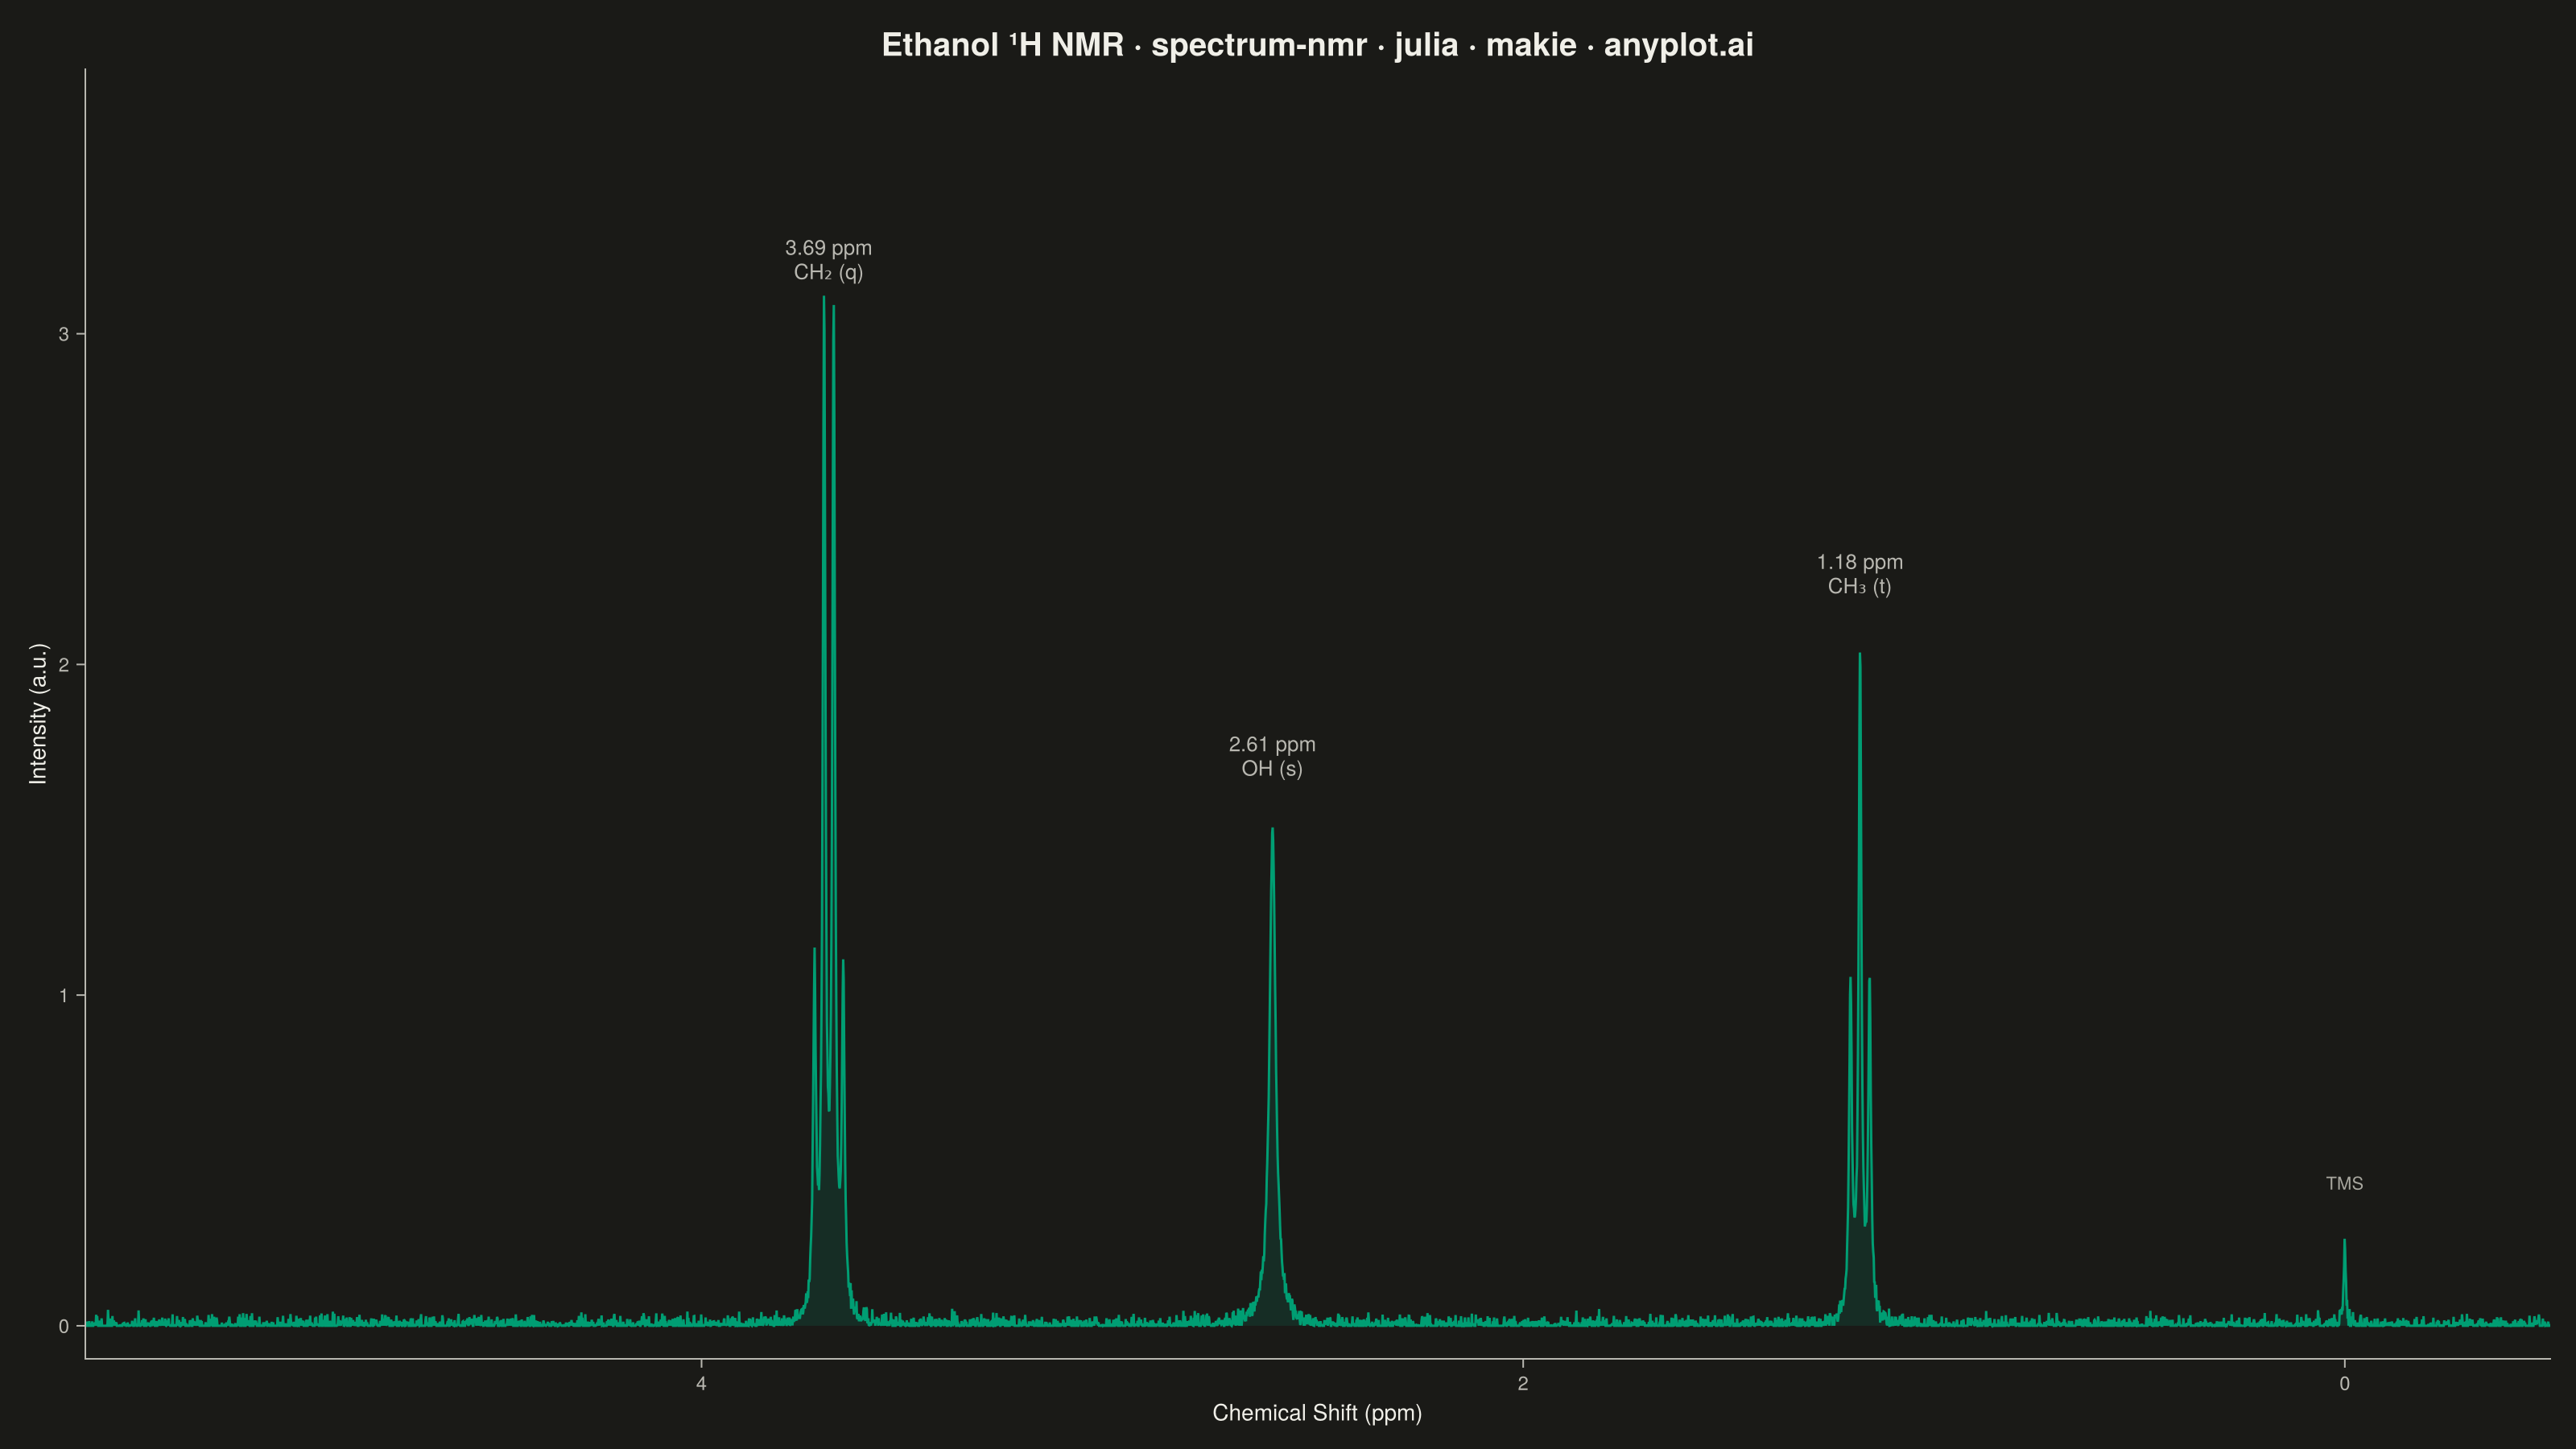
An NMR spectrum plots signal intensity versus chemical shift (in ppm) to reveal the electronic environment of atomic nuclei in a molecule. It is the primary analytical tool in organic chemistry for determining molecular structure, with peak positions indicating functional groups and splitting patterns (multiplets) revealing connectivity between neighboring atoms. The x-axis is conventionally reversed (high ppm on the left) and peaks appear as sharp signals rising from a baseline.
# anyplot.ai
# spectrum-nmr: NMR Spectrum (Nuclear Magnetic Resonance)
# Library: makie 0.22.10 | Julia 1.11.9
# Quality: 88/100 | Created: 2026-06-03

using CairoMakie
using Colors
using Random

Random.seed!(42)

# Theme tokens
const THEME       = get(ENV, "ANYPLOT_THEME", "light")
const PAGE_BG     = THEME == "light" ? colorant"#FAF8F1" : colorant"#1A1A17"
const ELEVATED_BG = THEME == "light" ? colorant"#FFFDF6" : colorant"#242420"
const INK         = THEME == "light" ? colorant"#1A1A17" : colorant"#F0EFE8"
const INK_SOFT    = THEME == "light" ? colorant"#4A4A44" : colorant"#B8B7B0"
const INK_MUTED   = THEME == "light" ? colorant"#6B6A63" : colorant"#A8A79F"
const IMPRINT_PALETTE = [
    colorant"#009E73", colorant"#C475FD", colorant"#4467A3", colorant"#BD8233",
    colorant"#AE3030", colorant"#2ABCCD", colorant"#954477", colorant"#99B314",
]

# Data: synthetic 1H NMR spectrum of ethanol (CH3CH2OH) at 300 MHz
lorentz(x, x0, w, h) = h * (w / 2)^2 / ((x - x0)^2 + (w / 2)^2)

n_pts    = 5000
ppm_min  = -0.5
ppm_max  = 5.5
ppm_vals = collect(range(ppm_min, ppm_max, length = n_pts))

J  = 7.0 / 300.0   # coupling constant in ppm at 300 MHz spectrometer
pw = 0.008          # Lorentzian half-width for sharp peaks (ppm)

# TMS reference at 0.0 ppm (singlet)
intensity = lorentz.(ppm_vals, 0.0, 0.006, 0.25)

# CH3 triplet at 1.18 ppm — 1:2:1 relative heights
intensity .+= lorentz.(ppm_vals, 1.18 - J,  pw, 1.0)
intensity .+= lorentz.(ppm_vals, 1.18,      pw, 2.0)
intensity .+= lorentz.(ppm_vals, 1.18 + J,  pw, 1.0)

# OH singlet at 2.61 ppm — broader due to hydrogen-bonding exchange
intensity .+= lorentz.(ppm_vals, 2.61, 0.018, 1.5)

# CH2 quartet at 3.69 ppm — 1:3:3:1 relative heights
intensity .+= lorentz.(ppm_vals, 3.69 - 1.5 * J, pw, 1.0)
intensity .+= lorentz.(ppm_vals, 3.69 - 0.5 * J, pw, 3.0)
intensity .+= lorentz.(ppm_vals, 3.69 + 0.5 * J, pw, 3.0)
intensity .+= lorentz.(ppm_vals, 3.69 + 1.5 * J, pw, 1.0)

# Baseline noise (low SNR — realistic clean spectrum)
intensity .+= 0.015 .* randn(n_pts)
intensity .= max.(intensity, 0.0)

# Title
title_str      = "Ethanol ¹H NMR · spectrum-nmr · julia · makie · anyplot.ai"
n_chars        = length(title_str)
title_fontsize = n_chars > 67 ? max(14, round(Int, 20 * 67 / n_chars)) : 20

# Figure — landscape 3200x1800
fig = Figure(
    size            = (1600, 900),
    fontsize        = 14,
    backgroundcolor = PAGE_BG,
)

ax = Axis(
    fig[1, 1];
    title              = title_str,
    titlesize          = Float32(title_fontsize),
    titlecolor         = INK,
    xlabel             = "Chemical Shift (ppm)",
    ylabel             = "Intensity (a.u.)",
    xlabelcolor        = INK,
    ylabelcolor        = INK,
    xlabelsize         = 14,
    ylabelsize         = 14,
    xticklabelcolor    = INK_SOFT,
    yticklabelcolor    = INK_SOFT,
    xticklabelsize     = 12,
    yticklabelsize     = 12,
    xtickcolor         = INK_SOFT,
    ytickcolor         = INK_SOFT,
    backgroundcolor    = PAGE_BG,
    topspinevisible    = false,
    rightspinevisible  = false,
    leftspinecolor     = INK_SOFT,
    bottomspinecolor   = INK_SOFT,
    xgridvisible       = false,
    ygridvisible       = false,
    xreversed          = true,
    limits             = (ppm_min, ppm_max, -0.1, 3.8),
)

# Shaded area under spectrum trace (filled before the line to stay behind it)
band!(ax, ppm_vals, zeros(n_pts), intensity; color = (IMPRINT_PALETTE[1], 0.15))

# NMR spectrum trace
lines!(ax, ppm_vals, intensity; color = IMPRINT_PALETTE[1], linewidth = 1.5)

# Peak assignment labels
text!(ax, 1.18, 2.2;
    text     = "1.18 ppm\nCH₃ (t)",
    align    = (:center, :bottom),
    color    = INK_SOFT,
    fontsize = 13,
)
text!(ax, 2.61, 1.65;
    text     = "2.61 ppm\nOH (s)",
    align    = (:center, :bottom),
    color    = INK_SOFT,
    fontsize = 13,
)
text!(ax, 3.69, 3.15;
    text     = "3.69 ppm\nCH₂ (q)",
    align    = (:center, :bottom),
    color    = INK_SOFT,
    fontsize = 13,
)
text!(ax, 0.0, 0.4;
    text     = "TMS",
    align    = (:center, :bottom),
    color    = INK_MUTED,
    fontsize = 11,
)

save("plot-$(THEME).png", fig; px_per_unit = 2)
Runnable source as JSON, for any HTTP client: https://api.anyplot.ai/specs/spectrum-nmr/makie/code. Any spec id and library id listed in llms-full.txt fit the same URL shape; every URL below is complete and callable.
{
  "spec_id": "spectrum-nmr",
  "language": "julia",
  "library": "makie",
  "page": "https://anyplot.ai/spectrum-nmr/julia/makie",
  "hub": "https://anyplot.ai/spectrum-nmr",
  "code_json": "https://api.anyplot.ai/specs/spectrum-nmr/makie/code",
  "spec_json": "https://api.anyplot.ai/specs/spectrum-nmr",
  "render_light_png": "https://storage.googleapis.com/anyplot-images/plots/spectrum-nmr/julia/makie/plot-light.png",
  "render_dark_png": "https://storage.googleapis.com/anyplot-images/plots/spectrum-nmr/julia/makie/plot-dark.png",
  "quality_score": 88.0,
  "license": "MIT",
  "guide": "https://anyplot.ai/llms.txt"
}
Part of NMR Spectrum (Nuclear Magnetic Resonance) on anyplot.ai.