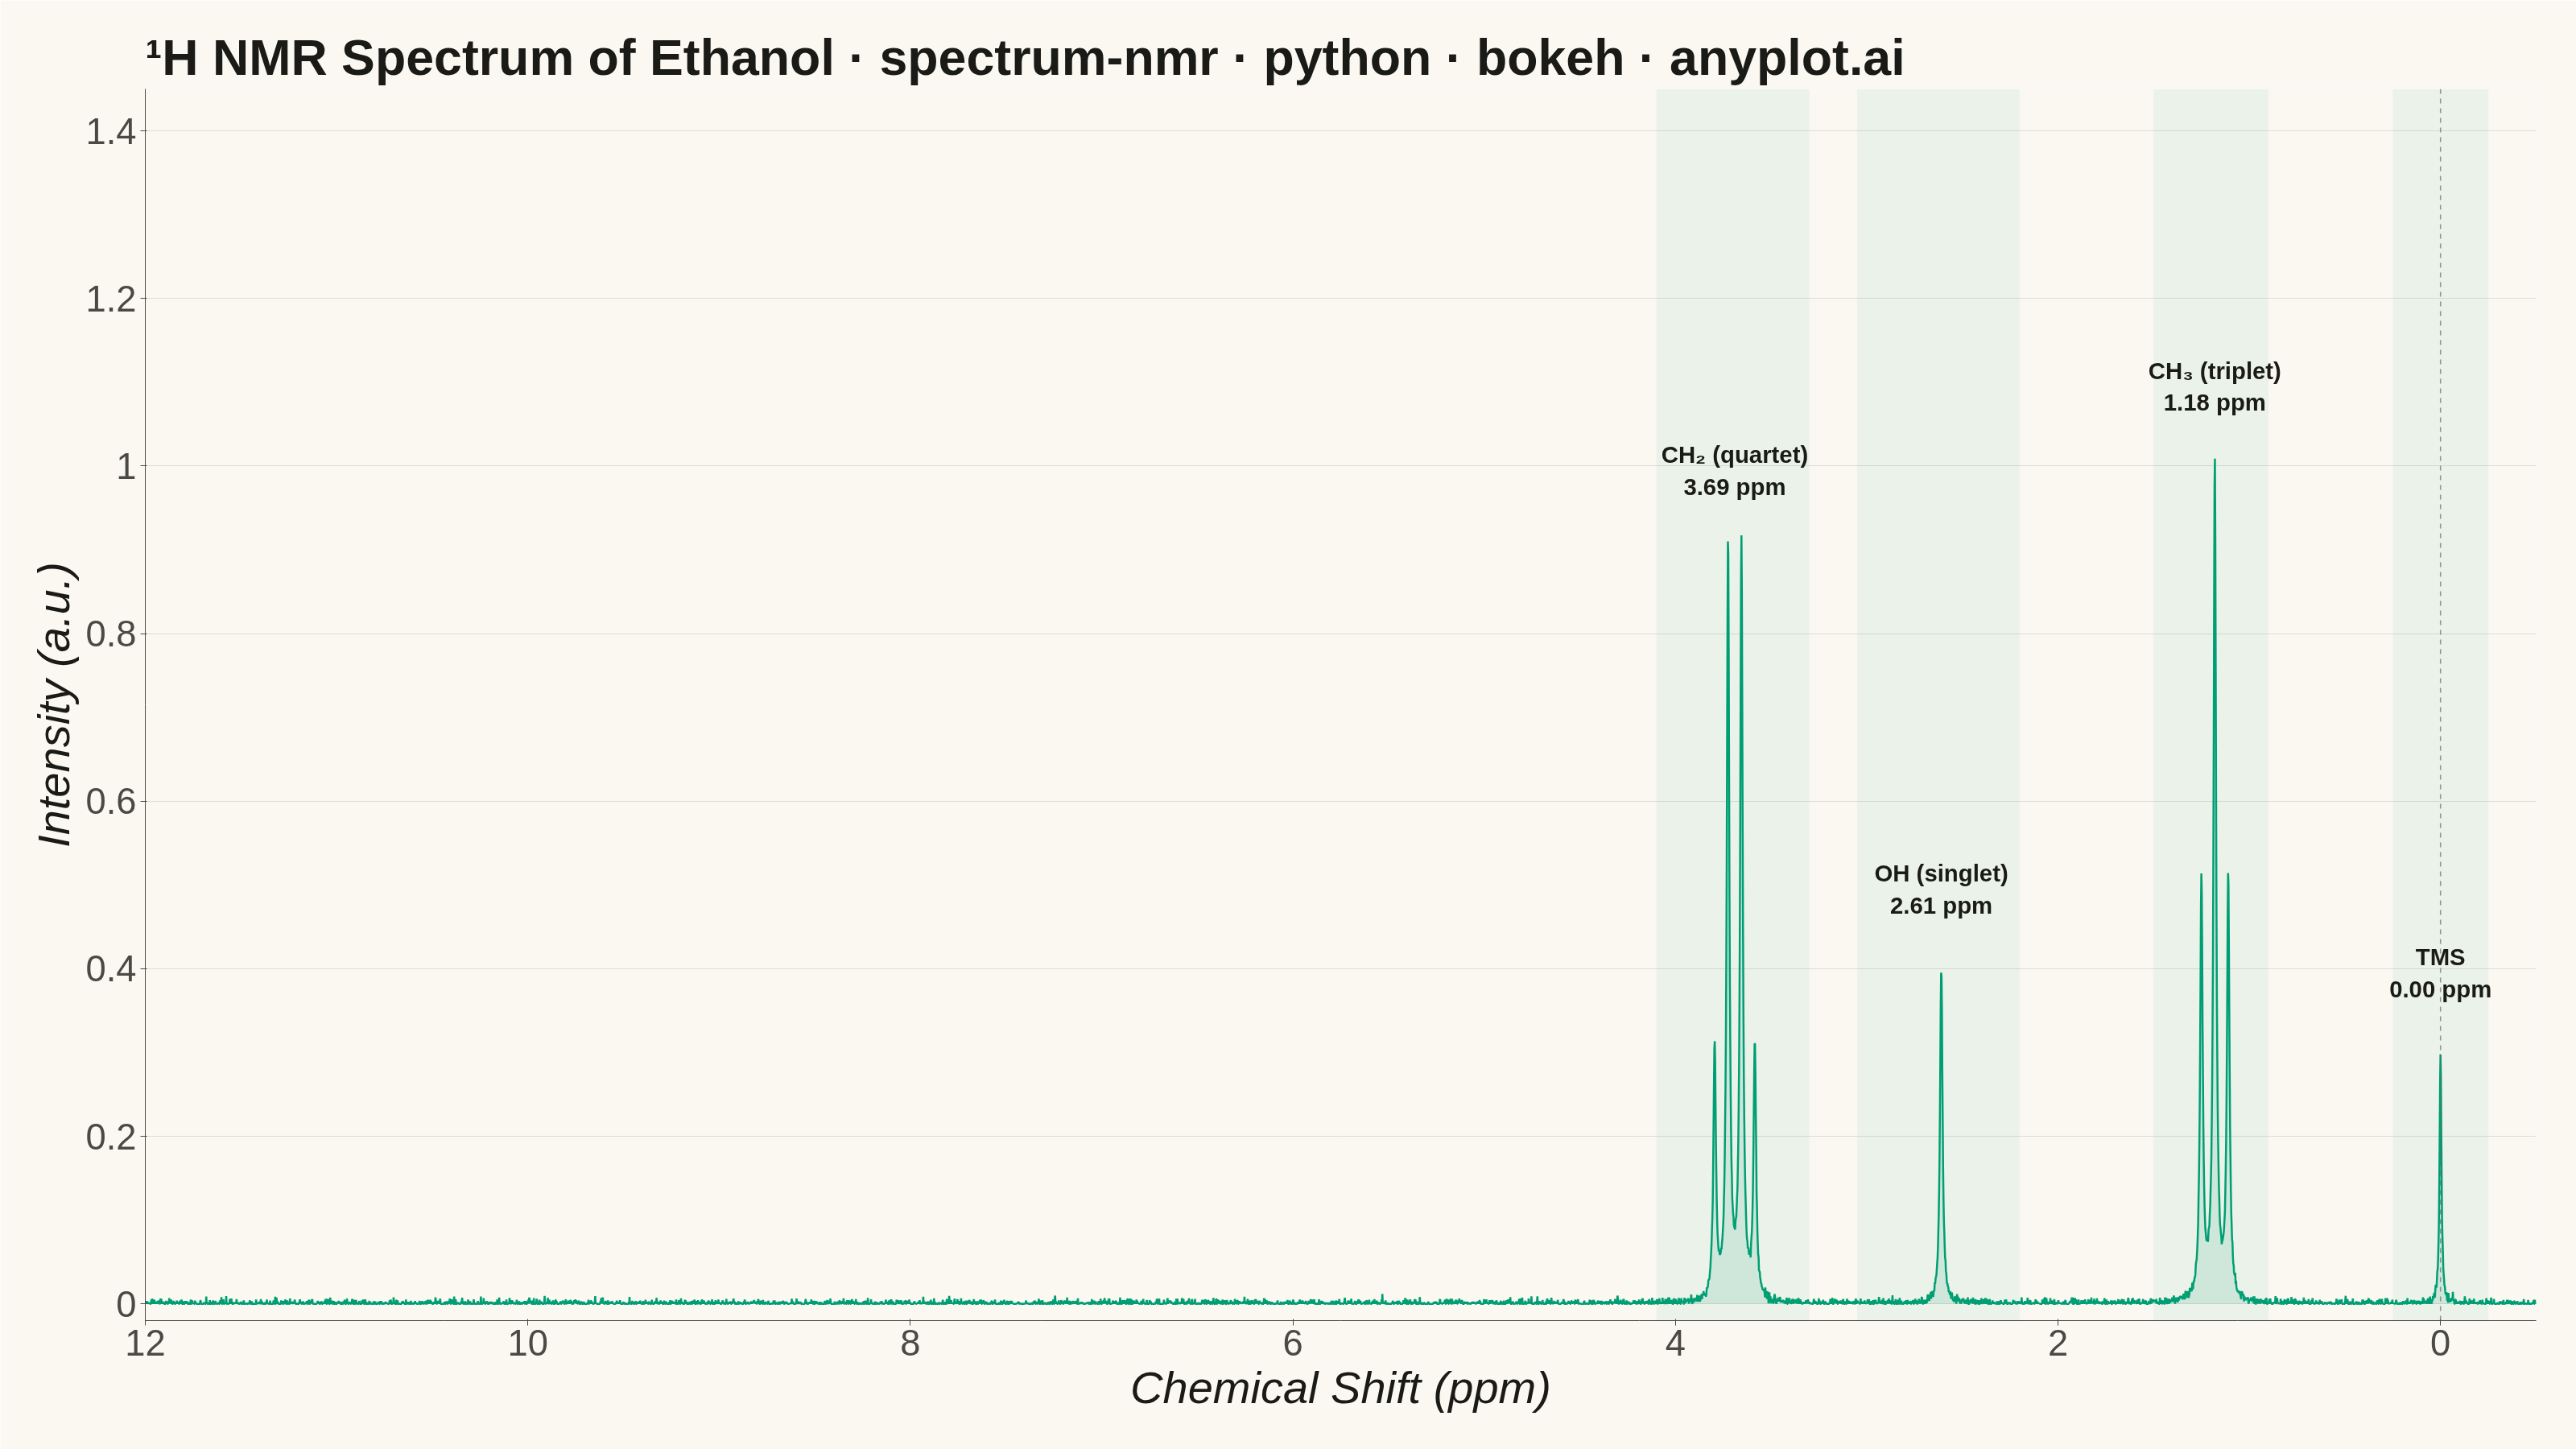
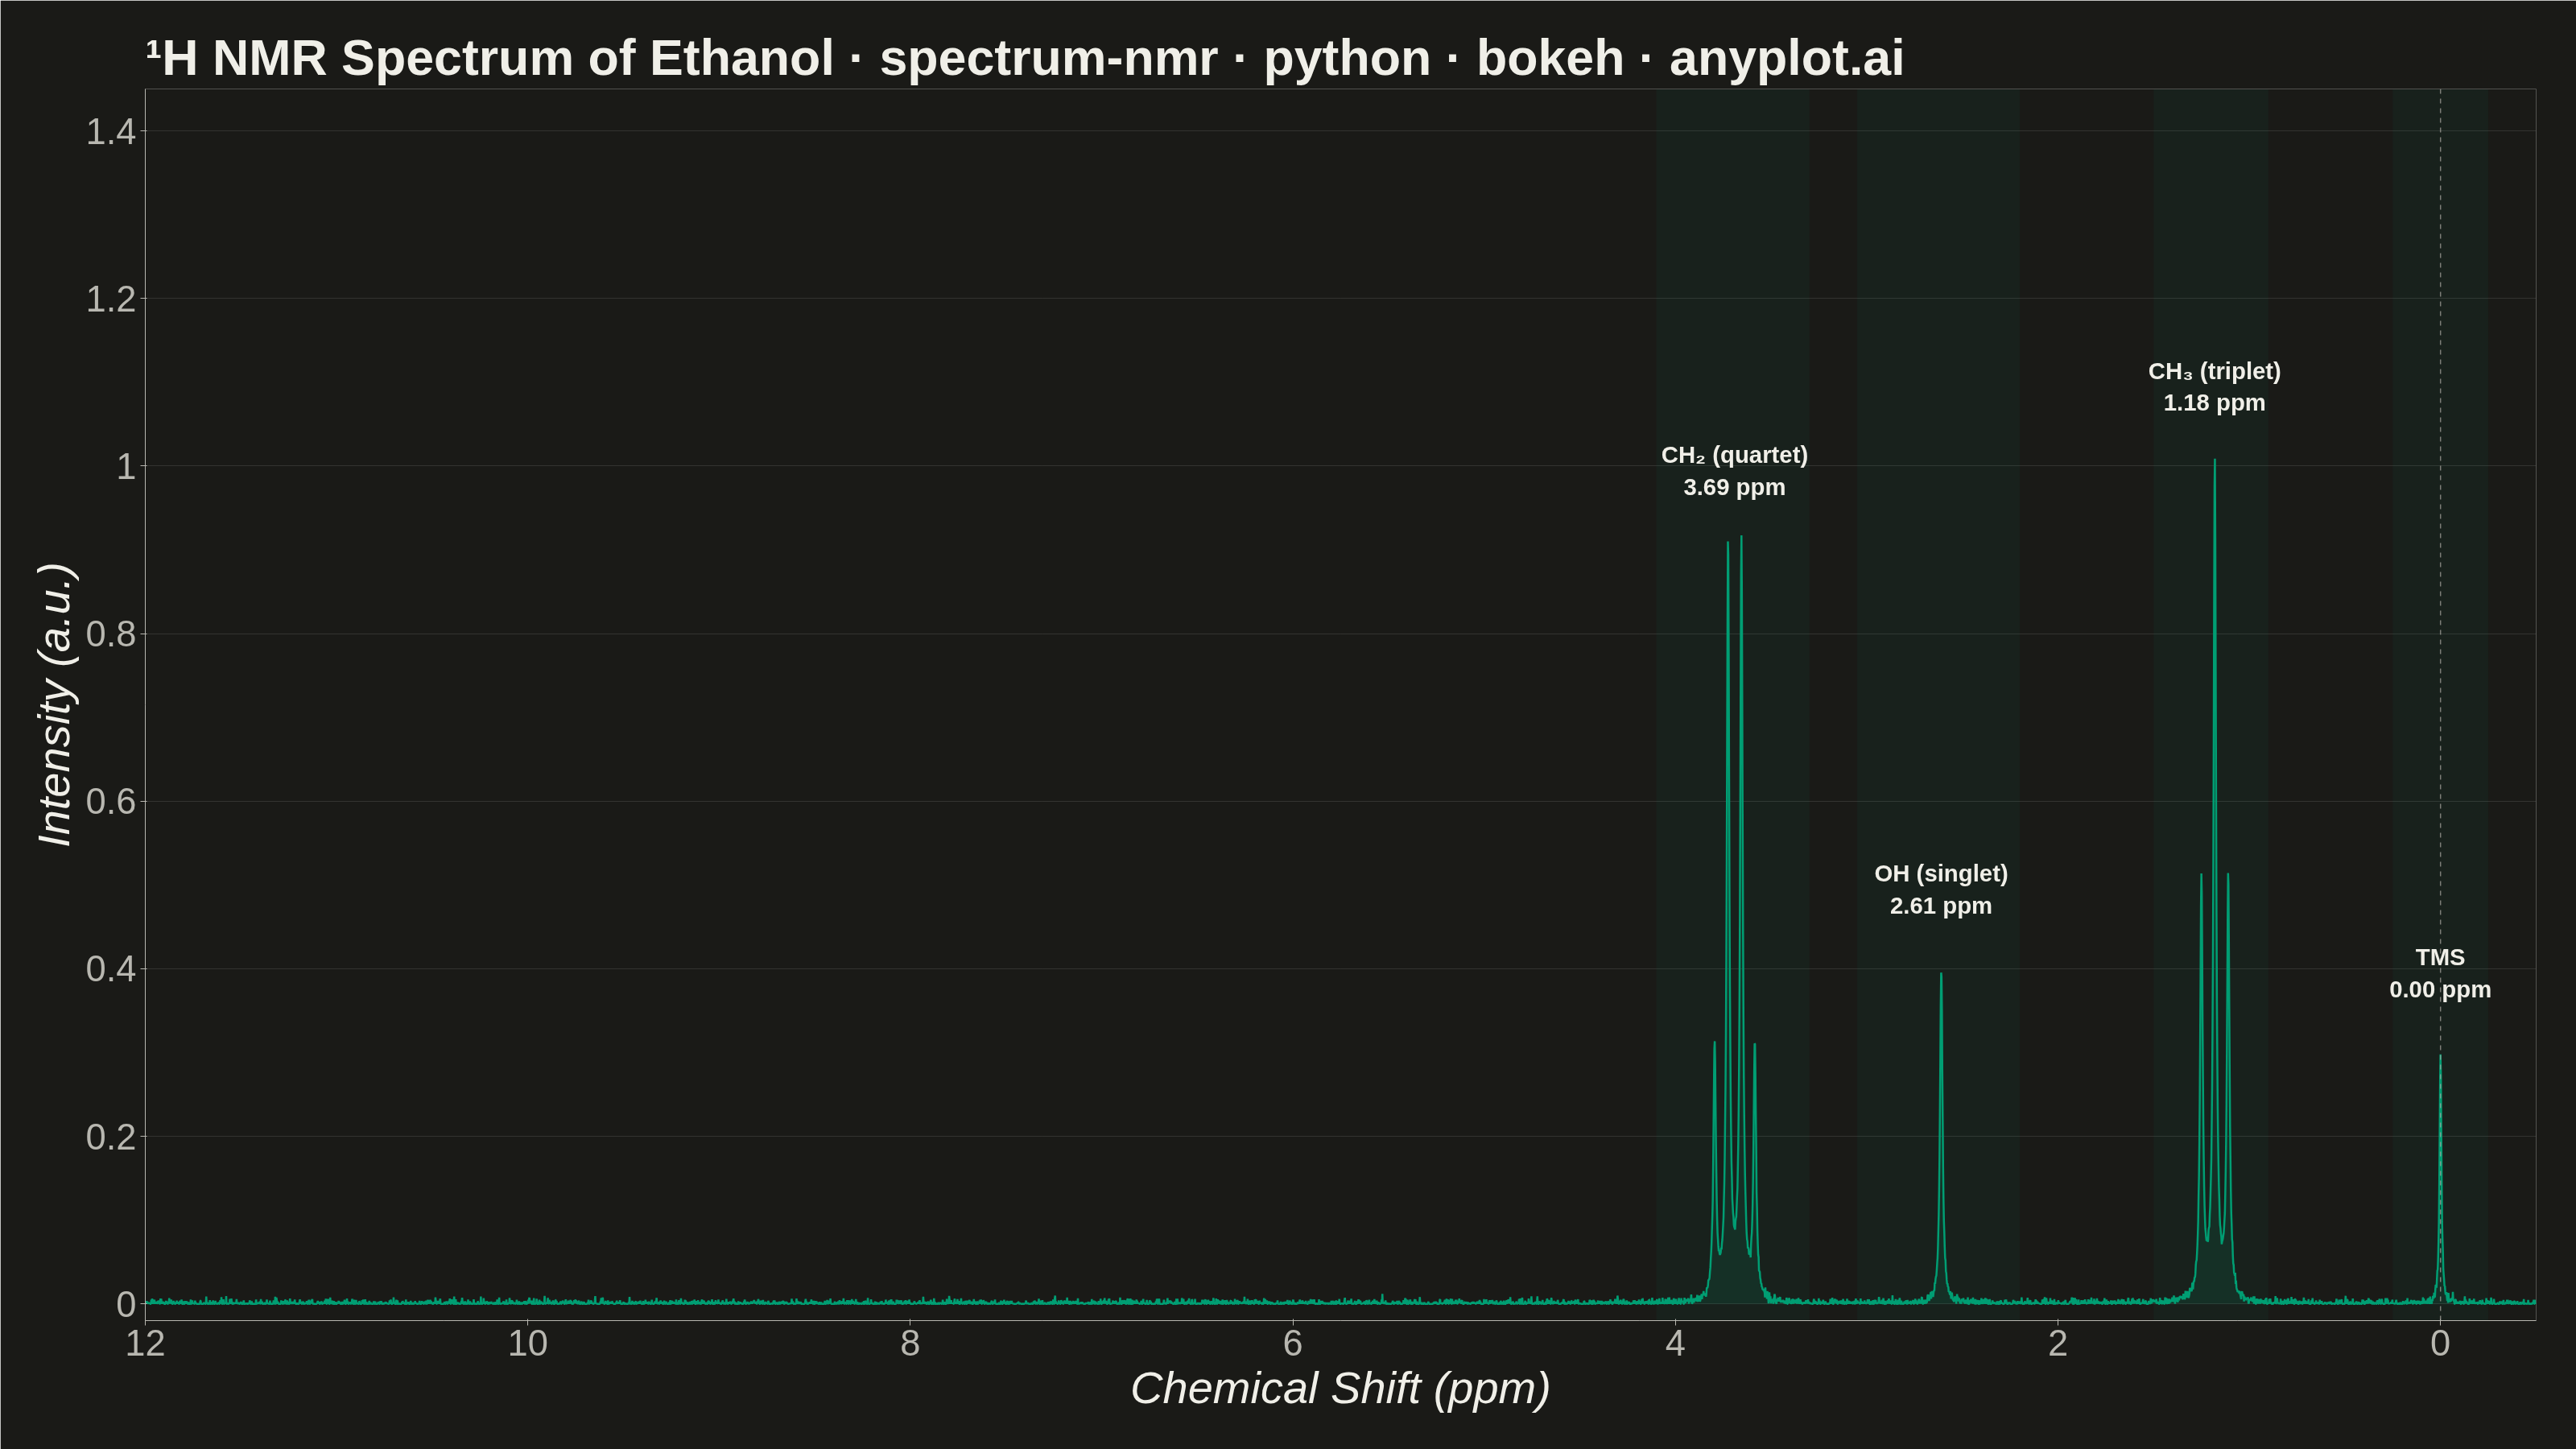
An NMR spectrum plots signal intensity versus chemical shift (in ppm) to reveal the electronic environment of atomic nuclei in a molecule. It is the primary analytical tool in organic chemistry for determining molecular structure, with peak positions indicating functional groups and splitting patterns (multiplets) revealing connectivity between neighboring atoms. The x-axis is conventionally reversed (high ppm on the left) and peaks appear as sharp signals rising from a baseline.
""" anyplot.ai
spectrum-nmr: NMR Spectrum (Nuclear Magnetic Resonance)
Library: bokeh 3.9.0 | Python 3.13.13
Quality: 92/100 | Updated: 2026-06-03
"""

import os
import sys
import time
from pathlib import Path


# bokeh.py is the script name — remove its directory from sys.path so that
# `import bokeh` resolves to the installed package, not this file itself.
_here = os.path.dirname(os.path.abspath(__file__))
sys.path[:] = [p for p in sys.path if os.path.abspath(p) != _here]

import numpy as np
from bokeh.io import output_file, save
from bokeh.models import ColumnDataSource, HoverTool, Label, Span
from bokeh.plotting import figure
from selenium import webdriver
from selenium.webdriver.chrome.options import Options


# Theme tokens
THEME = os.getenv("ANYPLOT_THEME", "light")
PAGE_BG = "#FAF8F1" if THEME == "light" else "#1A1A17"
ELEVATED_BG = "#FFFDF6" if THEME == "light" else "#242420"
INK = "#1A1A17" if THEME == "light" else "#F0EFE8"
INK_SOFT = "#4A4A44" if THEME == "light" else "#B8B7B0"
INK_MUTED = "#6B6A63" if THEME == "light" else "#A8A79F"

# Imprint palette — first series always #009E73
BRAND = "#009E73"

# Data - synthetic 1H NMR spectrum of ethanol (CH3-CH2-OH)
np.random.seed(42)
ppm = np.linspace(-0.5, 12.0, 6000)
w = 0.008  # Lorentzian peak width
j = 0.07  # J-coupling constant

# TMS reference peak at 0 ppm (singlet)
w_tms = 0.006
spectrum = 0.3 * w_tms**2 / ((ppm - 0.0) ** 2 + w_tms**2)

# CH3 triplet near 1.18 ppm (intensity ratio 1:2:1)
spectrum += 0.5 * w**2 / ((ppm - (1.18 - j)) ** 2 + w**2)
spectrum += 1.0 * w**2 / ((ppm - 1.18) ** 2 + w**2)
spectrum += 0.5 * w**2 / ((ppm - (1.18 + j)) ** 2 + w**2)

# OH singlet near 2.61 ppm
spectrum += 0.4 * w**2 / ((ppm - 2.61) ** 2 + w**2)

# CH2 quartet near 3.69 ppm (intensity ratio 1:3:3:1)
spectrum += 0.3 * w**2 / ((ppm - (3.69 - 1.5 * j)) ** 2 + w**2)
spectrum += 0.9 * w**2 / ((ppm - (3.69 - 0.5 * j)) ** 2 + w**2)
spectrum += 0.9 * w**2 / ((ppm - (3.69 + 0.5 * j)) ** 2 + w**2)
spectrum += 0.3 * w**2 / ((ppm - (3.69 + 1.5 * j)) ** 2 + w**2)

# Subtle baseline noise
spectrum += np.random.normal(0, 0.003, len(ppm))
spectrum = np.maximum(spectrum, 0)

# Molecular group label for each data point (enriches interactive tooltip)
_peak_centers = [(0.0, "TMS"), (1.18, "CH₃ triplet"), (2.61, "OH singlet"), (3.69, "CH₂ quartet")]
groups = np.array(["baseline"] * len(ppm), dtype=object)
for _center, _name in _peak_centers:
    groups[np.abs(ppm - _center) < 0.6] = _name

source = ColumnDataSource(data={"ppm": ppm, "intensity": spectrum, "group": groups})

# Title with length-scaled fontsize (bokeh default '50pt' baseline at 67 chars)
title_text = "¹H NMR Spectrum of Ethanol · spectrum-nmr · python · bokeh · anyplot.ai"
n = len(title_text)
ratio = 67 / n if n > 67 else 1.0
title_fontsize = f"{max(34, round(50 * ratio))}pt"

# Figure: 3200×1800, reversed x-axis (NMR convention: high ppm on left)
p = figure(
    width=3200,
    height=1800,
    title=title_text,
    x_axis_label="Chemical Shift (ppm)",
    y_axis_label="Intensity (a.u.)",
    x_range=(12.0, -0.5),
    toolbar_location=None,
    min_border_bottom=160,
    min_border_left=180,
    min_border_top=110,
    min_border_right=50,
)

# Subtle functional-group region shading (behind data layer)
_region_coords = [(-0.25, 0.25), (0.90, 1.50), (2.20, 3.05), (3.30, 4.10)]
for r_left, r_right in _region_coords:
    p.quad(top=1.45, bottom=-0.02, left=r_left, right=r_right, fill_color=BRAND, fill_alpha=0.06, line_color=None)

# Filled area under spectrum — Imprint brand green with light alpha
p.varea(x="ppm", y1=0, y2="intensity", source=source, fill_color=BRAND, fill_alpha=0.12)

# Spectrum line
p.line(x="ppm", y="intensity", source=source, line_color=BRAND, line_width=2.5)

# TMS reference: dashed vertical line at 0 ppm
tms_span = Span(
    location=0.0, dimension="height", line_color=INK_MUTED, line_width=1.5, line_dash="dashed", line_alpha=0.7
)
p.add_layout(tms_span)

# Peak annotations with chemical shift values
peak_labels = [
    (0.0, 0.3, "TMS\n0.00 ppm"),
    (1.18, 1.0, "CH₃ (triplet)\n1.18 ppm"),
    (2.61, 0.4, "OH (singlet)\n2.61 ppm"),
    (3.69, 0.9, "CH₂ (quartet)\n3.69 ppm"),
]
for ppm_val, y_val, text in peak_labels:
    p.add_layout(
        Label(
            x=ppm_val,
            y=y_val + 0.06,
            text=text,
            text_font_size="22pt",
            text_color=INK,
            text_font_style="bold",
            text_align="center",
        )
    )

# HoverTool for interactive HTML exploration
p.add_tools(
    HoverTool(
        tooltips=[("Group", "@group"), ("Chemical Shift", "@ppm{0.00} ppm"), ("Intensity", "@intensity{0.000}")],
        mode="vline",
    )
)

# Theme-adaptive chrome
p.background_fill_color = PAGE_BG
p.border_fill_color = PAGE_BG
p.outline_line_color = None  # L-shaped frame: axes only, no enclosing box

p.title.text_font_size = title_fontsize
p.title.text_color = INK
p.title.text_font_style = "bold"

p.xaxis.axis_label_text_font_size = "42pt"
p.yaxis.axis_label_text_font_size = "42pt"
p.xaxis.major_label_text_font_size = "34pt"
p.yaxis.major_label_text_font_size = "34pt"
p.xaxis.axis_label_text_color = INK
p.yaxis.axis_label_text_color = INK
p.xaxis.major_label_text_color = INK_SOFT
p.yaxis.major_label_text_color = INK_SOFT
p.xaxis.axis_line_color = INK_SOFT
p.yaxis.axis_line_color = INK_SOFT
p.xaxis.major_tick_line_color = INK_SOFT
p.yaxis.major_tick_line_color = INK_SOFT
p.xaxis.minor_tick_line_color = None
p.yaxis.minor_tick_line_color = None

# Grid: y-axis only, very subtle
p.xgrid.grid_line_alpha = 0
p.ygrid.grid_line_color = INK
p.ygrid.grid_line_alpha = 0.12

# Y range: zero baseline with headroom for peak labels
p.y_range.start = -0.02
p.y_range.end = 1.45

# Save interactive HTML
output_file(f"plot-{THEME}.html")
save(p)

# Screenshot via headless Chrome (export_png is broken on this system)
W, H = 3200, 1800
opts = Options()
for arg in (
    "--headless=new",
    "--no-sandbox",
    "--disable-dev-shm-usage",
    "--disable-gpu",
    f"--window-size={W},{H}",
    "--hide-scrollbars",
):
    opts.add_argument(arg)
driver = webdriver.Chrome(options=opts)
# CDP override makes the inner viewport authoritative — --window-size alone
# is reduced by Chrome UI chrome in headless mode (gives 1661 instead of 1800)
driver.execute_cdp_cmd(
    "Emulation.setDeviceMetricsOverride", {"width": W, "height": H, "deviceScaleFactor": 1, "mobile": False}
)
driver.get(f"file://{Path(f'plot-{THEME}.html').resolve()}")
time.sleep(3)
driver.save_screenshot(f"plot-{THEME}.png")
driver.quit()
Runnable source as JSON, for any HTTP client: https://api.anyplot.ai/specs/spectrum-nmr/bokeh/code. Any spec id and library id listed in llms-full.txt fit the same URL shape; every URL below is complete and callable.
{
  "spec_id": "spectrum-nmr",
  "language": "python",
  "library": "bokeh",
  "page": "https://anyplot.ai/spectrum-nmr/python/bokeh",
  "hub": "https://anyplot.ai/spectrum-nmr",
  "code_json": "https://api.anyplot.ai/specs/spectrum-nmr/bokeh/code",
  "spec_json": "https://api.anyplot.ai/specs/spectrum-nmr",
  "render_light_png": "https://storage.googleapis.com/anyplot-images/plots/spectrum-nmr/python/bokeh/plot-light.png",
  "render_dark_png": "https://storage.googleapis.com/anyplot-images/plots/spectrum-nmr/python/bokeh/plot-dark.png",
  "interactive_light_html": "https://storage.googleapis.com/anyplot-images/plots/spectrum-nmr/python/bokeh/plot-light.html",
  "interactive_dark_html": "https://storage.googleapis.com/anyplot-images/plots/spectrum-nmr/python/bokeh/plot-dark.html",
  "quality_score": 92.0,
  "license": "MIT",
  "guide": "https://anyplot.ai/llms.txt"
}
Part of NMR Spectrum (Nuclear Magnetic Resonance) on anyplot.ai.