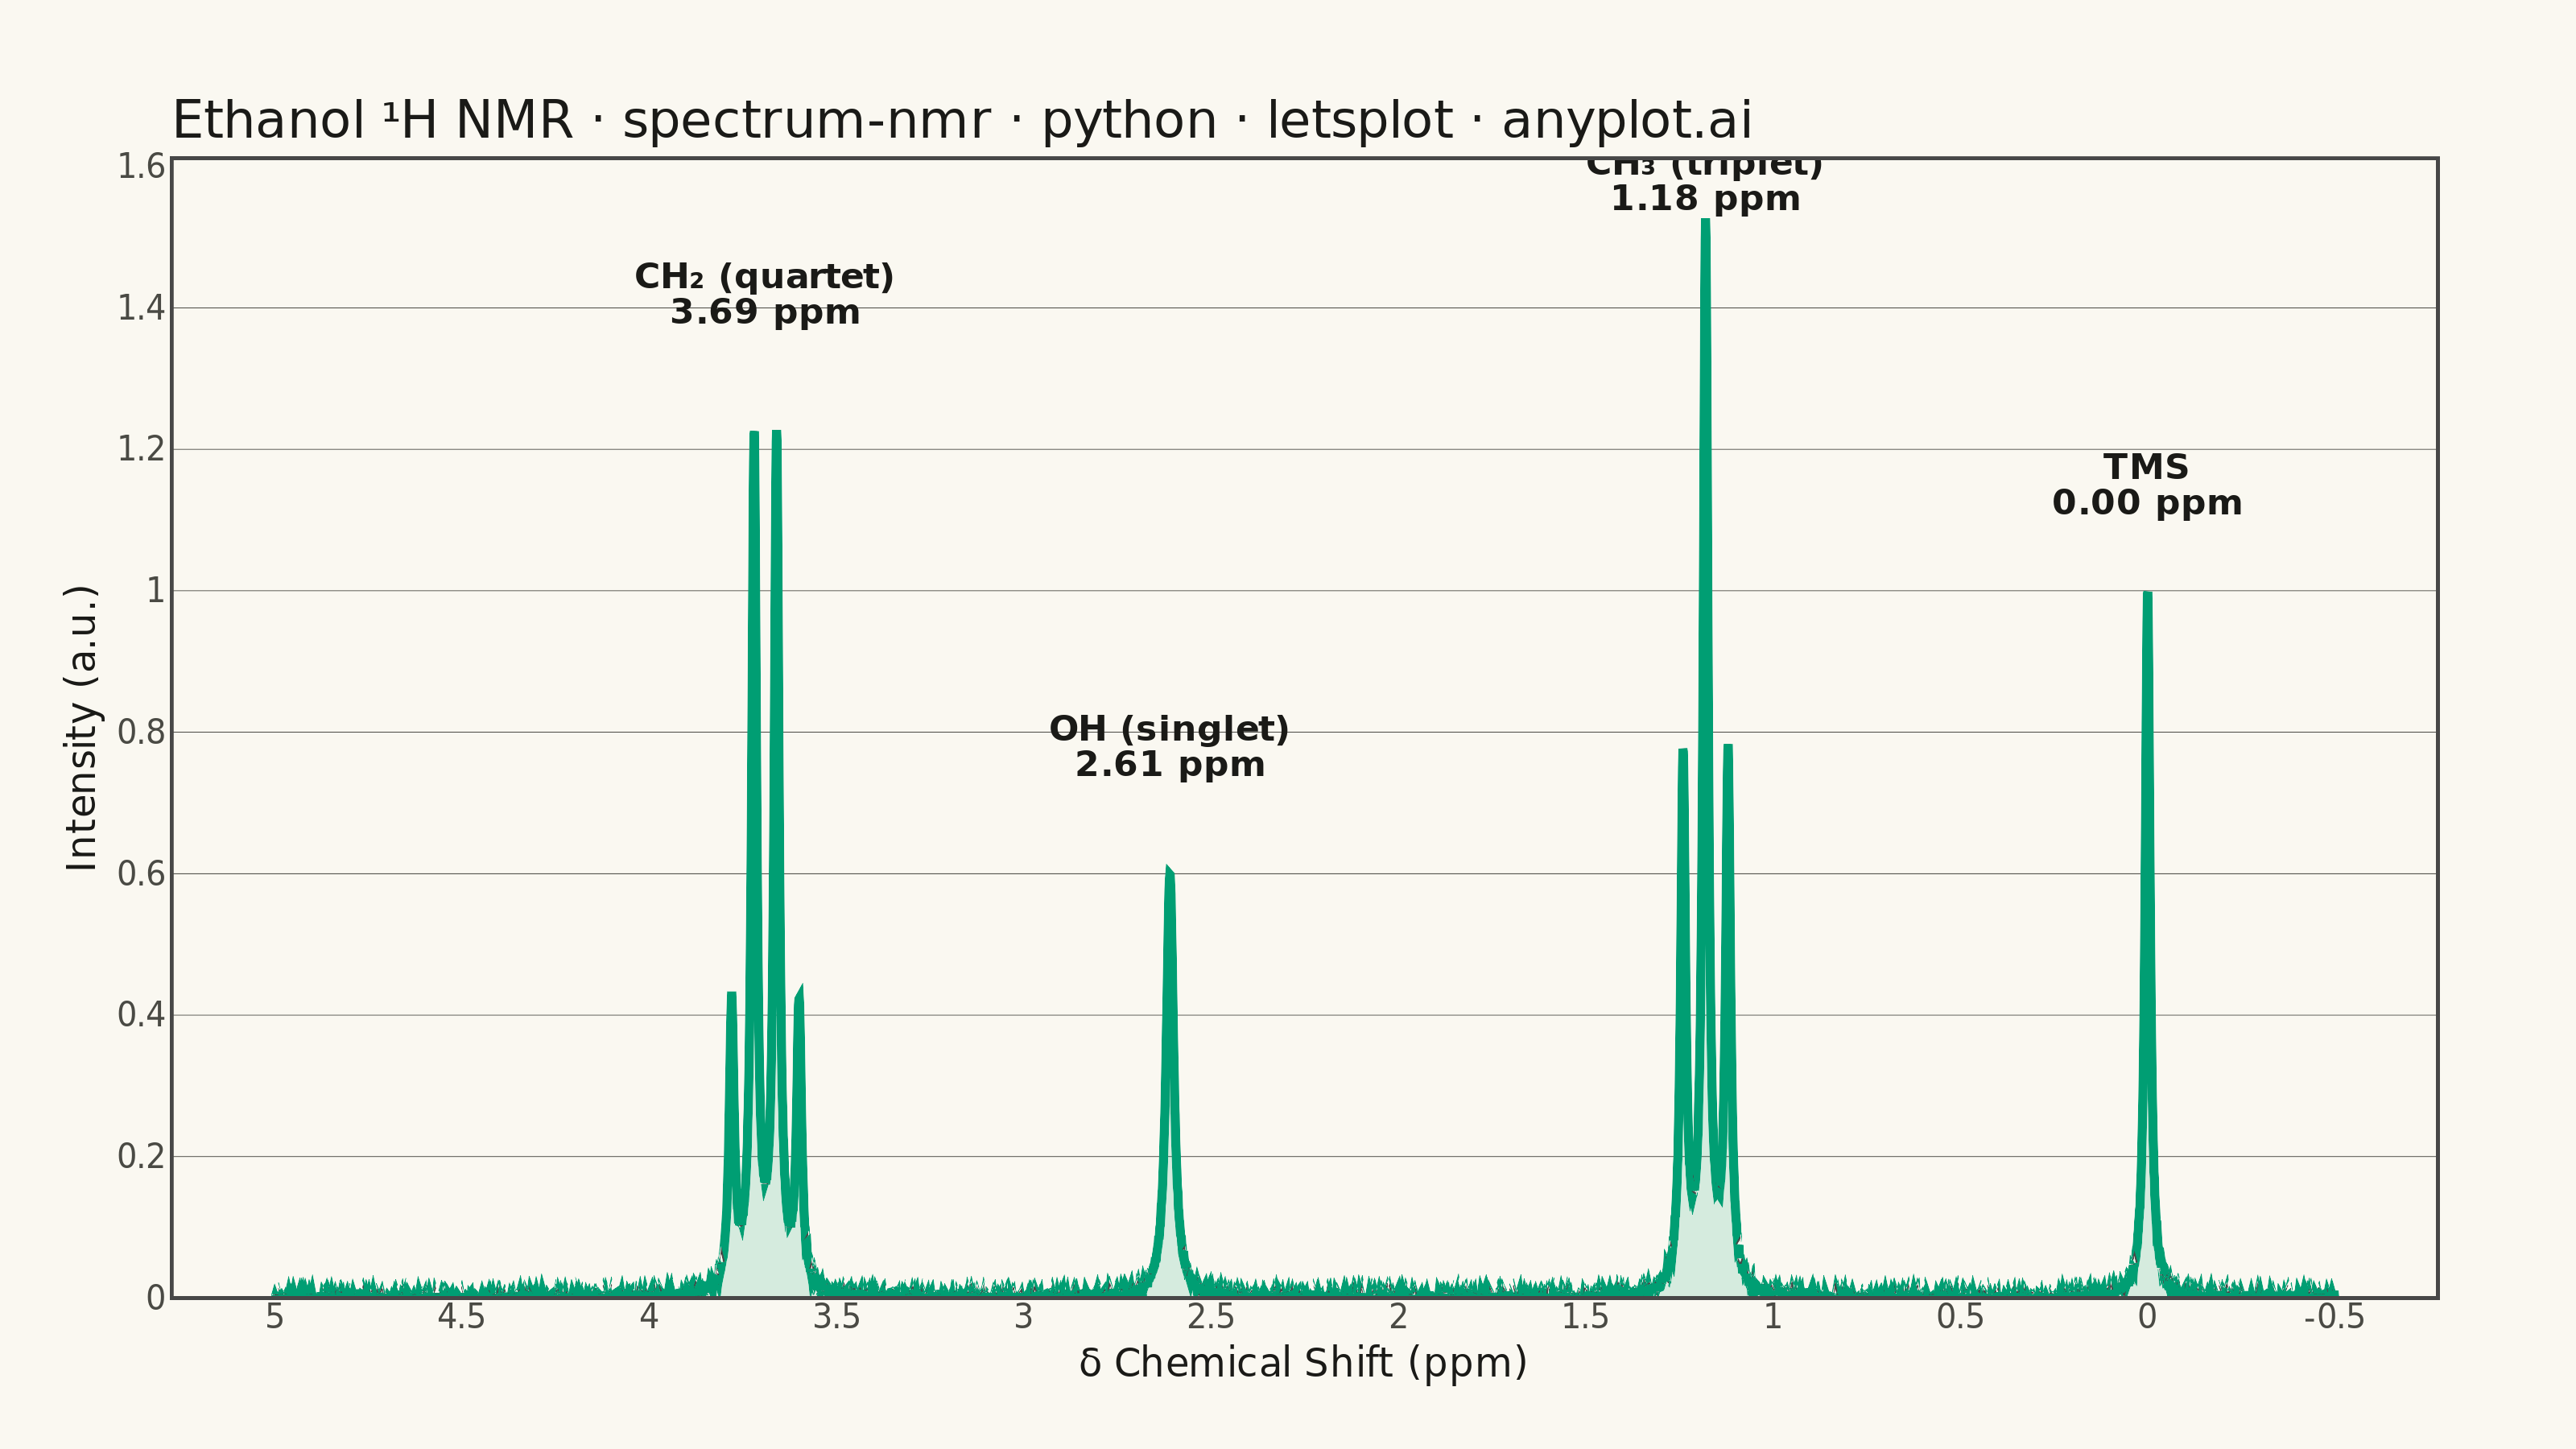
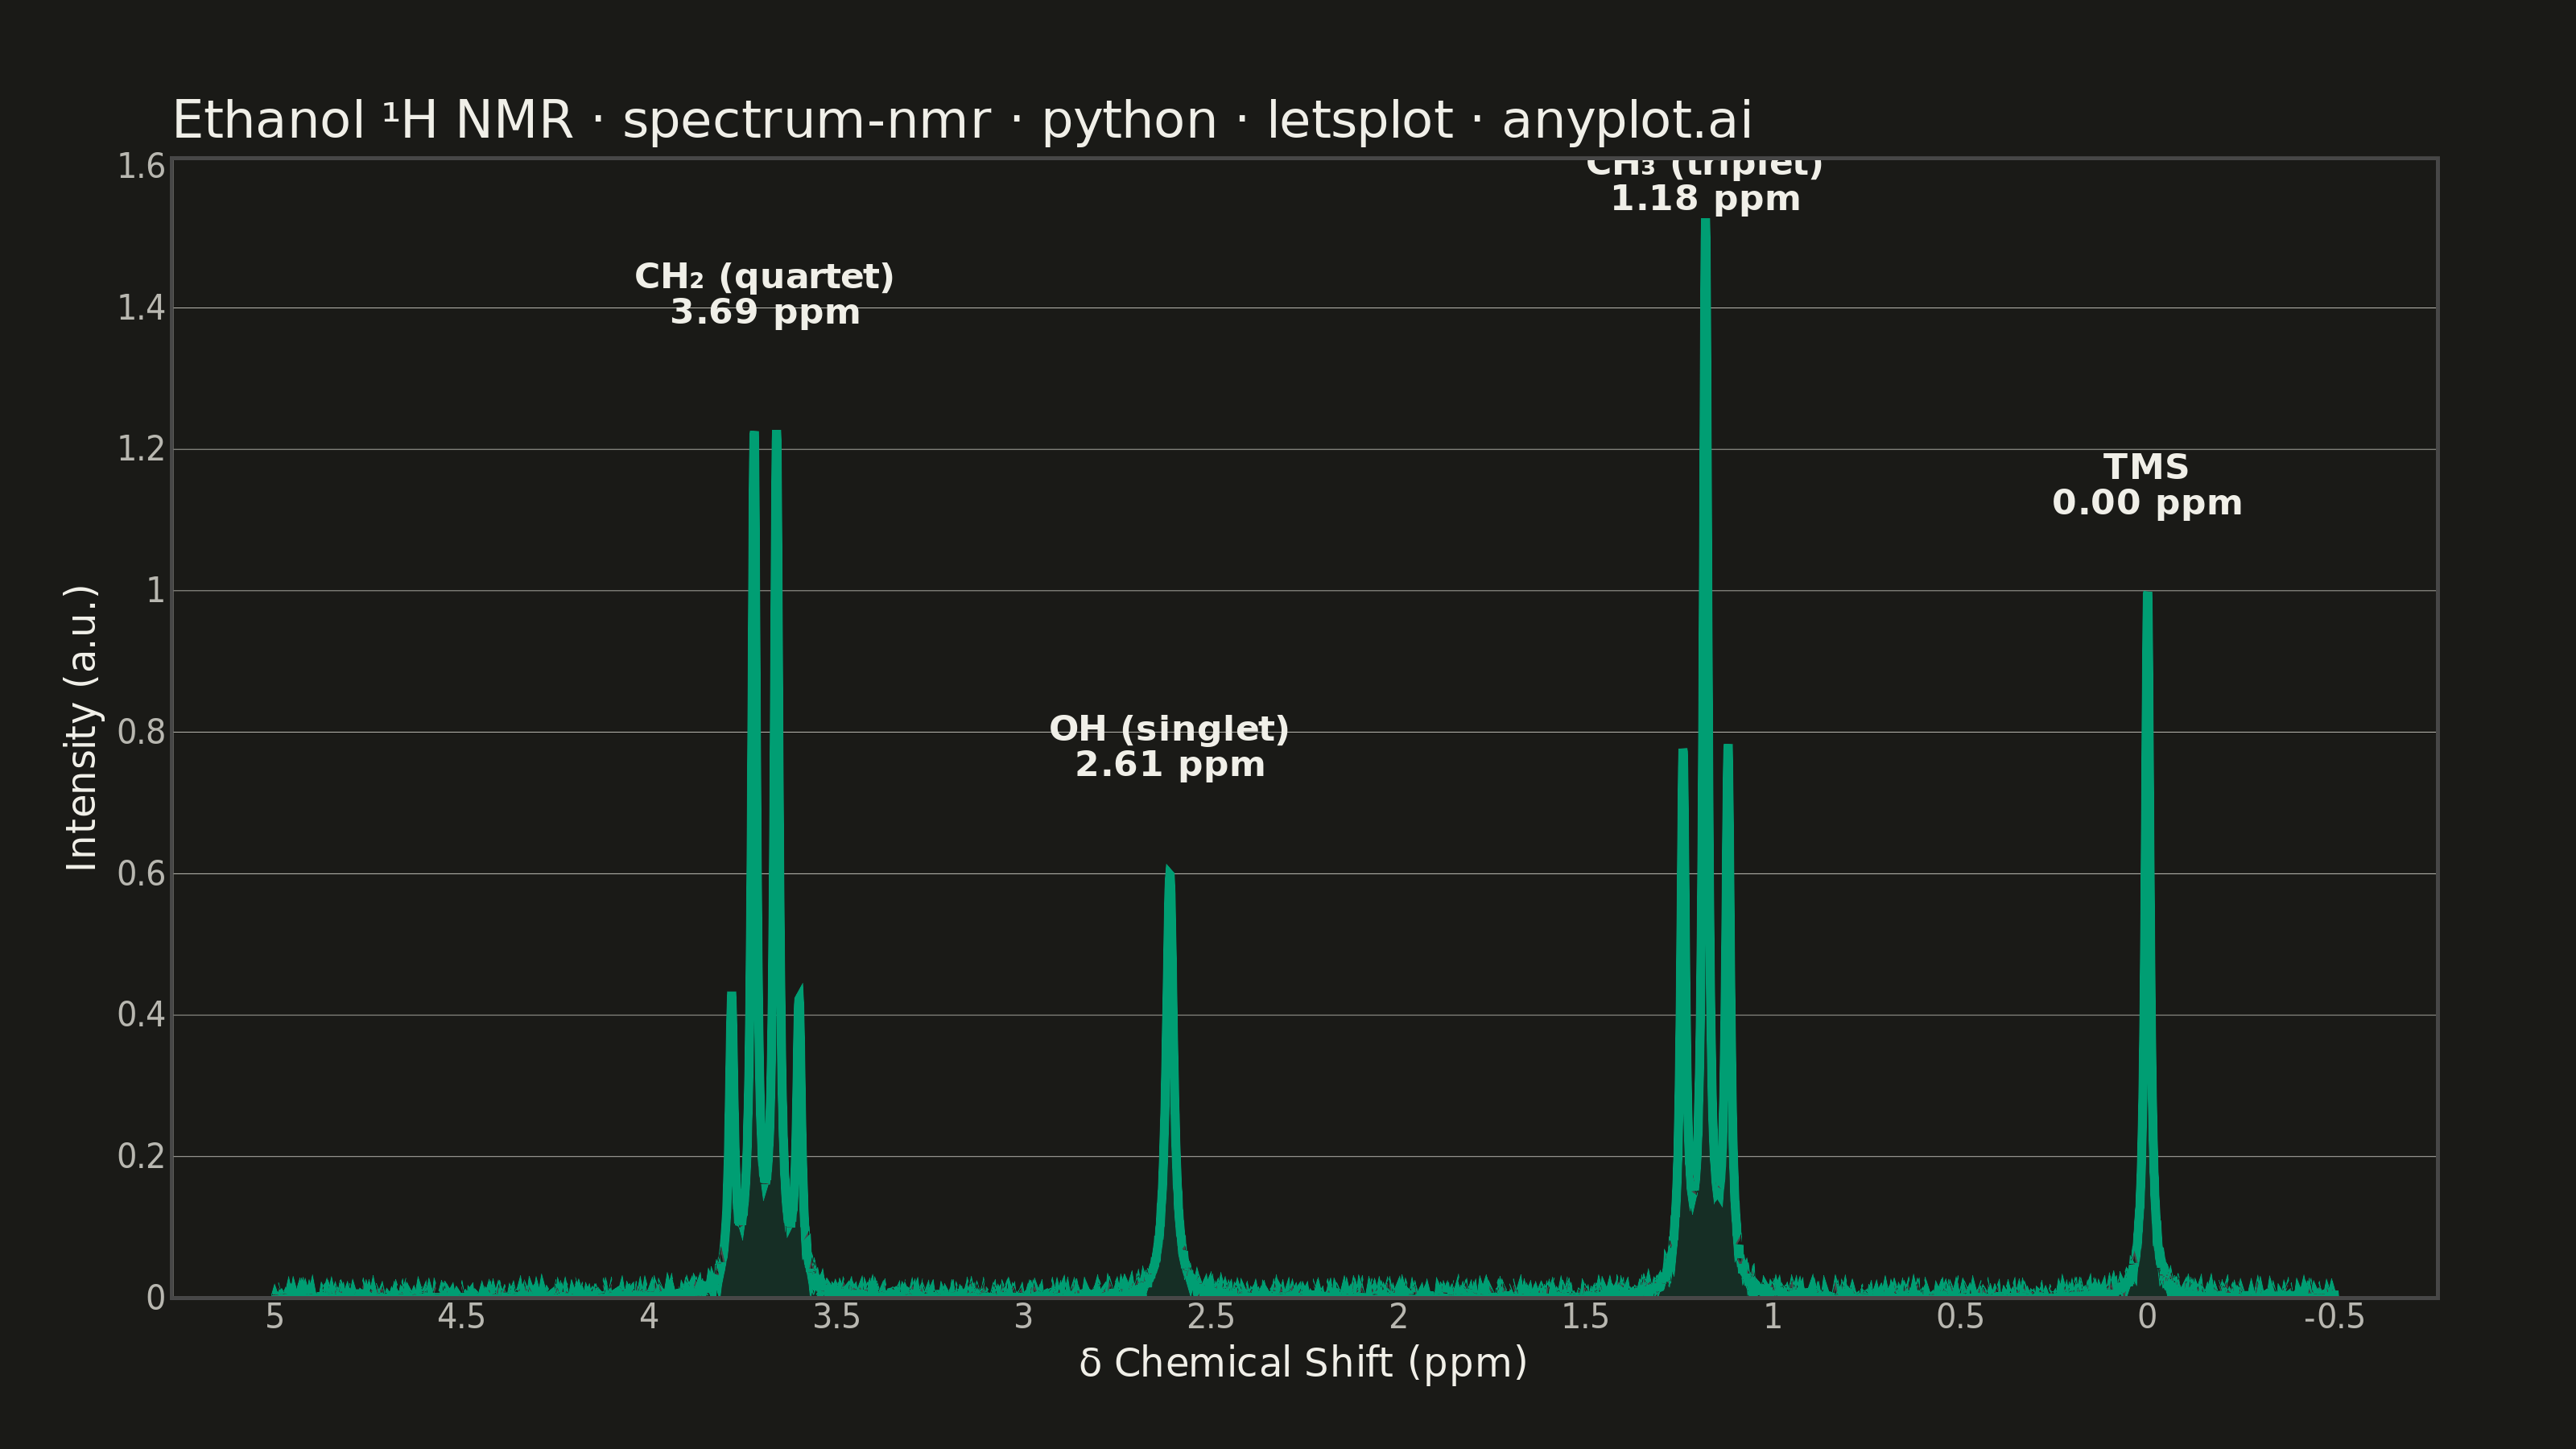
An NMR spectrum plots signal intensity versus chemical shift (in ppm) to reveal the electronic environment of atomic nuclei in a molecule. It is the primary analytical tool in organic chemistry for determining molecular structure, with peak positions indicating functional groups and splitting patterns (multiplets) revealing connectivity between neighboring atoms. The x-axis is conventionally reversed (high ppm on the left) and peaks appear as sharp signals rising from a baseline.
""" anyplot.ai
spectrum-nmr: NMR Spectrum (Nuclear Magnetic Resonance)
Library: letsplot 4.10.1 | Python 3.13.13
Quality: 91/100 | Updated: 2026-06-03
"""

import os

import numpy as np
import pandas as pd
from lets_plot import (
    LetsPlot,
    aes,
    element_blank,
    element_line,
    element_rect,
    element_text,
    geom_area,
    geom_hline,
    geom_line,
    geom_text,
    ggplot,
    ggsize,
    labs,
    layer_tooltips,
    scale_x_reverse,
    scale_y_continuous,
    theme,
    theme_minimal,
)
from lets_plot.export import ggsave


LetsPlot.setup_html()

# Theme tokens (Imprint palette — see prompts/default-style-guide.md)
THEME = os.getenv("ANYPLOT_THEME", "light")
PAGE_BG = "#FAF8F1" if THEME == "light" else "#1A1A17"
INK = "#1A1A17" if THEME == "light" else "#F0EFE8"
INK_SOFT = "#4A4A44" if THEME == "light" else "#B8B7B0"
BRAND = "#009E73"  # Imprint palette position 1 — ALWAYS first series

# Data - Synthetic 1H NMR spectrum of ethanol (CH3CH2OH)
np.random.seed(42)
chemical_shift = np.linspace(5.0, -0.5, 5000)
w = 0.008  # Lorentzian half-width for sharp peaks

# Build spectrum by summing Lorentzian peaks: A * w^2 / ((x - c)^2 + w^2)
intensity = np.zeros_like(chemical_shift)

# TMS reference peak at 0 ppm
intensity += 1.0 * w**2 / ((chemical_shift - 0.0) ** 2 + w**2)

# CH3 triplet near 1.18 ppm (J-coupling = 0.06 ppm, intensity ratio 1:2:1)
j = 0.06
for center, amp in [(1.18 - j, 0.75), (1.18, 1.5), (1.18 + j, 0.75)]:
    intensity += amp * w**2 / ((chemical_shift - center) ** 2 + w**2)

# CH2 quartet near 3.69 ppm (J-coupling = 0.06 ppm, intensity ratio 1:3:3:1)
for center, amp in [(3.69 - 1.5 * j, 0.4), (3.69 - 0.5 * j, 1.2), (3.69 + 0.5 * j, 1.2), (3.69 + 1.5 * j, 0.4)]:
    intensity += amp * w**2 / ((chemical_shift - center) ** 2 + w**2)

# OH singlet near 2.61 ppm (broader due to exchange)
w_oh = 0.012
intensity += 0.6 * w_oh**2 / ((chemical_shift - 2.61) ** 2 + w_oh**2)

# Add subtle baseline noise
intensity += np.random.normal(0, 0.003, len(chemical_shift))
intensity = np.clip(intensity, 0, None)

df = pd.DataFrame({"chemical_shift": chemical_shift, "intensity": intensity})

# Peak labels positioned above each peak group
peak_labels = pd.DataFrame(
    {
        "x": [0.0, 1.18, 2.61, 3.69],
        "y": [1.15, 1.58, 0.78, 1.42],
        "label": ["TMS\n0.00 ppm", "CH₃ (triplet)\n1.18 ppm", "OH (singlet)\n2.61 ppm", "CH₂ (quartet)\n3.69 ppm"],
    }
)

# Interactive tooltips — distinctly lets-plot (not available in plotnine)
spectrum_tooltips = (
    layer_tooltips()
    .format("@{chemical_shift}", ".3f")
    .line("δ: @{chemical_shift} ppm")
    .format("@{intensity}", ".4f")
    .line("Intensity: @{intensity} a.u.")
)

# Plot — geom_area fill gives distinctive spectrum appearance; tooltips add interactive HTML layer
plot = (
    ggplot(df, aes(x="chemical_shift", y="intensity"))
    + geom_hline(yintercept=0, color=INK_SOFT, size=0.5)
    + geom_area(fill=BRAND, alpha=0.15)
    + geom_line(color=BRAND, size=1.2, tooltips=spectrum_tooltips)
    + geom_text(data=peak_labels, mapping=aes(x="x", y="y", label="label"), size=5.5, color=INK, fontface="bold")
    + labs(
        x="δ Chemical Shift (ppm)",
        y="Intensity (a.u.)",
        title="Ethanol ¹H NMR · spectrum-nmr · python · letsplot · anyplot.ai",
    )
    + scale_x_reverse(limits=[-0.5, 5.0])
    + scale_y_continuous(expand=[0.02, 0, 0.20, 0])
    + theme_minimal()
    + theme(
        plot_background=element_rect(fill=PAGE_BG, color=PAGE_BG),
        panel_background=element_rect(fill=PAGE_BG),
        panel_grid_major_x=element_blank(),
        panel_grid_major_y=element_line(color=INK_SOFT, size=0.2),
        panel_grid_minor=element_blank(),
        axis_title=element_text(size=12, color=INK),
        axis_text=element_text(size=10, color=INK_SOFT),
        plot_title=element_text(size=16, color=INK),
        axis_line=element_line(color=INK_SOFT),
        axis_ticks=element_blank(),
        plot_margin=[30, 40, 20, 20],
    )
    + ggsize(800, 450)
)

# Save
ggsave(plot, f"plot-{THEME}.png", path=".", scale=4)
ggsave(plot, f"plot-{THEME}.html", path=".")
Runnable source as JSON, for any HTTP client: https://api.anyplot.ai/specs/spectrum-nmr/letsplot/code. Any spec id and library id listed in llms-full.txt fit the same URL shape; every URL below is complete and callable.
{
  "spec_id": "spectrum-nmr",
  "language": "python",
  "library": "letsplot",
  "page": "https://anyplot.ai/spectrum-nmr/python/letsplot",
  "hub": "https://anyplot.ai/spectrum-nmr",
  "code_json": "https://api.anyplot.ai/specs/spectrum-nmr/letsplot/code",
  "spec_json": "https://api.anyplot.ai/specs/spectrum-nmr",
  "render_light_png": "https://storage.googleapis.com/anyplot-images/plots/spectrum-nmr/python/letsplot/plot-light.png",
  "render_dark_png": "https://storage.googleapis.com/anyplot-images/plots/spectrum-nmr/python/letsplot/plot-dark.png",
  "interactive_light_html": "https://storage.googleapis.com/anyplot-images/plots/spectrum-nmr/python/letsplot/plot-light.html",
  "interactive_dark_html": "https://storage.googleapis.com/anyplot-images/plots/spectrum-nmr/python/letsplot/plot-dark.html",
  "quality_score": 91.0,
  "license": "MIT",
  "guide": "https://anyplot.ai/llms.txt"
}
Part of NMR Spectrum (Nuclear Magnetic Resonance) on anyplot.ai.