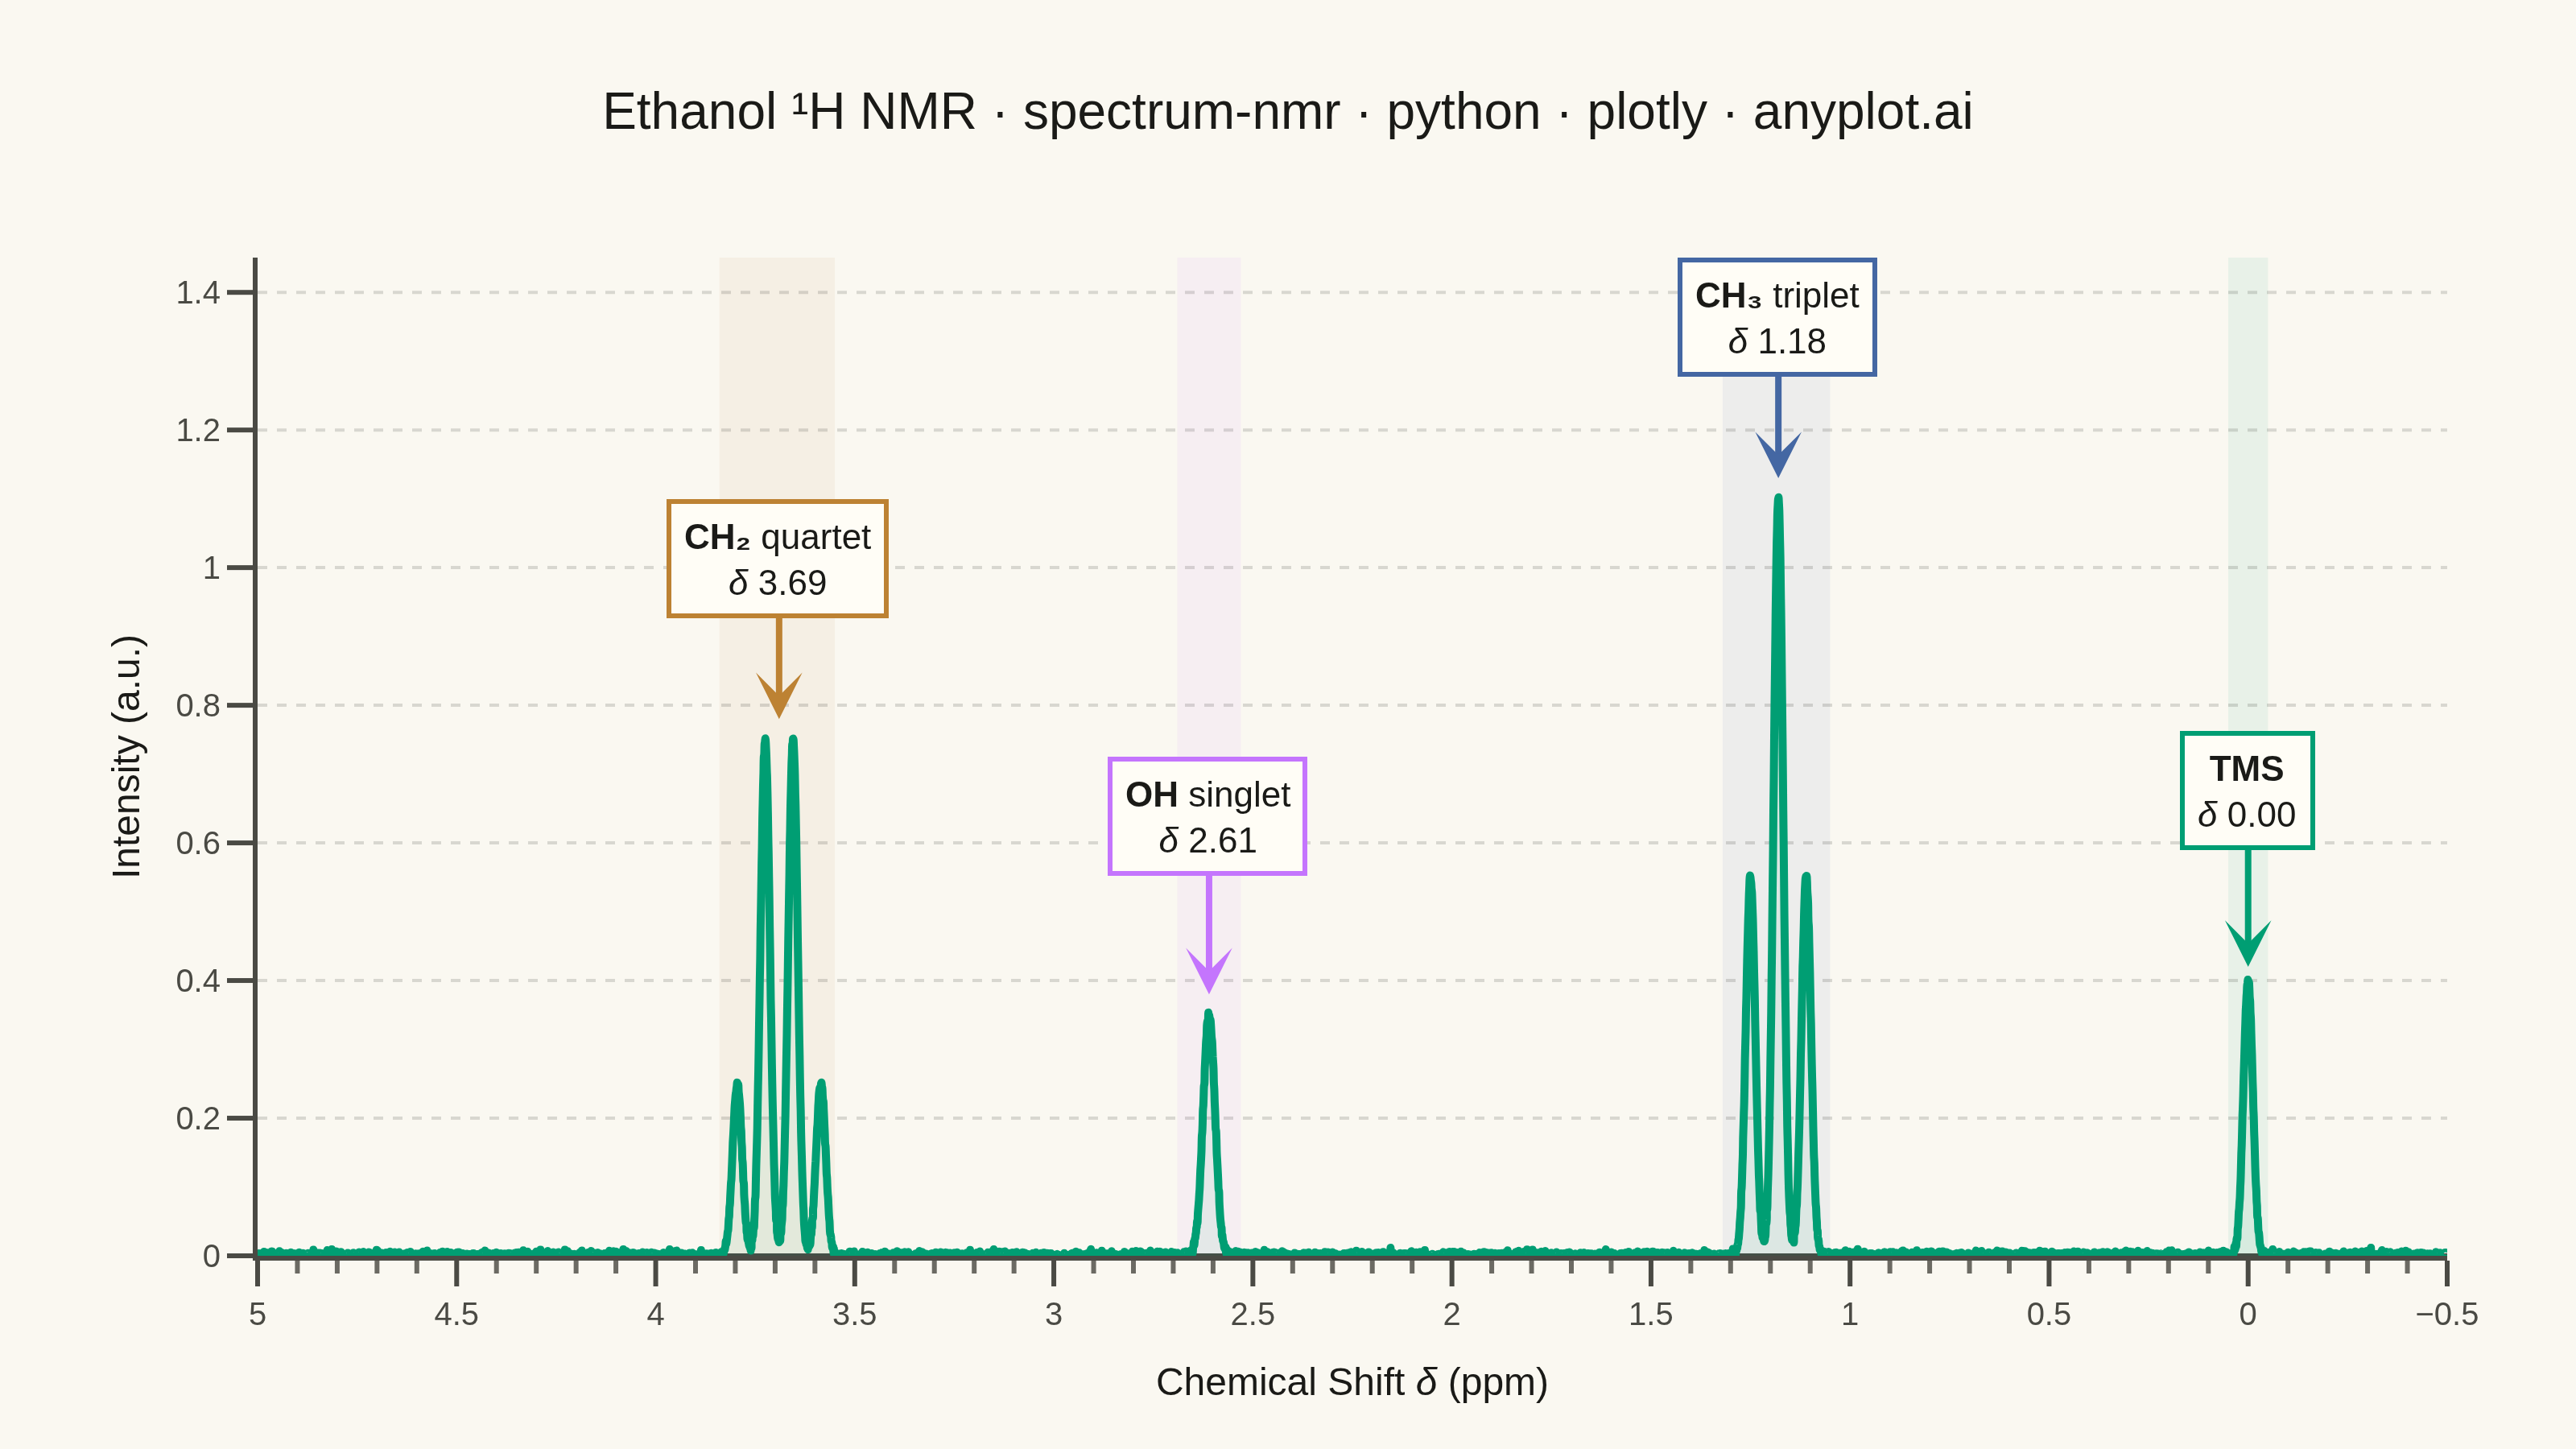
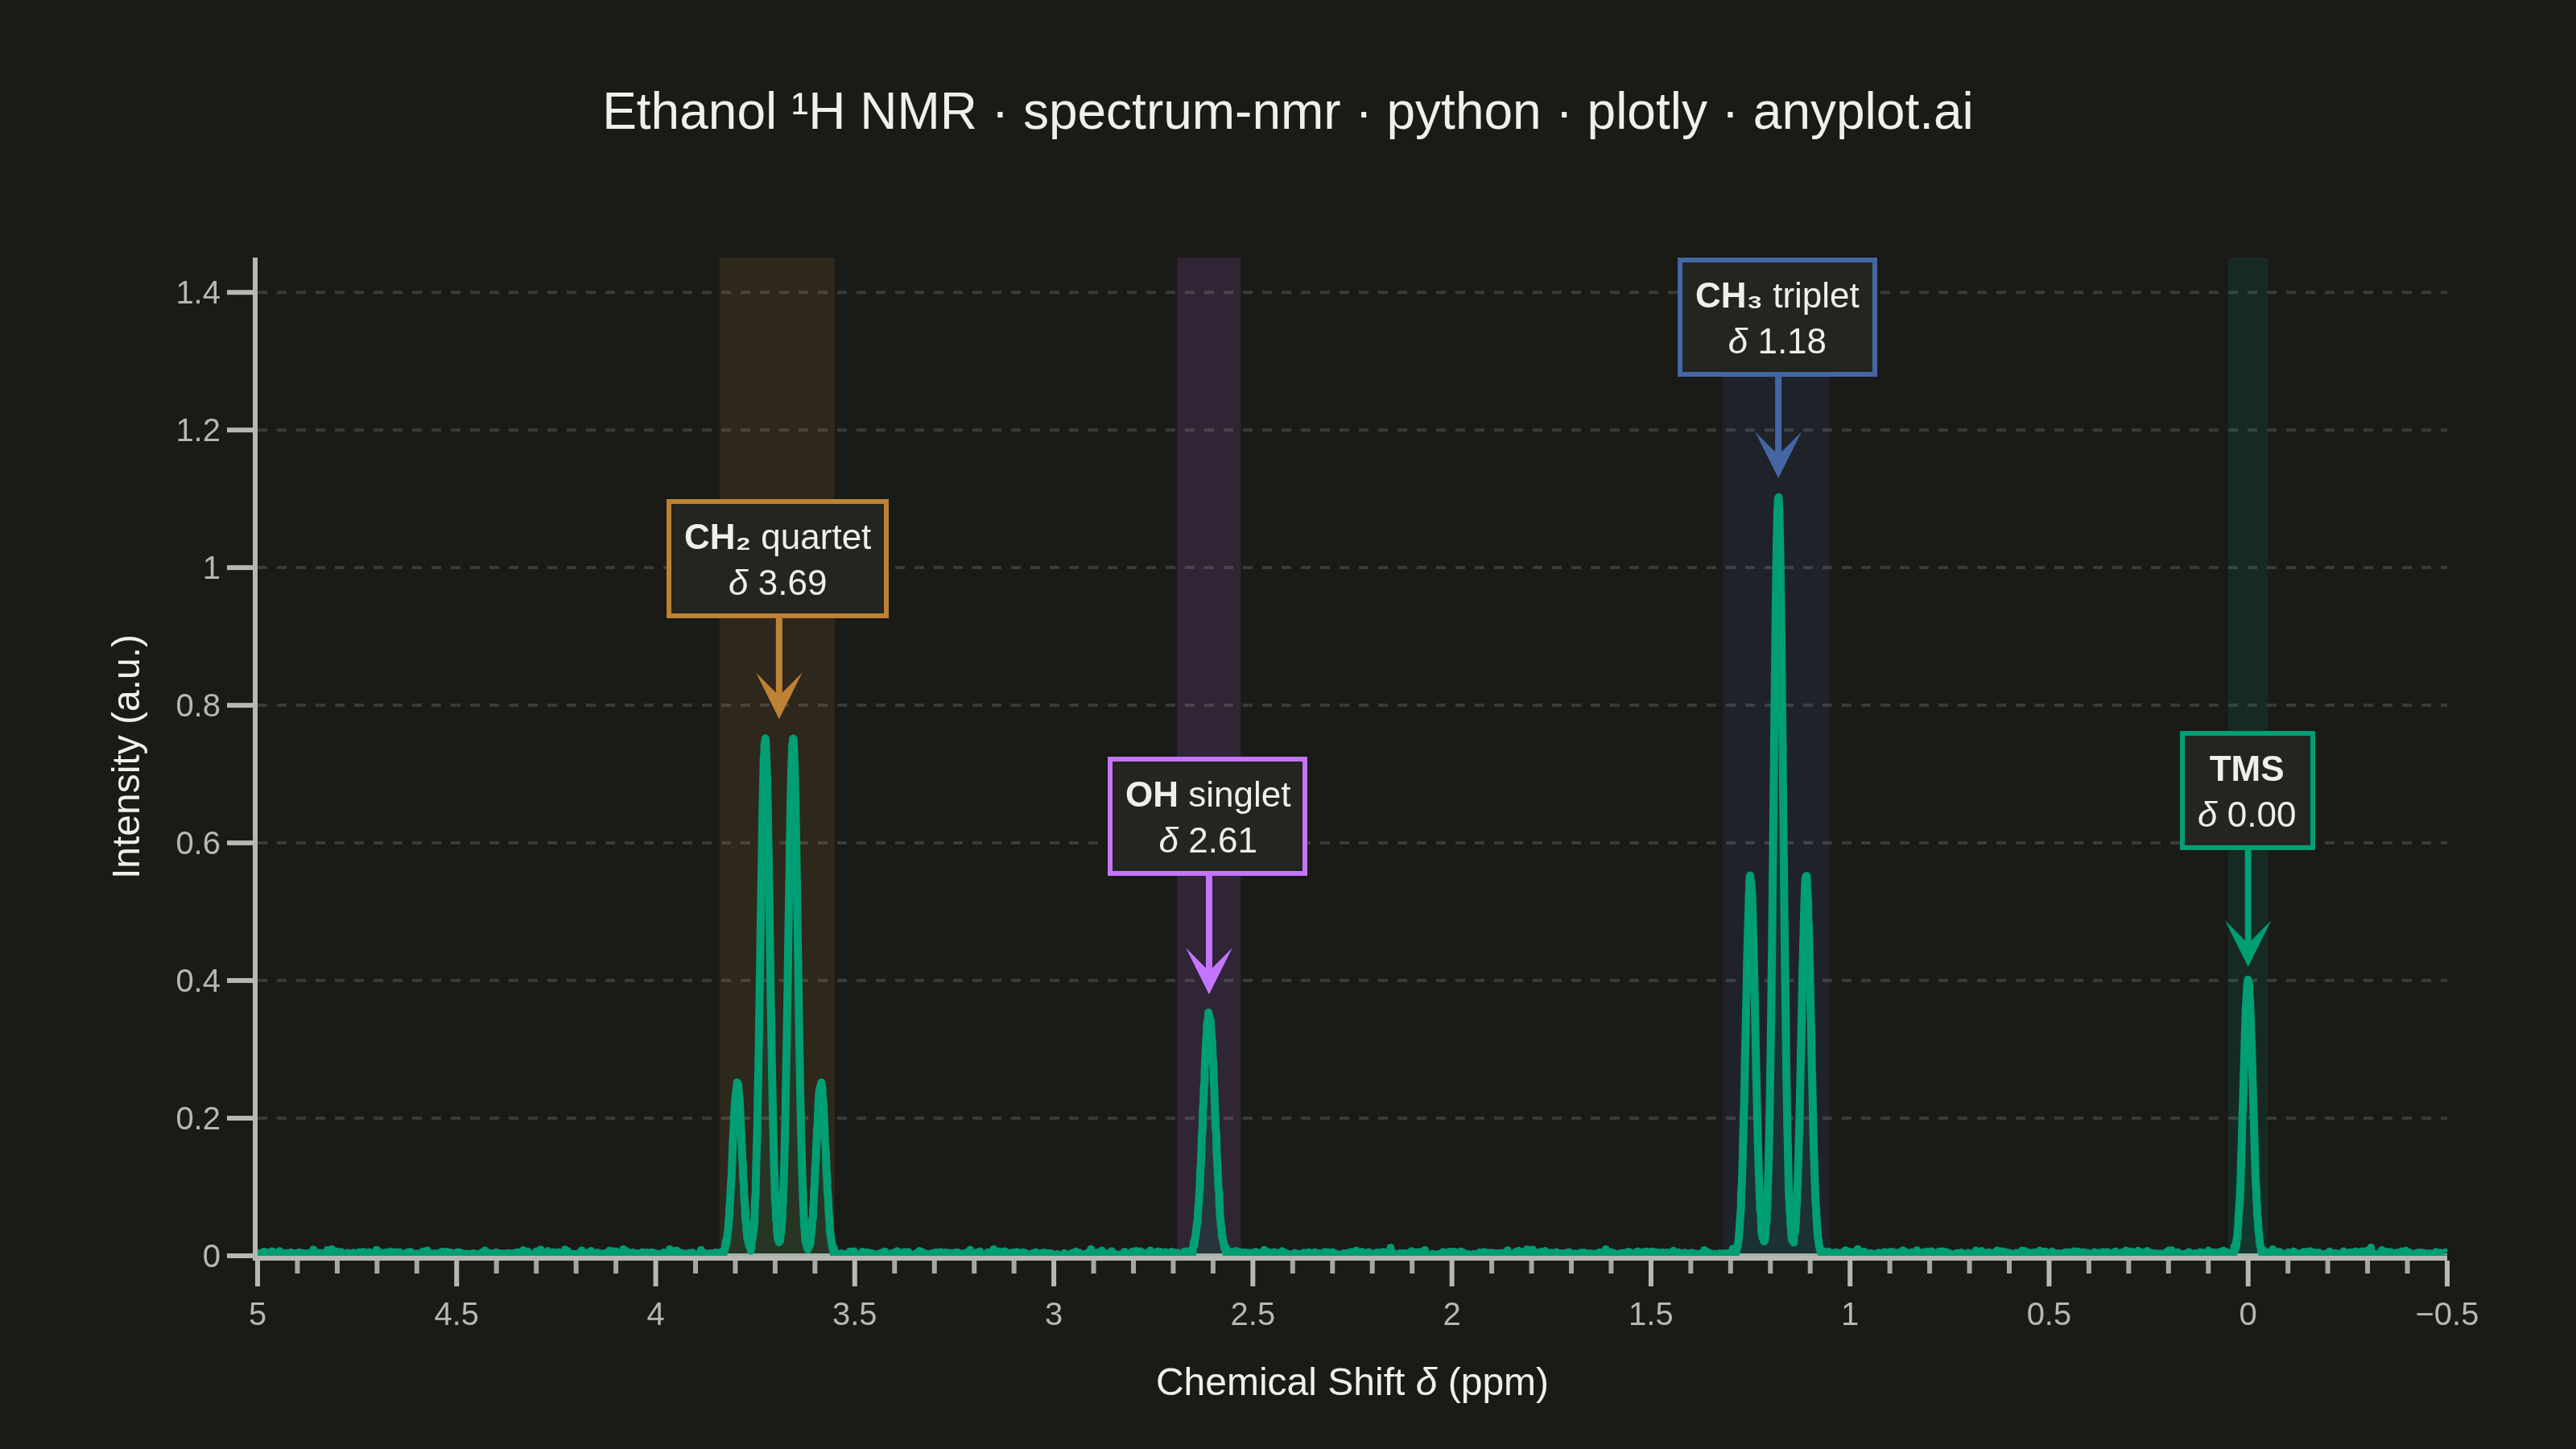
An NMR spectrum plots signal intensity versus chemical shift (in ppm) to reveal the electronic environment of atomic nuclei in a molecule. It is the primary analytical tool in organic chemistry for determining molecular structure, with peak positions indicating functional groups and splitting patterns (multiplets) revealing connectivity between neighboring atoms. The x-axis is conventionally reversed (high ppm on the left) and peaks appear as sharp signals rising from a baseline.
""" anyplot.ai
spectrum-nmr: NMR Spectrum (Nuclear Magnetic Resonance)
Library: plotly 6.7.0 | Python 3.13.13
Quality: 89/100 | Updated: 2026-06-03
"""

import os

import numpy as np
import plotly.graph_objects as go


# Theme tokens
THEME = os.getenv("ANYPLOT_THEME", "light")
PAGE_BG = "#FAF8F1" if THEME == "light" else "#1A1A17"
ELEVATED_BG = "#FFFDF6" if THEME == "light" else "#242420"
INK = "#1A1A17" if THEME == "light" else "#F0EFE8"
INK_SOFT = "#4A4A44" if THEME == "light" else "#B8B7B0"
INK_MUTED = "#6B6A63" if THEME == "light" else "#A8A79F"
GRID = "rgba(26,26,23,0.15)" if THEME == "light" else "rgba(240,239,232,0.15)"

# Imprint palette — first series always #009E73
IMPRINT_PALETTE = ["#009E73", "#C475FD", "#4467A3", "#BD8233", "#AE3030", "#2ABCCD", "#954477", "#99B314"]
BRAND = IMPRINT_PALETTE[0]  # #009E73 — spectrum line

# Data — synthetic 1H NMR spectrum of ethanol
np.random.seed(42)
chemical_shift = np.linspace(-0.5, 5.0, 6000)
w = 0.012  # peak width (standard deviation)

# TMS reference peak at 0 ppm
intensity = 0.4 * np.exp(-((chemical_shift - 0.0) ** 2) / (2 * w**2))

# CH3 triplet near 1.2 ppm (1:2:1 ratio)
intensity += 0.55 * np.exp(-((chemical_shift - 1.11) ** 2) / (2 * w**2))
intensity += 1.10 * np.exp(-((chemical_shift - 1.18) ** 2) / (2 * w**2))
intensity += 0.55 * np.exp(-((chemical_shift - 1.25) ** 2) / (2 * w**2))

# OH singlet near 2.6 ppm
intensity += 0.35 * np.exp(-((chemical_shift - 2.61) ** 2) / (2 * 0.015**2))

# CH2 quartet near 3.7 ppm (1:3:3:1 ratio)
intensity += 0.25 * np.exp(-((chemical_shift - 3.585) ** 2) / (2 * w**2))
intensity += 0.75 * np.exp(-((chemical_shift - 3.655) ** 2) / (2 * w**2))
intensity += 0.75 * np.exp(-((chemical_shift - 3.725) ** 2) / (2 * w**2))
intensity += 0.25 * np.exp(-((chemical_shift - 3.795) ** 2) / (2 * w**2))

# Subtle baseline noise
intensity += np.random.normal(0, 0.003, len(chemical_shift))
intensity = np.clip(intensity, 0, None)

# Imprint palette assignment per peak group
peak_colors = {
    "TMS": IMPRINT_PALETTE[0],  # brand green
    "CH₃": IMPRINT_PALETTE[2],  # blue
    "OH": IMPRINT_PALETTE[1],  # lavender
    "CH₂": IMPRINT_PALETTE[3],  # ochre
}


def hex_to_rgba(hex_color, alpha):
    r = int(hex_color[1:3], 16)
    g = int(hex_color[3:5], 16)
    b = int(hex_color[5:7], 16)
    return f"rgba({r},{g},{b},{alpha})"


# Plot
fig = go.Figure()

# Main spectrum trace — Imprint brand green
fill_alpha = 0.07 if THEME == "light" else 0.12
fig.add_trace(
    go.Scatter(
        x=chemical_shift,
        y=intensity,
        mode="lines",
        line={"color": BRAND, "width": 2.5, "shape": "spline"},
        fill="tozeroy",
        fillcolor=hex_to_rgba(BRAND, fill_alpha),
        hovertemplate="δ %{x:.2f} ppm<br>Intensity: %{y:.3f}<extra></extra>",
        showlegend=False,
    )
)

# Region shadings — Imprint palette, slightly higher opacity on dark for perceptibility
region_alpha = 0.07 if THEME == "light" else 0.13
peak_regions = [
    {"x0": -0.05, "x1": 0.05, "color": peak_colors["TMS"]},
    {"x0": 1.05, "x1": 1.32, "color": peak_colors["CH₃"]},
    {"x0": 2.53, "x1": 2.69, "color": peak_colors["OH"]},
    {"x0": 3.55, "x1": 3.84, "color": peak_colors["CH₂"]},
]
shapes = [
    {
        "type": "rect",
        "xref": "x",
        "yref": "paper",
        "x0": region["x0"],
        "x1": region["x1"],
        "y0": 0,
        "y1": 1,
        "fillcolor": hex_to_rgba(region["color"], region_alpha),
        "line": {"width": 0},
        "layer": "below",
    }
    for region in peak_regions
]

# Annotations — color-coded, theme-adaptive text and backgrounds
annotations_data = [
    {"x": 0.0, "y": 0.42, "text": "<b>TMS</b><br><i>δ</i> 0.00", "key": "TMS", "ay": -55},
    {"x": 1.18, "y": 1.13, "text": "<b>CH₃</b> triplet<br><i>δ</i> 1.18", "key": "CH₃", "ay": -50},
    {"x": 2.61, "y": 0.38, "text": "<b>OH</b> singlet<br><i>δ</i> 2.61", "key": "OH", "ay": -55},
    {"x": 3.69, "y": 0.78, "text": "<b>CH₂</b> quartet<br><i>δ</i> 3.69", "key": "CH₂", "ay": -50},
]
styled_annotations = [
    {
        "x": ann["x"],
        "y": ann["y"],
        "text": ann["text"],
        "showarrow": True,
        "arrowhead": 3,
        "arrowsize": 1.2,
        "arrowwidth": 2,
        "arrowcolor": peak_colors[ann["key"]],
        "font": {"size": 11, "color": INK, "family": "Arial, sans-serif"},
        "ax": 0,
        "ay": ann["ay"],
        "bgcolor": ELEVATED_BG,
        "bordercolor": peak_colors[ann["key"]],
        "borderwidth": 1.5,
        "borderpad": 4,
    }
    for ann in annotations_data
]

# Title — n=60 < 67 baseline, use default 16px
title_text = "Ethanol ¹H NMR · spectrum-nmr · python · plotly · anyplot.ai"

# Layout
fig.update_layout(
    autosize=False,
    paper_bgcolor=PAGE_BG,
    plot_bgcolor=PAGE_BG,
    font={"color": INK, "family": "Arial, sans-serif"},
    title={
        "text": title_text,
        "font": {"size": 16, "color": INK, "family": "Arial, sans-serif"},
        "x": 0.5,
        "xanchor": "center",
    },
    xaxis={
        "title": {"text": "Chemical Shift <i>δ</i> (ppm)", "font": {"size": 12, "color": INK}, "standoff": 12},
        "tickfont": {"size": 10, "color": INK_SOFT},
        "autorange": "reversed",
        "range": [5.0, -0.5],
        "dtick": 0.5,
        "showgrid": False,
        "zeroline": False,
        "showline": True,
        "linecolor": INK_SOFT,
        "linewidth": 1.5,
        "ticks": "outside",
        "ticklen": 8,
        "tickwidth": 1.5,
        "tickcolor": INK_SOFT,
        "minor": {"dtick": 0.1, "ticks": "outside", "ticklen": 4, "tickcolor": INK_MUTED},
        "spikemode": "across",
        "spikethickness": 1,
        "spikecolor": INK_MUTED,
        "spikedash": "dot",
    },
    yaxis={
        "title": {"text": "Intensity (a.u.)", "font": {"size": 12, "color": INK}, "standoff": 8},
        "tickfont": {"size": 10, "color": INK_SOFT},
        "showgrid": True,
        "gridcolor": GRID,
        "gridwidth": 1,
        "griddash": "dot",
        "zeroline": True,
        "zerolinecolor": INK_SOFT,
        "zerolinewidth": 1.5,
        "showline": True,
        "linecolor": INK_SOFT,
        "linewidth": 1.5,
        "ticks": "outside",
        "ticklen": 8,
        "tickwidth": 1.5,
        "tickcolor": INK_SOFT,
        "rangemode": "tozero",
    },
    template=None,
    annotations=styled_annotations,
    shapes=shapes,
    showlegend=False,
    margin={"l": 80, "r": 40, "t": 80, "b": 60},
    hoverlabel={"bgcolor": ELEVATED_BG, "bordercolor": BRAND, "font": {"size": 11, "color": INK}},
    hovermode="x unified",
)

# Save — landscape 3200×1800
fig.write_image(f"plot-{THEME}.png", width=800, height=450, scale=4)
fig.write_html(f"plot-{THEME}.html", include_plotlyjs="cdn")
Runnable source as JSON, for any HTTP client: https://api.anyplot.ai/specs/spectrum-nmr/plotly/code. Any spec id and library id listed in llms-full.txt fit the same URL shape; every URL below is complete and callable.
{
  "spec_id": "spectrum-nmr",
  "language": "python",
  "library": "plotly",
  "page": "https://anyplot.ai/spectrum-nmr/python/plotly",
  "hub": "https://anyplot.ai/spectrum-nmr",
  "code_json": "https://api.anyplot.ai/specs/spectrum-nmr/plotly/code",
  "spec_json": "https://api.anyplot.ai/specs/spectrum-nmr",
  "render_light_png": "https://storage.googleapis.com/anyplot-images/plots/spectrum-nmr/python/plotly/plot-light.png",
  "render_dark_png": "https://storage.googleapis.com/anyplot-images/plots/spectrum-nmr/python/plotly/plot-dark.png",
  "interactive_light_html": "https://storage.googleapis.com/anyplot-images/plots/spectrum-nmr/python/plotly/plot-light.html",
  "interactive_dark_html": "https://storage.googleapis.com/anyplot-images/plots/spectrum-nmr/python/plotly/plot-dark.html",
  "quality_score": 89.0,
  "license": "MIT",
  "guide": "https://anyplot.ai/llms.txt"
}
Part of NMR Spectrum (Nuclear Magnetic Resonance) on anyplot.ai.