The same plot in 14 other libraries — JavaScript: Chart.js, D3.js, Apache ECharts, Highcharts; Python: Altair, Bokeh, lets-plot, Matplotlib, Plotly, plotnine, Pygal, Seaborn; R: ggplot2; Julia: Makie.jl. Compare all 15 side by side: NMR Spectrum (Nuclear Magnetic Resonance) in Python, R, Julia and JavaScript.
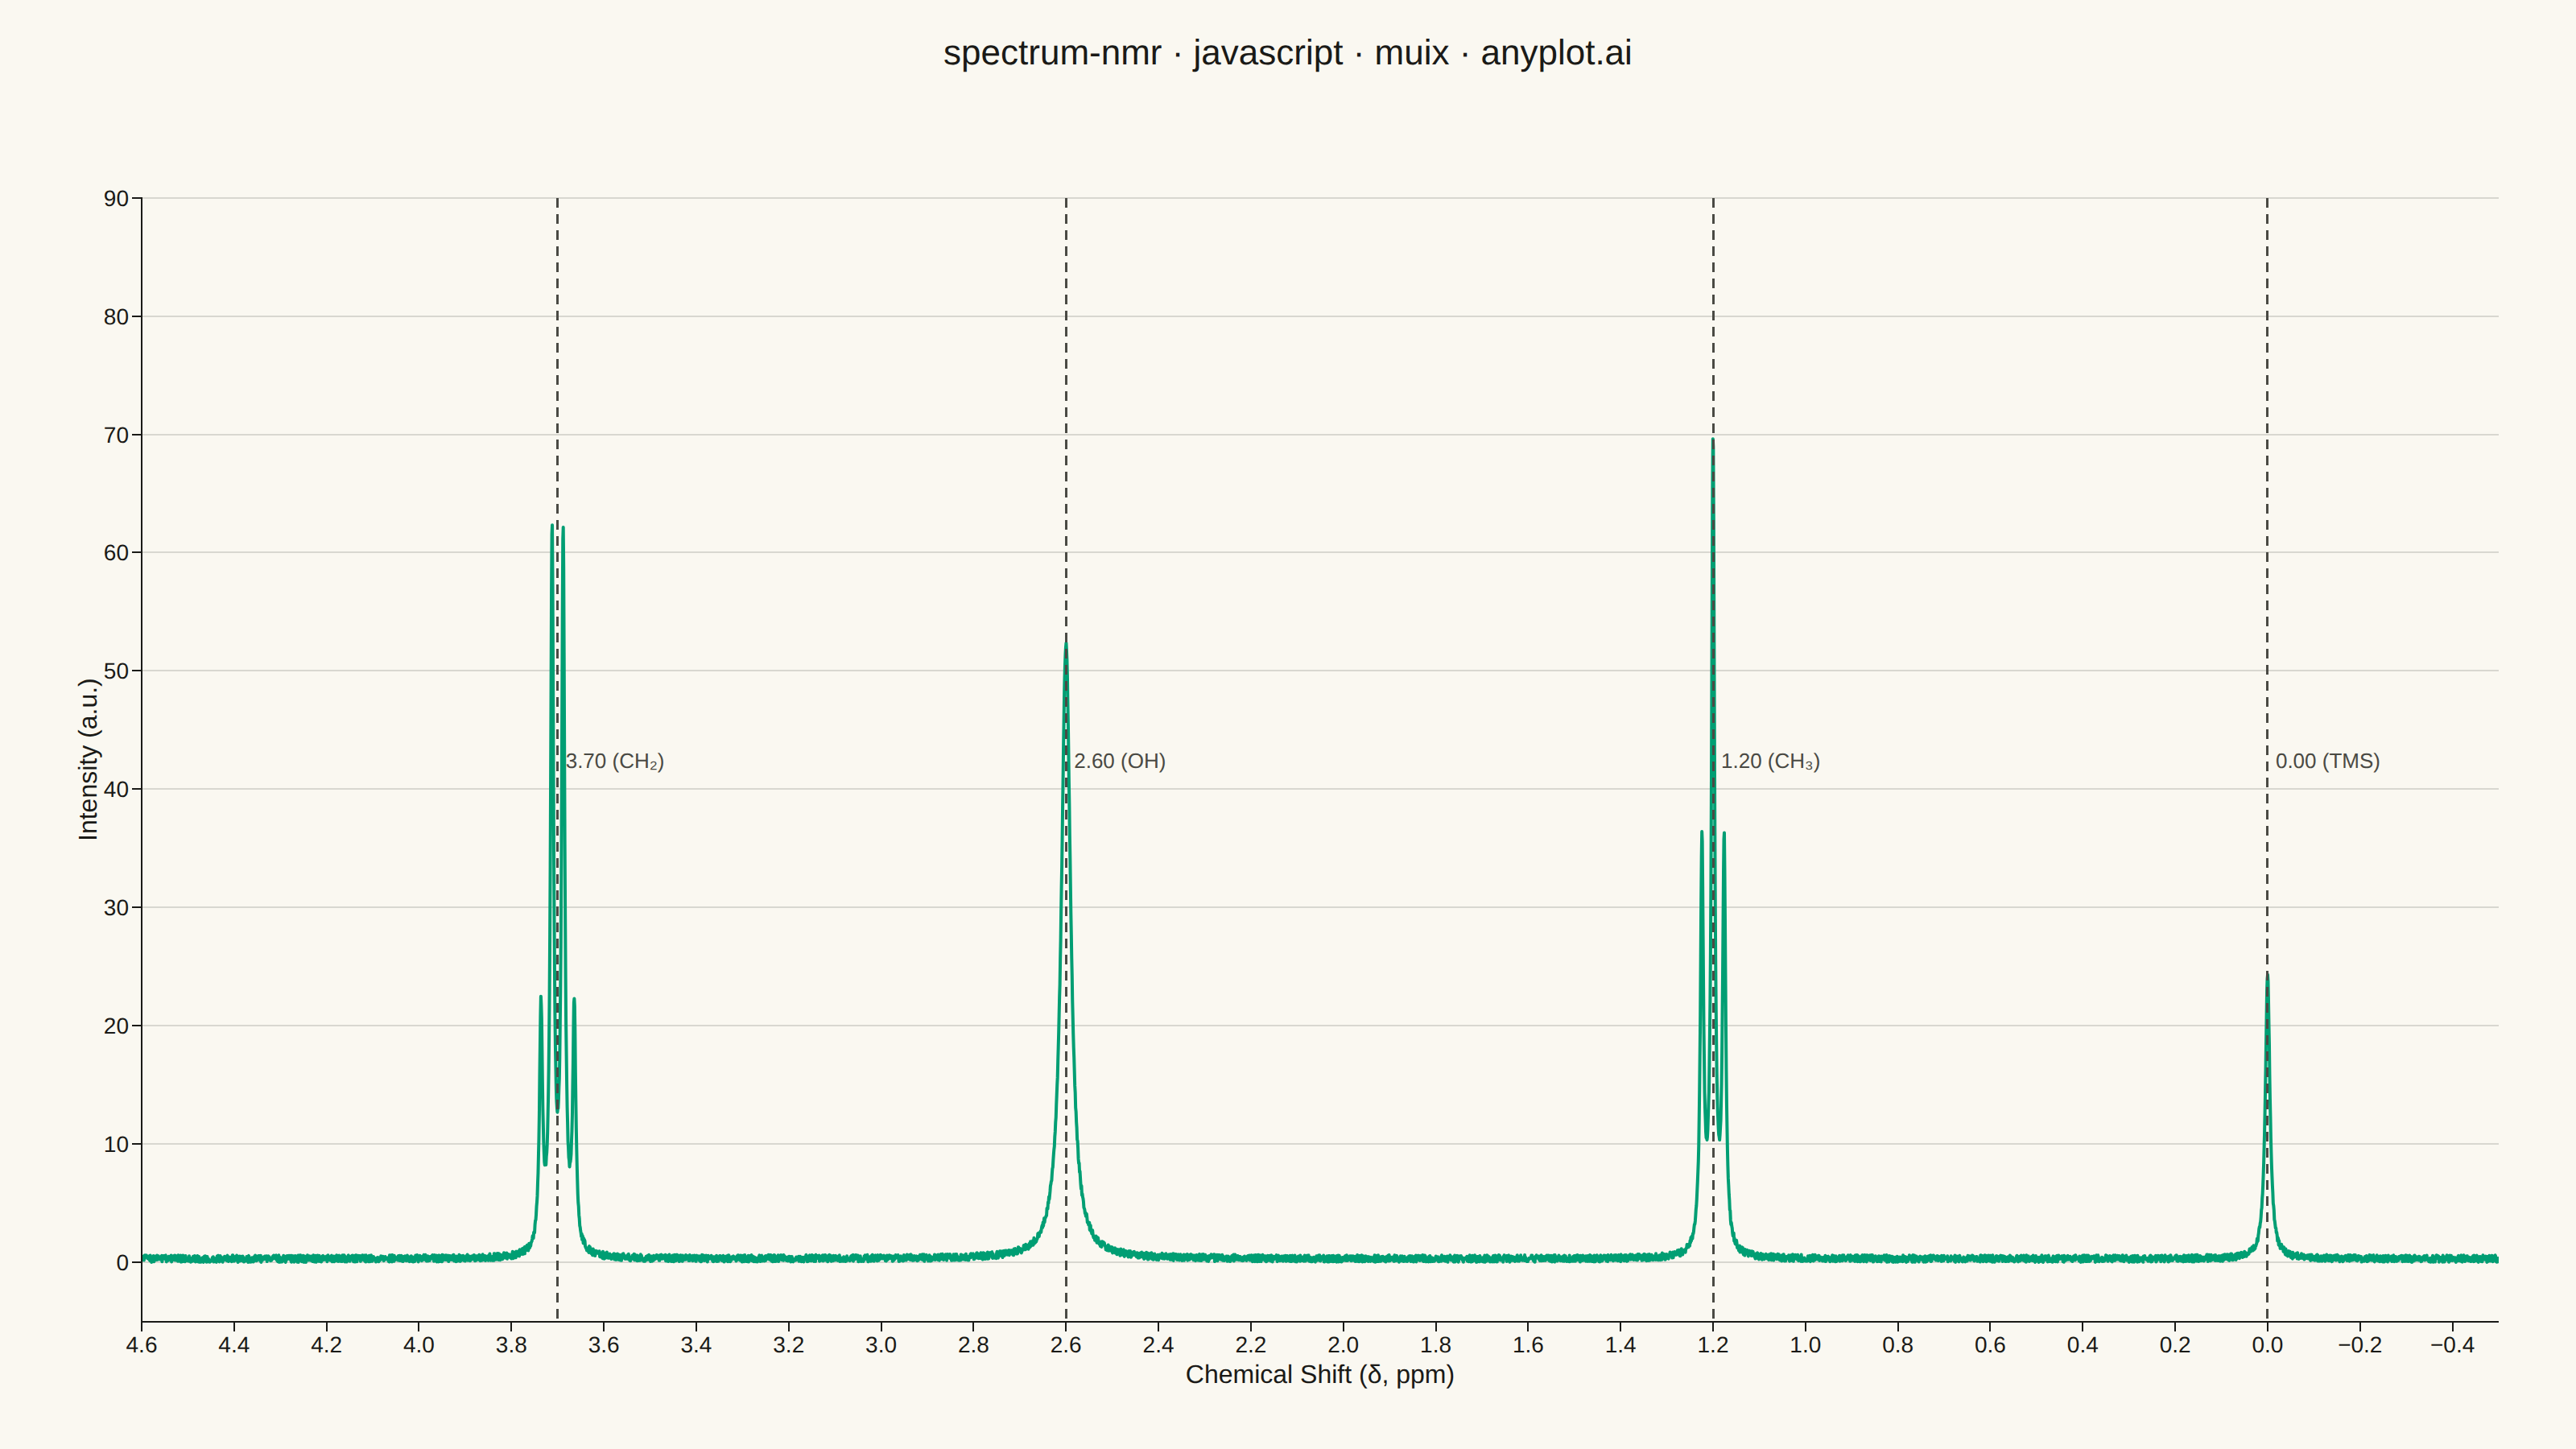
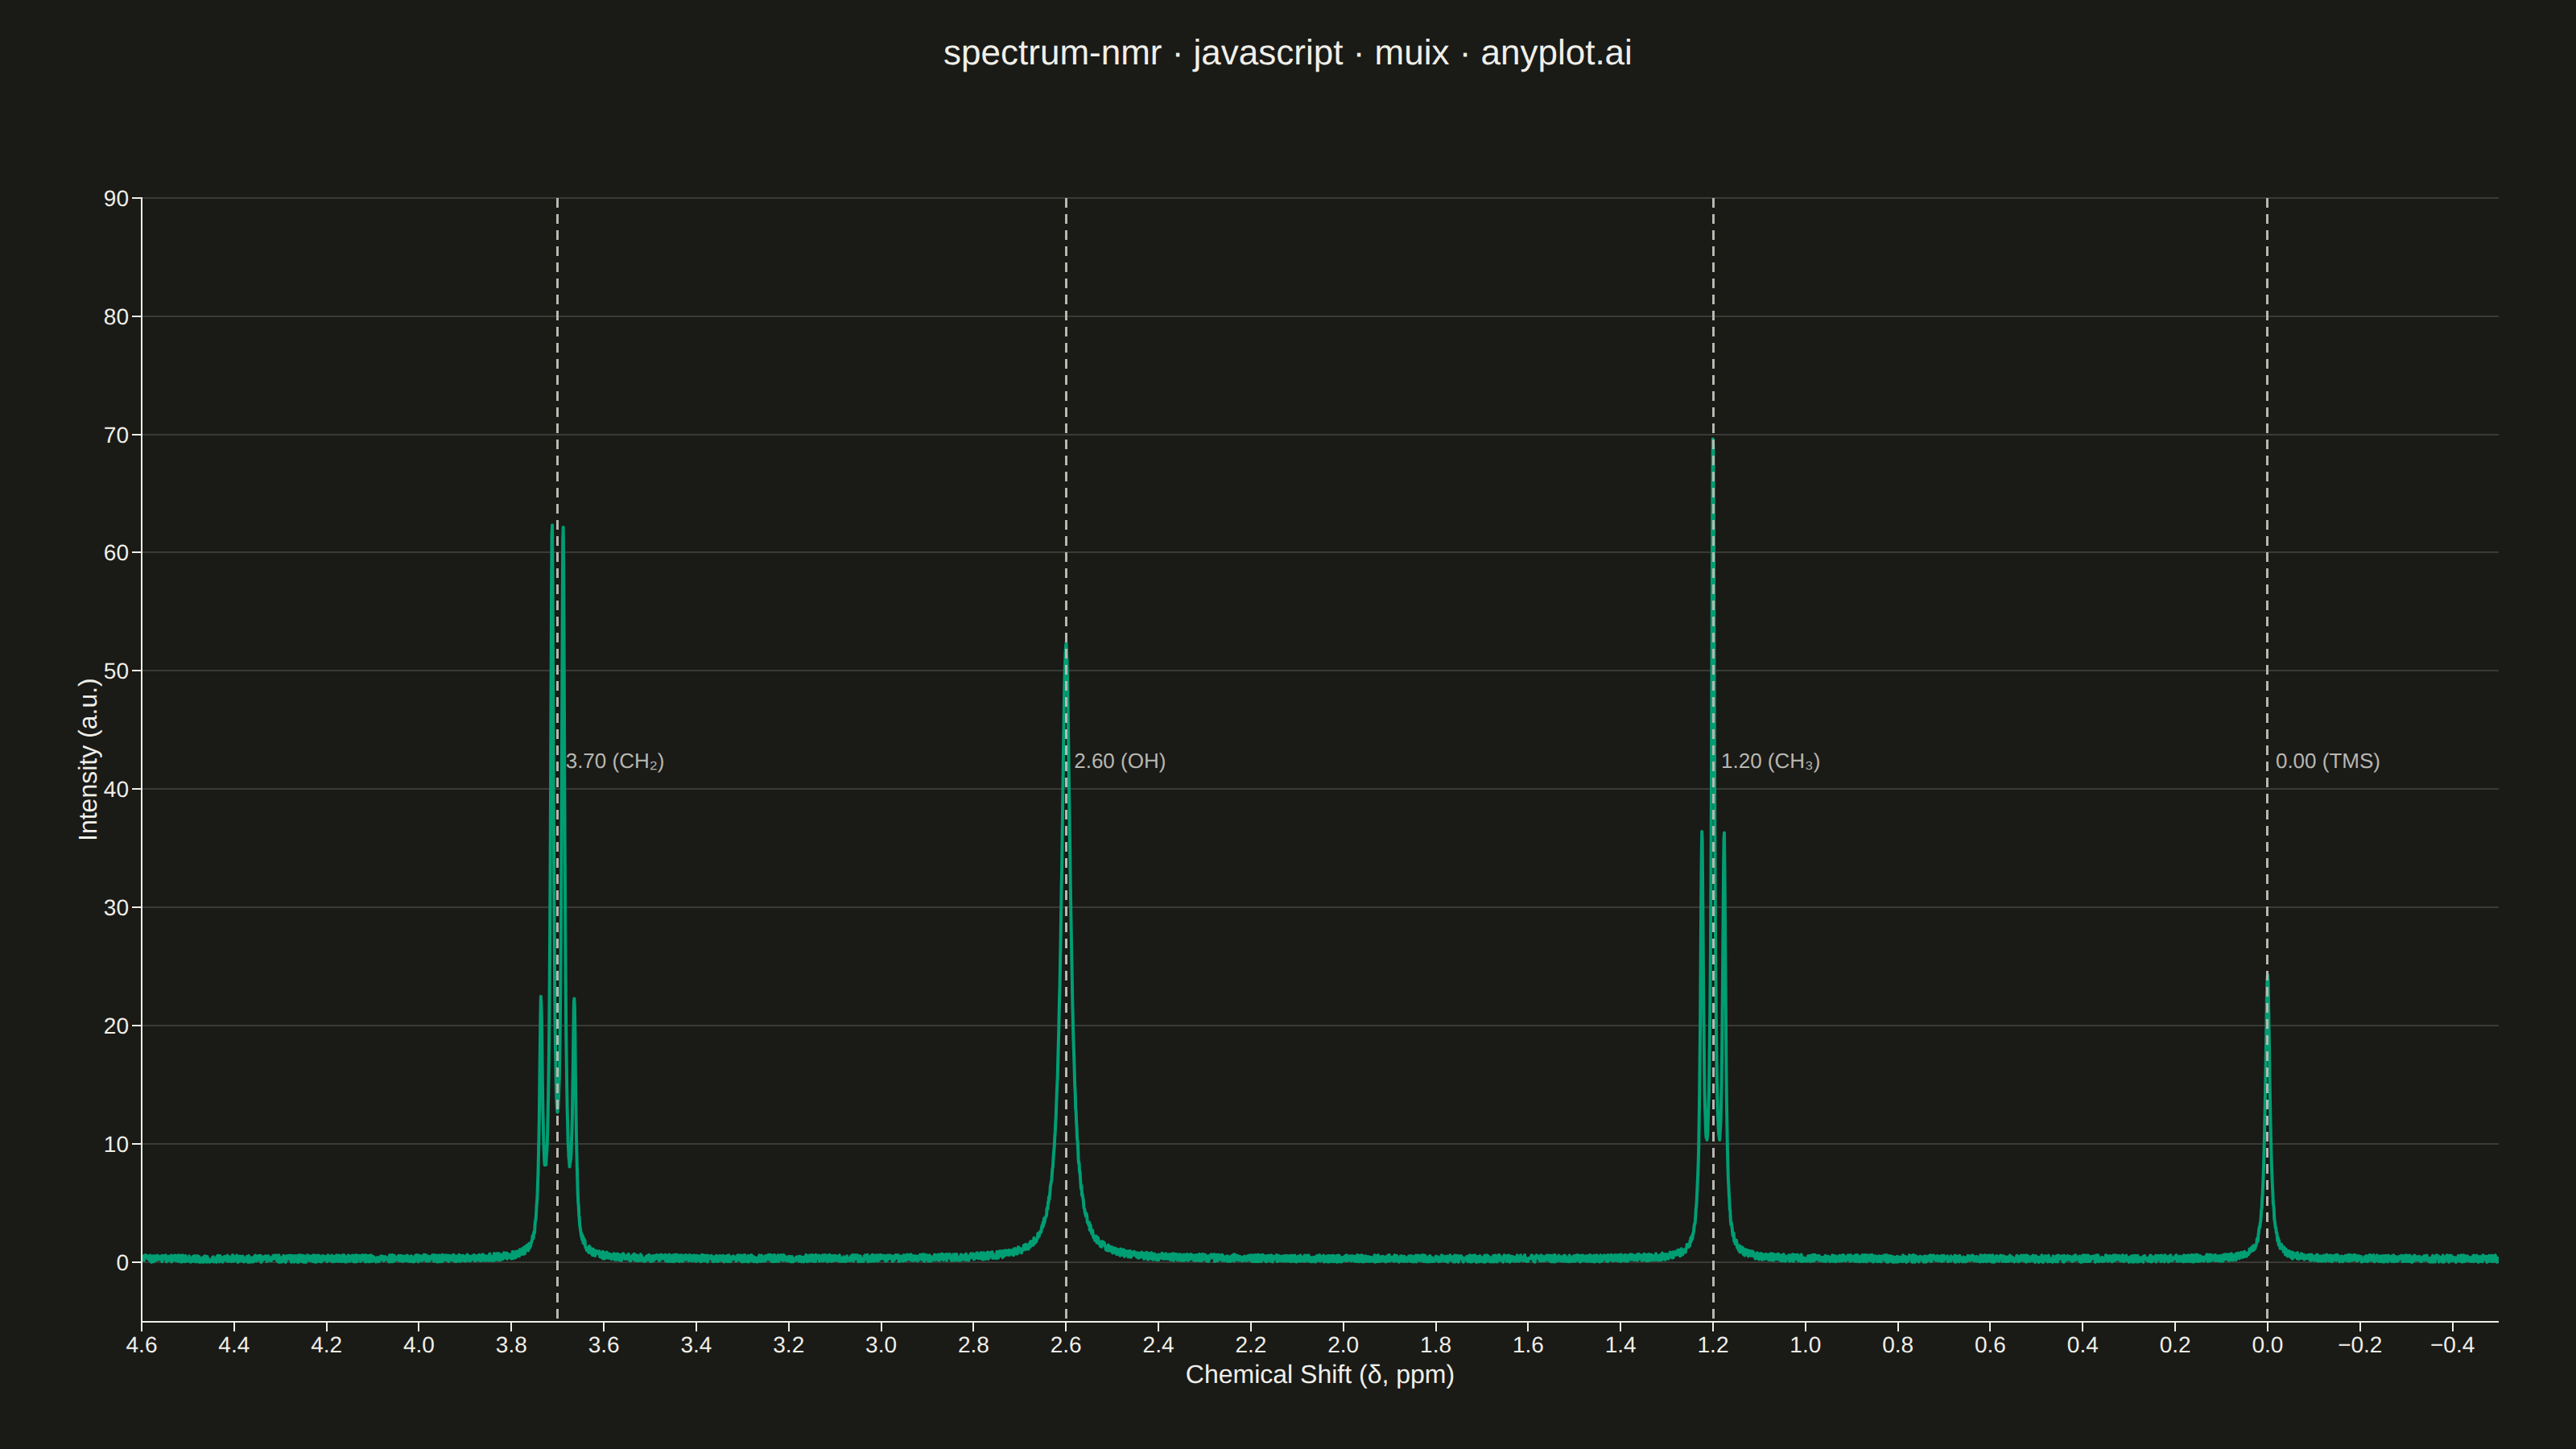
An NMR spectrum plots signal intensity versus chemical shift (in ppm) to reveal the electronic environment of atomic nuclei in a molecule. It is the primary analytical tool in organic chemistry for determining molecular structure, with peak positions indicating functional groups and splitting patterns (multiplets) revealing connectivity between neighboring atoms. The x-axis is conventionally reversed (high ppm on the left) and peaks appear as sharp signals rising from a baseline.
// anyplot.ai
// spectrum-nmr: NMR Spectrum (Nuclear Magnetic Resonance)
// Library: muix 7.29.1 | JavaScript 22.23.2
// Quality: 85/100 | Created: 2026-08-24
//# anyplot-orientation: landscape
// anyplot.ai
// spectrum-nmr: NMR Spectrum (Nuclear Magnetic Resonance)
// Library: MUI X Charts | React | Node 22
// License: @mui/x-charts — MIT (community). Pro/Premium are out of scope.
// Quality: pending | Created: 2026-08-24
import { LineChart } from "@mui/x-charts/LineChart";
import { ChartsReferenceLine } from "@mui/x-charts/ChartsReferenceLine";
import Box from "@mui/material/Box";
import Typography from "@mui/material/Typography";

const t = window.ANYPLOT_TOKENS;

const TITLE_HEIGHT = 60;

// Deterministic LCG (seed 42) — no Math.random() in the browser harness
let seed = 42;
function rng() {
  seed = (1664525 * seed + 1013904223) >>> 0;
  return seed / 4294967296;
}

// --- Data: synthetic 1H NMR spectrum of ethanol (CH3-CH2-OH) ---------------
const PPM_MIN = -0.5;
const PPM_MAX = 4.6;
const POINT_COUNT = 6000;
const step = (PPM_MAX - PPM_MIN) / (POINT_COUNT - 1);
const chemicalShift = Array.from({ length: POINT_COUNT }, (_, i) => PPM_MIN + i * step);
const intensity = chemicalShift.map(() => rng() * 0.6); // clean baseline, minimal noise

function addLorentzian(center, halfWidth, peakHeight) {
  chemicalShift.forEach((shift, i) => {
    const z = (shift - center) / halfWidth;
    intensity[i] += peakHeight / (1 + z * z);
  });
}

function addMultiplet(center, splitting, relativeWeights, halfWidth, unitHeight) {
  const n = relativeWeights.length;
  relativeWeights.forEach((weight, i) => {
    const lineCenter = center + (i - (n - 1) / 2) * splitting;
    addLorentzian(lineCenter, halfWidth, unitHeight * weight);
  });
}

// TMS internal standard — singlet reference at 0 ppm
addMultiplet(0.0, 0, [1], 0.006, 24);
// CH3 — triplet (coupled to adjacent CH2); narrow lines with wide spacing so
// the 1:2:1 pattern resolves into three distinct peaks, not one blob
addMultiplet(1.2, 0.024, [1, 2, 1], 0.004, 34);
// OH — singlet, slightly broadened by proton exchange
addMultiplet(2.6, 0, [1], 0.012, 52);
// CH2 — quartet (coupled to adjacent CH3); narrow lines with wide spacing so
// the 1:3:3:1 pattern resolves into four distinct peaks, not one blob
addMultiplet(3.7, 0.024, [1, 3, 3, 1], 0.004, 20);

const PEAK_LABELS = [
  { shift: 0.0, label: "0.00 (TMS)" },
  { shift: 1.2, label: "1.20 (CH₃)" },
  { shift: 2.6, label: "2.60 (OH)" },
  { shift: 3.7, label: "3.70 (CH₂)" },
];

// --- Chart (default-exported component — the harness mounts it) -----------
export default function Chart() {
  const { width, height } = window.ANYPLOT_SIZE;

  return (
    <Box sx={{ width, height, display: "flex", flexDirection: "column", paddingTop: "20px" }}>
      <Typography
        sx={{ color: t.ink, fontSize: 22, fontWeight: 500, textAlign: "center", lineHeight: 1.2 }}
      >
        spectrum-nmr · javascript · muix · anyplot.ai
      </Typography>
      <LineChart
        width={width}
        height={height - TITLE_HEIGHT}
        margin={{ top: 70, right: 48, bottom: 72, left: 88 }}
        xAxis={[
          {
            data: chemicalShift,
            scaleType: "linear",
            reverse: true,
            min: PPM_MIN,
            max: PPM_MAX,
            label: "Chemical Shift (δ, ppm)",
            tickLabelStyle: { fontSize: 14 },
            labelStyle: { fontSize: 16 },
          },
        ]}
        yAxis={[
          {
            min: -5,
            max: 90,
            label: "Intensity (a.u.)",
            tickLabelStyle: { fontSize: 14 },
            labelStyle: { fontSize: 16 },
          },
        ]}
        series={[
          {
            data: intensity,
            curve: "linear",
            showMark: false,
            color: t.palette[0],
            label: "1H NMR",
          },
        ]}
        grid={{ horizontal: true, vertical: false }}
        slotProps={{ legend: { hidden: true } }}
        skipAnimation
      >
        {PEAK_LABELS.map(({ shift, label }) => (
          <ChartsReferenceLine
            key={label}
            x={shift}
            label={label}
            labelStyle={{ fontSize: 13, fill: t.inkSoft }}
            lineStyle={{ stroke: t.inkSoft, strokeDasharray: "6 4", strokeWidth: 1.5 }}
          />
        ))}
      </LineChart>
    </Box>
  );
}
Runnable source as JSON, for any HTTP client: https://api.anyplot.ai/specs/spectrum-nmr/muix/code. Any spec id and library id listed in llms-full.txt fit the same URL shape; every URL below is complete and callable.
{
  "spec_id": "spectrum-nmr",
  "language": "javascript",
  "library": "muix",
  "page": "https://anyplot.ai/spectrum-nmr/javascript/muix",
  "hub": "https://anyplot.ai/spectrum-nmr",
  "code_json": "https://api.anyplot.ai/specs/spectrum-nmr/muix/code",
  "spec_json": "https://api.anyplot.ai/specs/spectrum-nmr",
  "render_light_png": "https://storage.googleapis.com/anyplot-images/plots/spectrum-nmr/javascript/muix/plot-light.png",
  "render_dark_png": "https://storage.googleapis.com/anyplot-images/plots/spectrum-nmr/javascript/muix/plot-dark.png",
  "interactive_light_html": "https://storage.googleapis.com/anyplot-images/plots/spectrum-nmr/javascript/muix/plot-light.html",
  "interactive_dark_html": "https://storage.googleapis.com/anyplot-images/plots/spectrum-nmr/javascript/muix/plot-dark.html",
  "quality_score": 85.0,
  "license": "MIT",
  "guide": "https://anyplot.ai/llms.txt"
}
Part of NMR Spectrum (Nuclear Magnetic Resonance) on anyplot.ai.