The same plot in 13 other libraries — JavaScript: D3.js, Apache ECharts, MUI X Charts; Python: Altair, Bokeh, lets-plot, Matplotlib, Plotly, plotnine, Pygal, Seaborn; R: ggplot2; Julia: Makie.jl. Compare all 14 side by side: 3D Bar Chart for Categorical Comparison in Python, R, Julia and JavaScript.
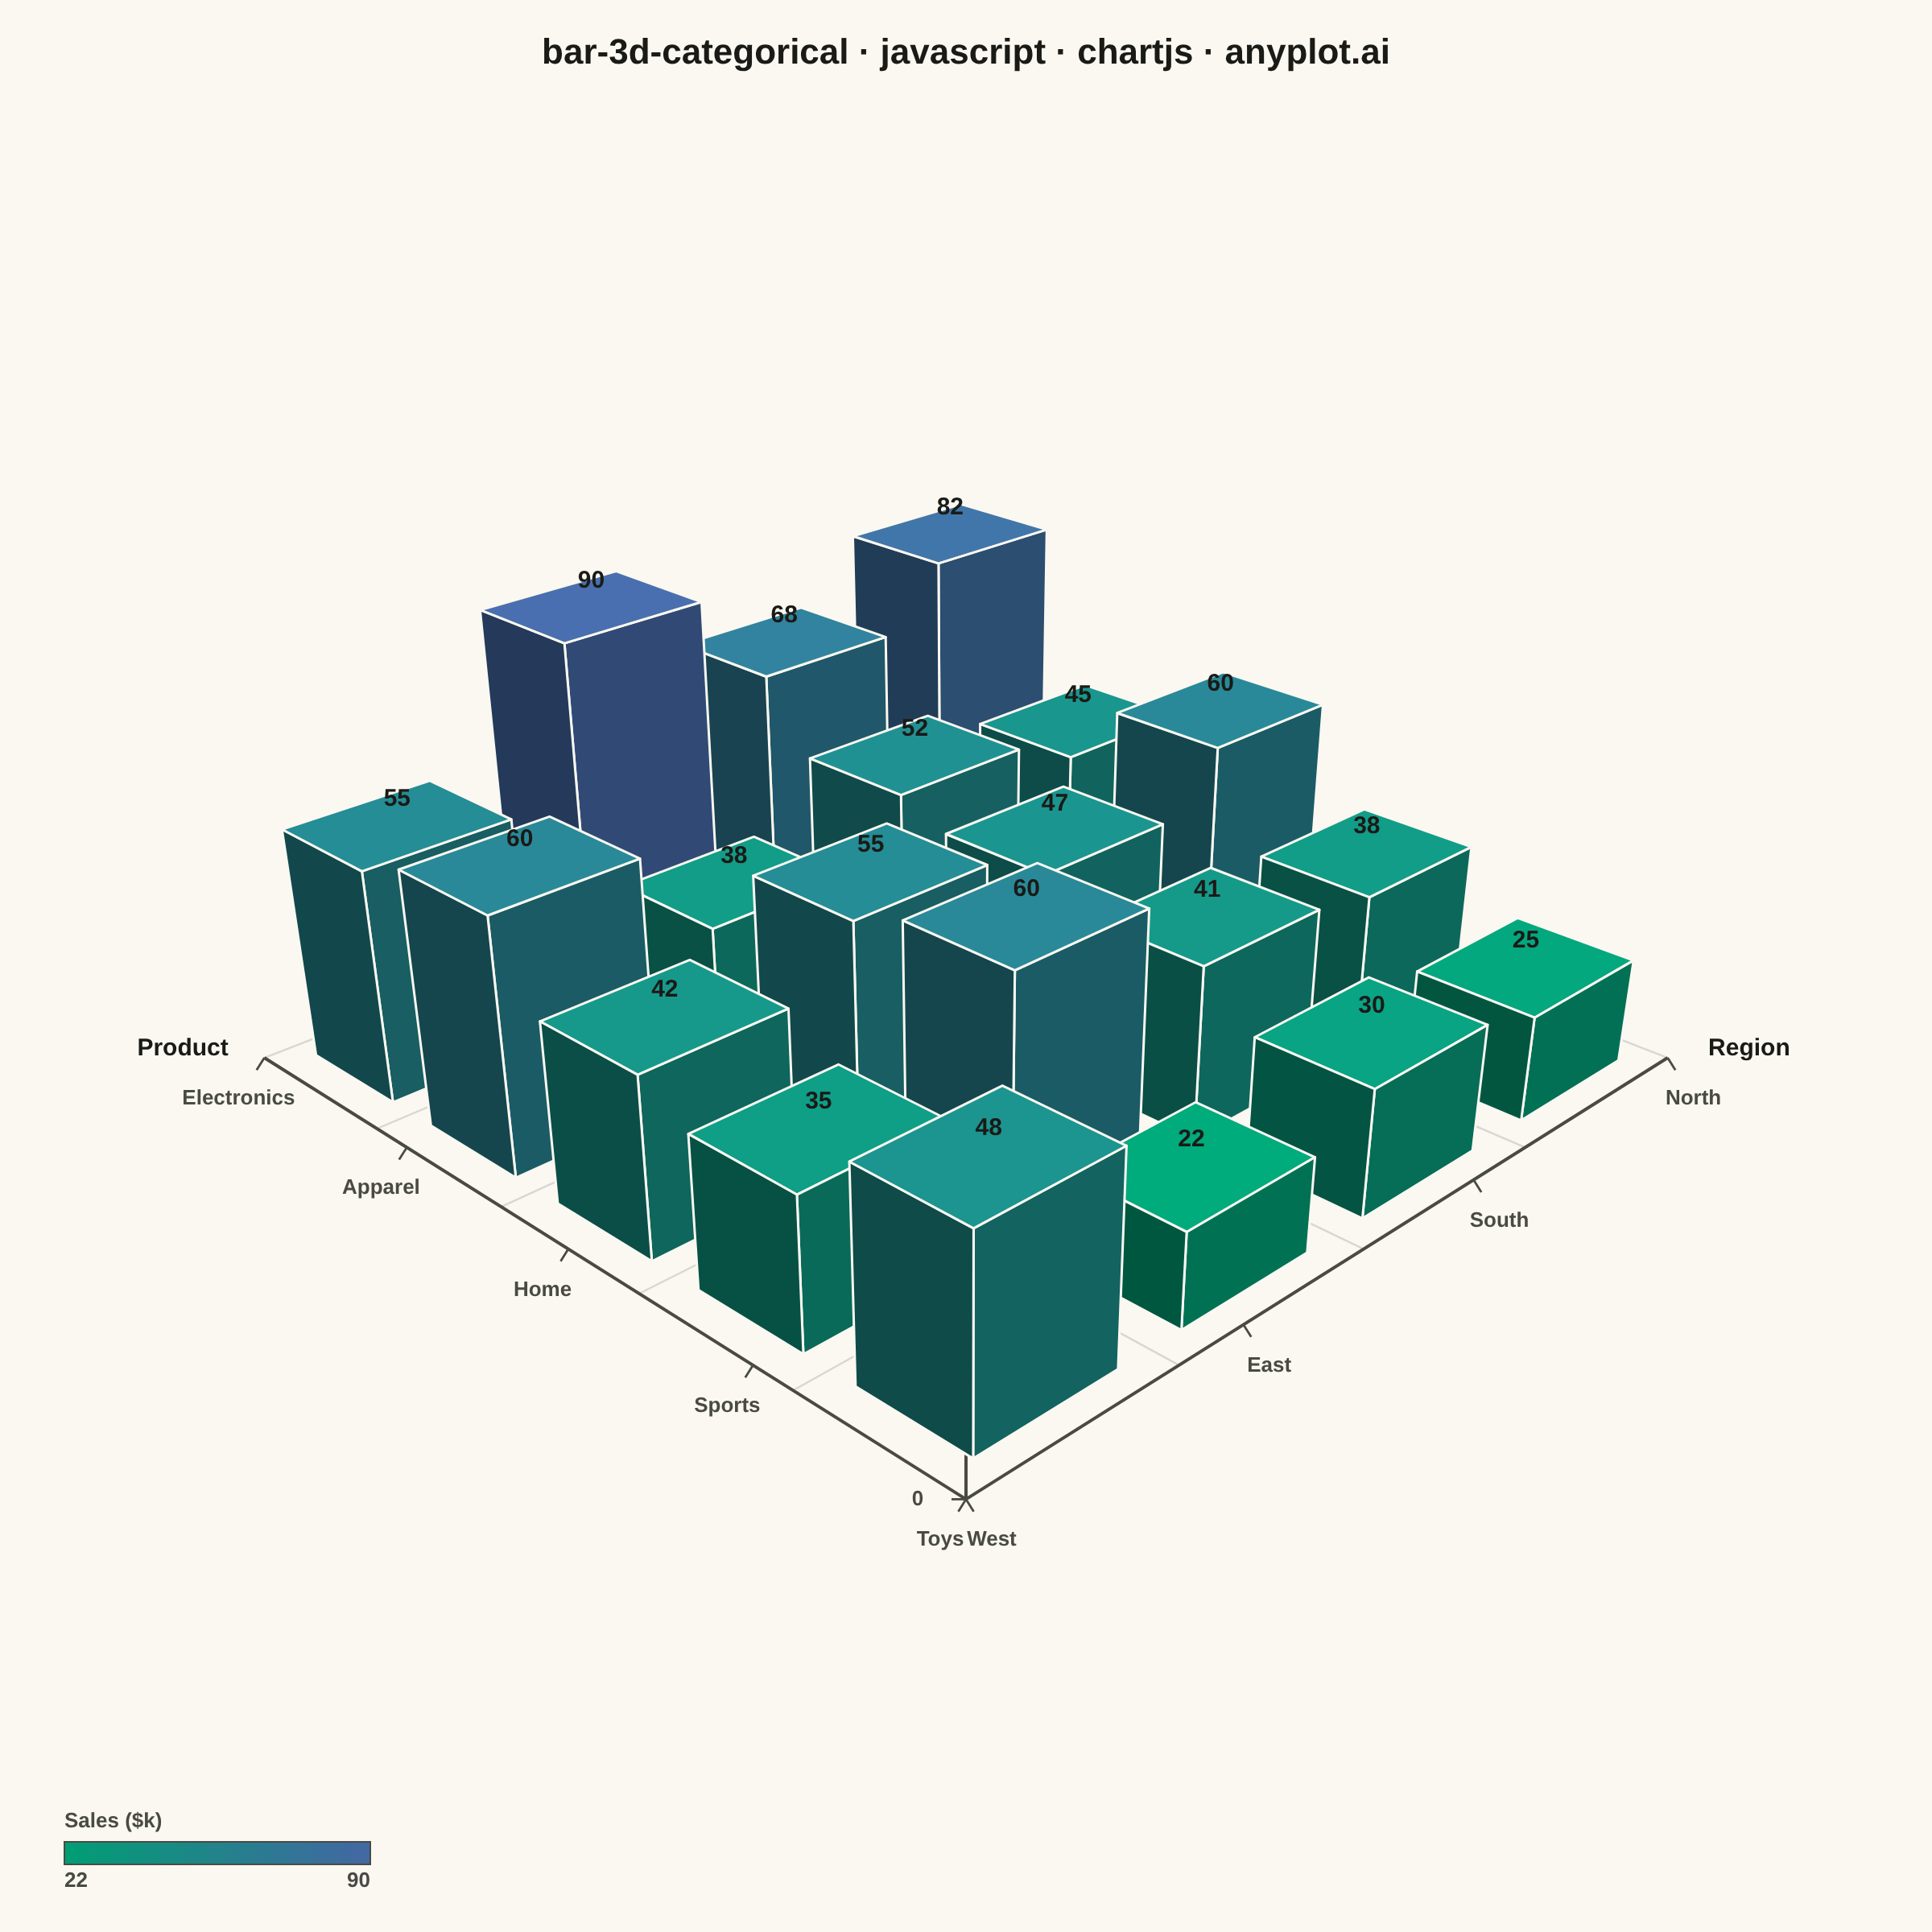
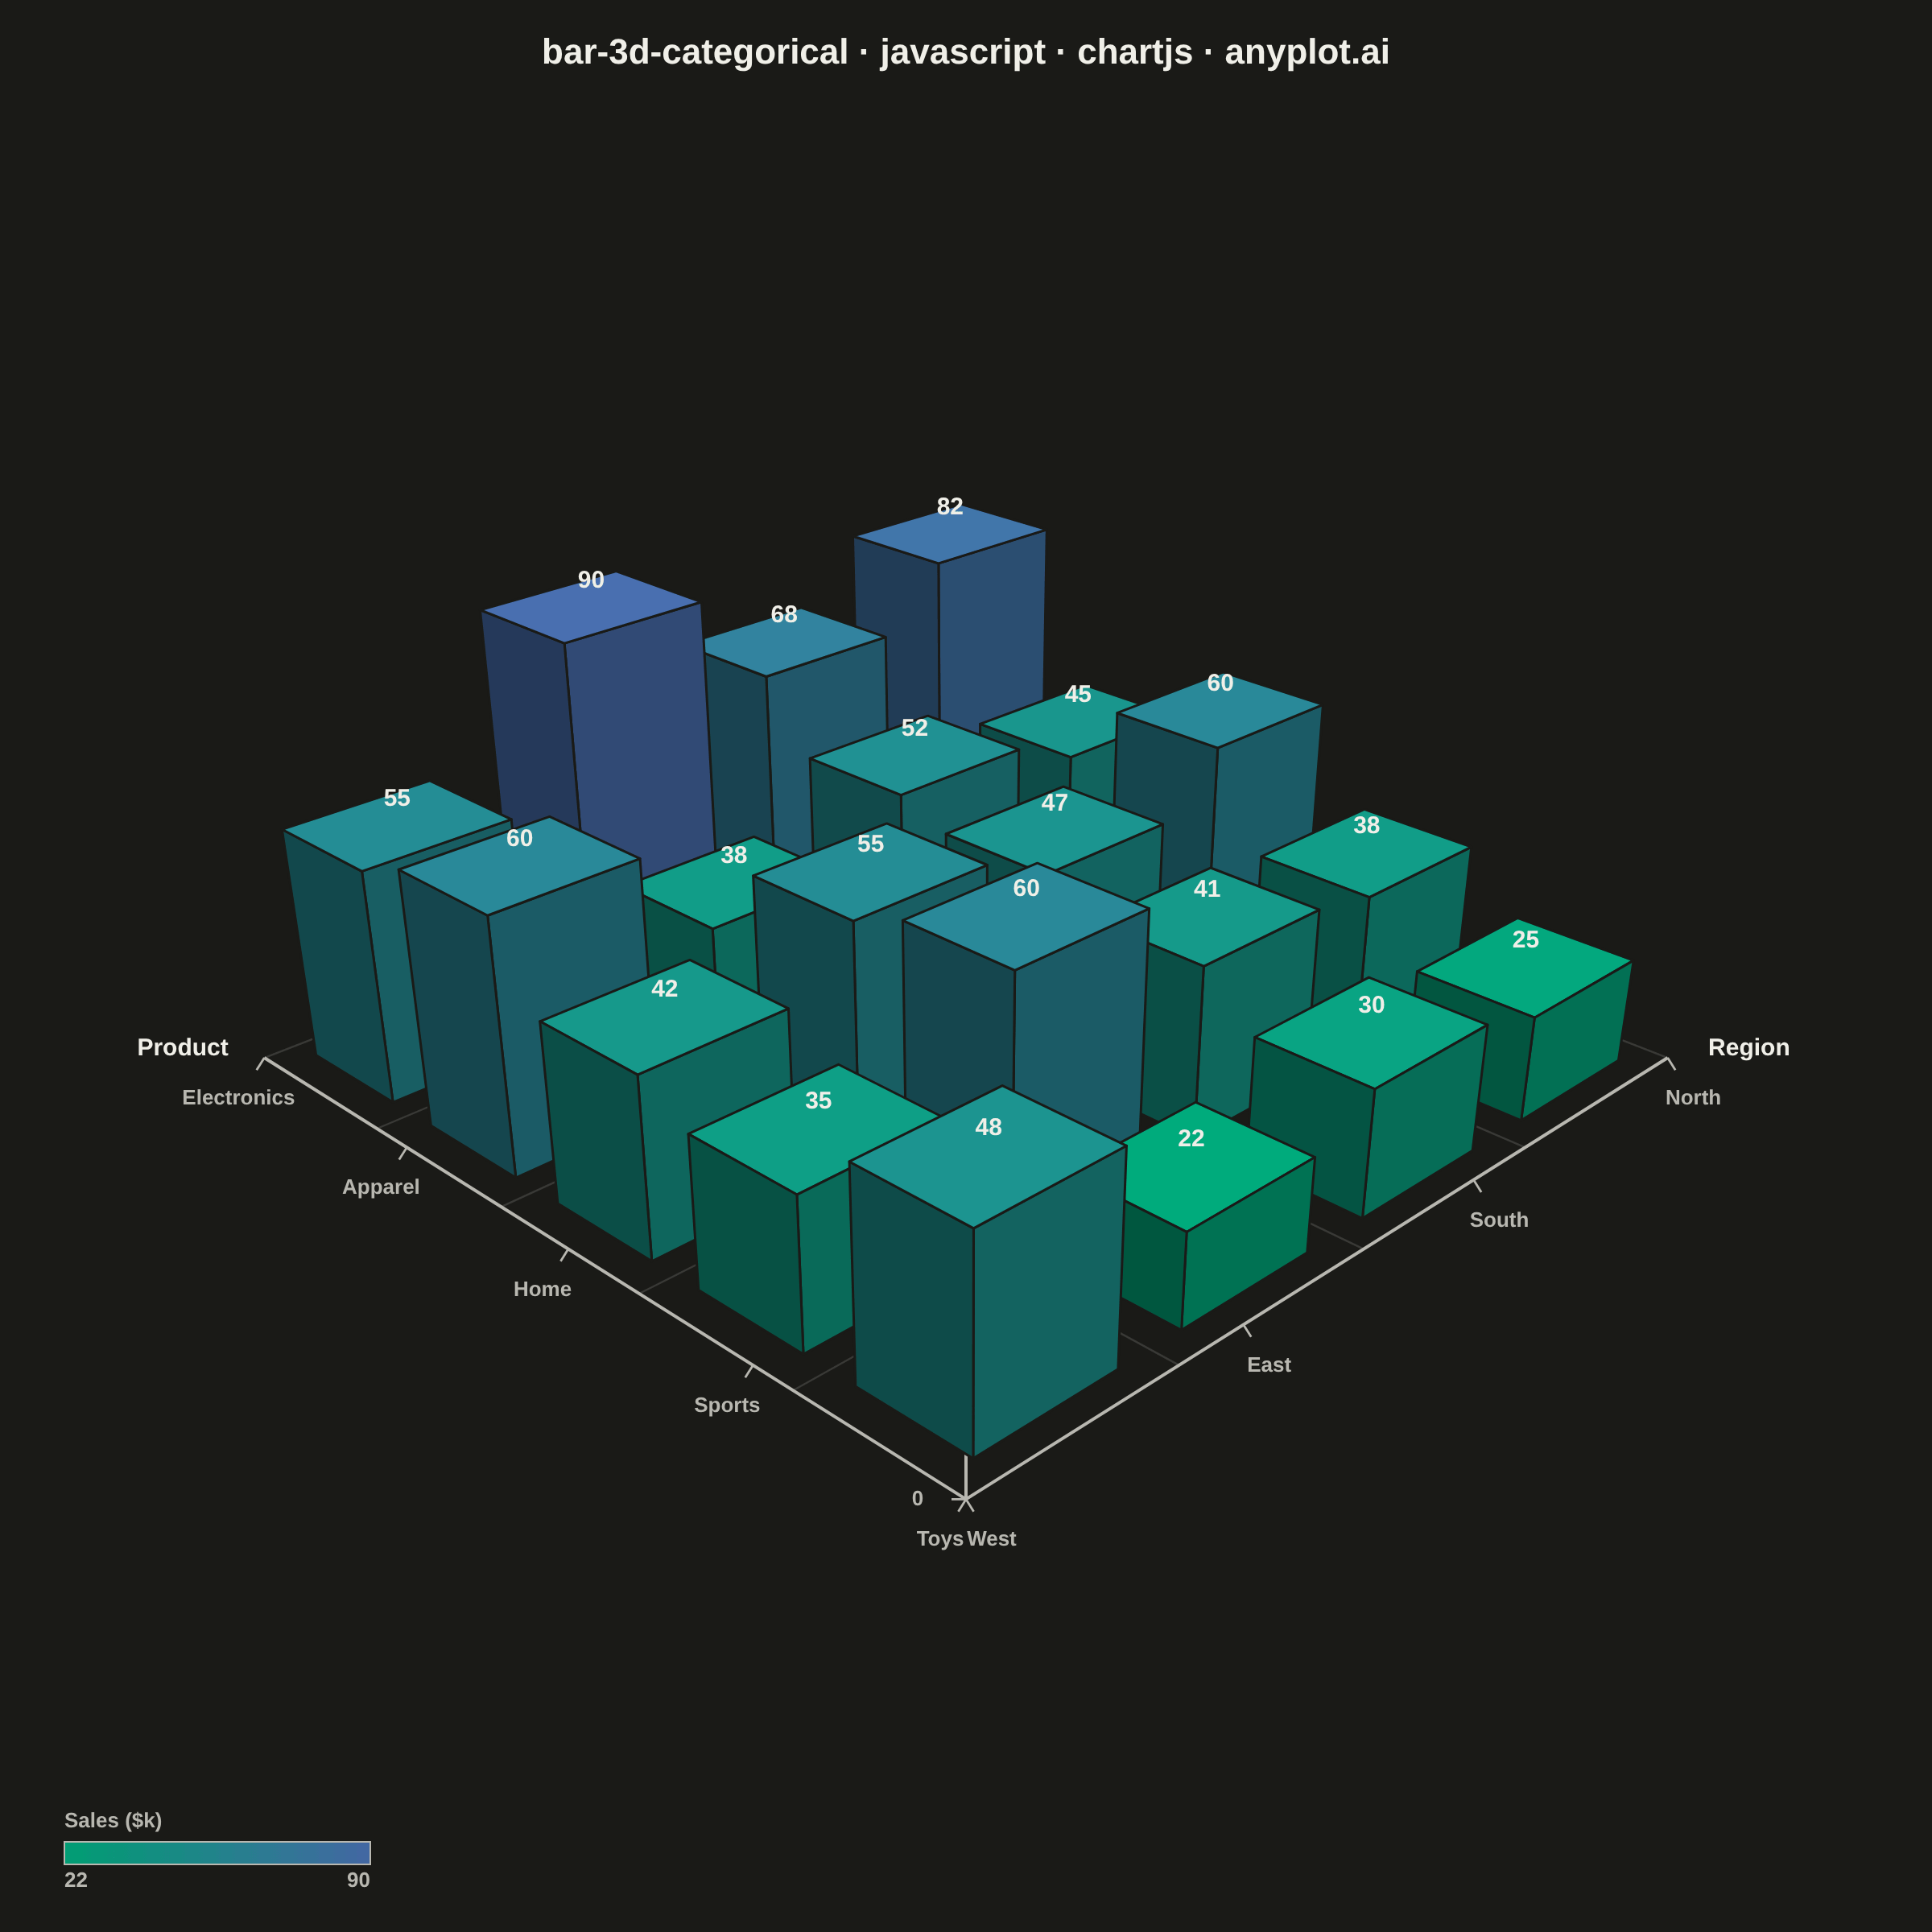
A three-dimensional bar chart where bars rise from a 2D categorical grid, with height encoding the measured value. Two categorical axes define the grid position on the base plane while the vertical axis shows magnitude. This visualization extends the bar chart family into 3D space, making it effective for comparing values across two categorical dimensions simultaneously.
// anyplot.ai
// bar-3d-categorical: 3D Bar Chart for Categorical Comparison
// Library: chartjs 4.4.7 | JavaScript 22.23.2
// Quality: 90/100 | Created: 2026-09-04
//# anyplot-orientation: square

// Chart.js has no native 3D chart type — this hand-builds an isometric bar
// chart (custom camera basis, true perspective projection, painter's-algorithm
// depth sorting) inside a single Chart.js plugin, same technique as the
// wireframe-3d-basic chartjs entry. No external 3D library, no community plugin.

const t = window.ANYPLOT_TOKENS;
const INK = t.ink;
const INK_SOFT = t.inkSoft;
const GRID = t.grid;

// --- Data: quarterly sales ($k) by product category x sales region ----------
const X_CATS = ["Electronics", "Apparel", "Home", "Sports", "Toys"];
const Y_CATS = ["North", "South", "East", "West"];
const VALUES = [
  // rows = Y_CATS (regions), cols = X_CATS (products) — 4 x 5 = 20 bars
  [82, 45, 60, 38, 25], // North
  [68, 52, 47, 41, 30], // South
  [90, 38, 55, 60, 22], // East
  [55, 60, 42, 35, 48], // West
];
const NX = X_CATS.length;
const NY = Y_CATS.length;

let vMin = Infinity, vMax = -Infinity;
for (const row of VALUES) for (const v of row) { if (v < vMin) vMin = v; if (v > vMax) vMax = v; }

// --- Layout: category index -> centered grid coordinate ---------------------
const BAR_HALF = 0.34; // half-width of each bar footprint — leaves a visible gap
const cx = (i) => i - (NX - 1) / 2;
const cy = (j) => j - (NY - 1) / 2;
const xExtent = NX / 2;
const yExtent = NY / 2;
const Z_SCALE = 0.85; // vertical exaggeration relative to the xy half-extent

// --- Camera: elevation 30 deg / azimuth 45 deg (per spec), true perspective -
const ELEV_DEG = 30, AZIM_DEG = 45;
const elev = (ELEV_DEG * Math.PI) / 180;
const azim = (AZIM_DEG * Math.PI) / 180;
const camDir = [Math.cos(elev) * Math.cos(azim), Math.cos(elev) * Math.sin(azim), Math.sin(elev)];
const worldUp = [0, 0, 1];
const cross = (a, b) => [a[1] * b[2] - a[2] * b[1], a[2] * b[0] - a[0] * b[2], a[0] * b[1] - a[1] * b[0]];
const normalize = (a) => { const l = Math.hypot(a[0], a[1], a[2]); return [a[0] / l, a[1] / l, a[2] / l]; };
const right = normalize(cross(camDir, worldUp));
const camUp = cross(right, camDir);

const CAM_DIST = 5.2, FOCAL = 5.2;
const projectNorm = (nx, ny, nz) => {
  const px = nx * right[0] + ny * right[1] + nz * right[2];
  const py = nx * camUp[0] + ny * camUp[1] + nz * camUp[2];
  const pd = nx * camDir[0] + ny * camDir[1] + nz * camDir[2];
  const depth = CAM_DIST - pd;
  const scale = FOCAL / depth;
  return { x: px * scale, y: py * scale, depth };
};
const norm = (x, y, z) => [x / xExtent, y / yExtent, (z / vMax) * Z_SCALE];
const project = (x, y, z) => projectNorm(...norm(x, y, z));

// With elevation/azimuth both positive, the +x and +y bar faces point toward
// the camera — those are the two visible side faces (plus the top).
const signX = camDir[0] >= 0 ? 1 : -1;
const signY = camDir[1] >= 0 ? 1 : -1;

// --- Value -> Imprint sequential colour (single polarity: sales are magnitudes)
const hexToRgb = (h) => [1, 3, 5].map((i) => parseInt(h.slice(i, i + 2), 16));
const seqLo = hexToRgb(t.seq[0]), seqHi = hexToRgb(t.seq[1]);
const lerpRgb = (a, b, f) => a.map((v, i) => Math.round(v + (b[i] - v) * f));
const clamp01 = (v) => Math.min(1, Math.max(0, v));
const clamp = (v, lo, hi) => Math.min(hi, Math.max(lo, v));
const shade = (rgb, f) => rgb.map((v) => clamp(Math.round(v * f), 0, 255));
const rgbCss = (rgb) => `rgb(${rgb[0]},${rgb[1]},${rgb[2]})`;
const colorForValue = (v) => {
  const f = vMax > vMin ? clamp01((v - vMin) / (vMax - vMin)) : 0.5;
  return lerpRgb(seqLo, seqHi, f);
};

// --- Build bar geometry: 3 visible faces per bar (top + two camera-facing sides)
const faces = [];
for (let j = 0; j < NY; j++) {
  for (let i = 0; i < NX; i++) {
    const v = VALUES[j][i];
    const x0 = cx(i) - BAR_HALF, x1 = cx(i) + BAR_HALF;
    const y0 = cy(j) - BAR_HALF, y1 = cy(j) + BAR_HALF;
    const xf = signX > 0 ? x1 : x0;
    const yf = signY > 0 ? y1 : y0;
    const base = colorForValue(v);

    const addFace = (corners3d, rgb) => {
      const pts = corners3d.map((p) => project(...p));
      const depth = pts.reduce((s, p) => s + p.depth, 0) / pts.length;
      faces.push({ pts, depth, color: rgbCss(rgb) });
    };

    addFace([[x0, y0, v], [x1, y0, v], [x1, y1, v], [x0, y1, v]], shade(base, 1.08)); // top
    addFace([[xf, y0, 0], [xf, y1, 0], [xf, y1, v], [xf, y0, v]], shade(base, 0.72)); // x-facing side
    addFace([[x0, yf, 0], [x1, yf, 0], [x1, yf, v], [x0, yf, v]], shade(base, 0.55)); // y-facing side
  }
}
faces.sort((a, b) => b.depth - a.depth); // painter's algorithm: farthest first

// --- Floor grid: cell boundaries on the base plane (z = 0) -------------------
const floorLines = [];
for (let i = 0; i <= NX; i++) {
  const bx = i - NX / 2;
  floorLines.push([project(bx, -yExtent, 0), project(bx, yExtent, 0)]);
}
for (let j = 0; j <= NY; j++) {
  const by = j - NY / 2;
  floorLines.push([project(-xExtent, by, 0), project(xExtent, by, 0)]);
}

// --- Axis box: anchor at the NEAREST floor corner ---------------------------
// A back-corner gnomon (the usual choice) sits directly behind whichever row
// happens to hold the tallest bars — with perspective, a tall bar's top can
// project higher on screen than a farther-but-low tick label, hiding it. The
// nearest floor corner is never behind a bar (every bar base is farther back
// or to the side of it), so its category labels stay clear regardless of
// which cell is tallest.
let axisCorner = null, bestDepth = Infinity;
for (const sx of [-xExtent, xExtent]) for (const sy of [-yExtent, yExtent]) {
  const d = project(sx, sy, 0).depth;
  if (d < bestDepth) { bestDepth = d; axisCorner = [sx, sy]; }
}
const [cAtX, cAtY] = axisCorner;

const axisEdges = [
  {
    from: [-xExtent, cAtY, 0], to: [xExtent, cAtY, 0],
    ticks: X_CATS.map((_, i) => cx(i)), labels: X_CATS, title: "Product",
  },
  {
    from: [cAtX, -yExtent, 0], to: [cAtX, yExtent, 0],
    ticks: Y_CATS.map((_, j) => cy(j)), labels: Y_CATS, title: "Region",
  },
  {
    from: [cAtX, cAtY, 0], to: [cAtX, cAtY, vMax],
    ticks: [0, vMax / 2, vMax], labels: [0, vMax / 2, vMax].map((v) => `${Math.round(v)}`), title: "Sales ($k)",
  },
];

// --- Fit chart scales to the projected content (no clipping, no guessing) ---
let minX = Infinity, maxX = -Infinity, minY = Infinity, maxY = -Infinity;
const consider = (p) => { if (p.x < minX) minX = p.x; if (p.x > maxX) maxX = p.x; if (p.y < minY) minY = p.y; if (p.y > maxY) maxY = p.y; };
faces.forEach((f) => f.pts.forEach(consider));
floorLines.forEach(([a, b]) => { consider(a); consider(b); });
axisEdges.forEach((e) => { consider(project(...e.from)); consider(project(...e.to)); });

const MARGIN = 0.34; // room for tick labels, axis titles, and value labels
let halfX = ((maxX - minX) / 2) * (1 + MARGIN);
let halfY = ((maxY - minY) / 2) * (1 + MARGIN);
const midX = (minX + maxX) / 2, midY = (minY + maxY) / 2;
const TARGET_ASPECT = 1.0; // square mount — the perspective box is roughly square
if (halfX / halfY < TARGET_ASPECT) halfX = halfY * TARGET_ASPECT; else halfY = halfX / TARGET_ASPECT;

// --- Mount --------------------------------------------------------------
const canvas = document.createElement("canvas");
document.getElementById("container").appendChild(canvas);

// --- Plugin: floor grid, depth-sorted bars, axis box + ticks, colour key ----
const bar3dPlugin = {
  id: "bar3d",
  beforeDatasetsDraw(chart) {
    const { ctx, scales: { x, y } } = chart;
    const toPx = (p) => [x.getPixelForValue(p.x), y.getPixelForValue(p.y)];

    // Floor grid.
    ctx.save();
    ctx.strokeStyle = GRID;
    ctx.lineWidth = 1.2;
    for (const [a, b] of floorLines) {
      const [ax, ay] = toPx(a), [bx, by] = toPx(b);
      ctx.beginPath();
      ctx.moveTo(ax, ay);
      ctx.lineTo(bx, by);
      ctx.stroke();
    }
    ctx.restore();

    // Axis box edges + ticks + labels — drawn before the bars so the bars
    // (opaque, foreground) always paint over any scaffolding line that falls
    // behind them; the nearest-corner choice already keeps the box clear of
    // the bars, and this draw order guarantees it never cuts across one anyway.
    ctx.save();
    ctx.strokeStyle = INK_SOFT;
    ctx.fillStyle = INK_SOFT;
    ctx.font = "600 13px -apple-system, Segoe UI, Roboto, sans-serif";
    ctx.textAlign = "center";
    ctx.textBaseline = "middle";
    // Reference point for the perpendicular sign flip: the scene's screen-space
    // center (not the shared axis-origin corner — that degenerates for the Z
    // edge, whose midpoint sits almost exactly above the origin).
    const centerPx = toPx({ x: midX, y: midY });
    // All three edges share the same corner (cAtX, cAtY, 0) as one endpoint —
    // anchor each title at whichever projected endpoint sits farther from that
    // shared corner, so the three titles fan out instead of piling up on it.
    const cornerPx = toPx(project(cAtX, cAtY, 0));
    const distSq = (p, q) => (p[0] - q[0]) ** 2 + (p[1] - q[1]) ** 2;

    for (const edge of axisEdges) {
      const pA = project(...edge.from), pB = project(...edge.to);
      const [ax, ay] = toPx(pA), [bx, by] = toPx(pB);
      ctx.lineWidth = 2;
      ctx.beginPath();
      ctx.moveTo(ax, ay);
      ctx.lineTo(bx, by);
      ctx.stroke();

      const dx = bx - ax, dy = by - ay;
      const len = Math.hypot(dx, dy) || 1;
      const dirX = dx / len, dirY = dy / len;
      let perpX = -dirY, perpY = dirX;
      const midx = (ax + bx) / 2, midy = (ay + by) / 2;
      if (perpX * (midx - centerPx[0]) + perpY * (midy - centerPx[1]) < 0) { perpX = -perpX; perpY = -perpY; }

      const tickSpan = edge.ticks[edge.ticks.length - 1] - edge.ticks[0];
      for (let k = 0; k < edge.ticks.length; k++) {
        const f = tickSpan !== 0 ? (edge.ticks[k] - edge.ticks[0]) / tickSpan : 0.5;
        const tx3 = edge.from[0] + (edge.to[0] - edge.from[0]) * f;
        const ty3 = edge.from[1] + (edge.to[1] - edge.from[1]) * f;
        const tz3 = edge.from[2] + (edge.to[2] - edge.from[2]) * f;
        const pt = project(tx3, ty3, tz3);
        const [tx, ty] = toPx(pt);
        ctx.lineWidth = 1.4;
        ctx.beginPath();
        ctx.moveTo(tx, ty);
        ctx.lineTo(tx + perpX * 9, ty + perpY * 9);
        ctx.stroke();
        ctx.fillText(`${edge.labels[k]}`, tx + perpX * 30, ty + perpY * 30);
      }

      // Title sits beyond whichever endpoint is farther from the shared
      // corner, extended along the edge's own direction — never beside a
      // tick label, and never piled onto a sibling axis's title.
      const bFarther = distSq([bx, by], cornerPx) >= distSq([ax, ay], cornerPx);
      const [tix, tiy] = bFarther ? [bx, by] : [ax, ay];
      const tiDirX = bFarther ? dirX : -dirX, tiDirY = bFarther ? dirY : -dirY;
      ctx.save();
      ctx.font = "700 15px -apple-system, Segoe UI, Roboto, sans-serif";
      ctx.fillStyle = INK;
      ctx.fillText(edge.title, tix + tiDirX * 46 + perpX * 22, tiy + tiDirY * 46 + perpY * 22);
      ctx.restore();
    }
    ctx.restore();

    // Bars, back-to-front, each face a filled + lightly outlined quad.
    ctx.save();
    ctx.lineJoin = "round";
    for (const f of faces) {
      const px = f.pts.map(toPx);
      ctx.beginPath();
      px.forEach(([fx, fy], k) => (k === 0 ? ctx.moveTo(fx, fy) : ctx.lineTo(fx, fy)));
      ctx.closePath();
      ctx.fillStyle = f.color;
      ctx.fill();
      ctx.strokeStyle = t.pageBg;
      ctx.lineWidth = 1.5;
      ctx.stroke();
    }
    ctx.restore();

    // Value labels on top of each bar (grid has 20 bars, under the 25 threshold).
    ctx.save();
    ctx.fillStyle = INK;
    ctx.font = "600 15px -apple-system, Segoe UI, Roboto, sans-serif";
    ctx.textAlign = "center";
    ctx.textBaseline = "bottom";
    for (let j = 0; j < NY; j++) {
      for (let i = 0; i < NX; i++) {
        const v = VALUES[j][i];
        const p = project(cx(i), cy(j), v);
        const [lx, ly] = toPx(p);
        ctx.fillText(`${v}`, lx, ly - 8);
      }
    }
    ctx.restore();
  },

  afterDatasetsDraw(chart) {
    const { ctx, chartArea } = chart;

    // Sales colour key (bottom-left), fixed to the chart area in pixels.
    ctx.save();
    const keyX = chartArea.left + 24;
    const keyY = chartArea.bottom - 40;
    const keyW = 190, keyH = 14;
    const grad = ctx.createLinearGradient(keyX, 0, keyX + keyW, 0);
    grad.addColorStop(0, t.seq[0]);
    grad.addColorStop(1, t.seq[1]);
    ctx.fillStyle = grad;
    ctx.fillRect(keyX, keyY, keyW, keyH);
    ctx.strokeStyle = INK_SOFT;
    ctx.lineWidth = 1;
    ctx.strokeRect(keyX, keyY, keyW, keyH);

    ctx.font = "600 13px -apple-system, Segoe UI, Roboto, sans-serif";
    ctx.fillStyle = INK_SOFT;
    ctx.textBaseline = "bottom";
    ctx.textAlign = "left";
    ctx.fillText("Sales ($k)", keyX, keyY - 6);
    ctx.textBaseline = "top";
    ctx.fillText(`${vMin}`, keyX, keyY + keyH + 4);
    ctx.textAlign = "right";
    ctx.fillText(`${vMax}`, keyX + keyW, keyY + keyH + 4);
    ctx.restore();
  },
};

// --- Chart --------------------------------------------------------------
new Chart(canvas, {
  type: "scatter",
  data: { datasets: [{ data: [], showLine: false, pointRadius: 0 }] },
  options: {
    responsive: true,
    maintainAspectRatio: false,
    animation: false,
    layout: { padding: 16 },
    plugins: {
      title: {
        display: true,
        text: "bar-3d-categorical · javascript · chartjs · anyplot.ai",
        color: INK,
        font: { size: 22, weight: "600" },
        padding: { top: 4, bottom: 14 },
      },
      legend: { display: false },
      tooltip: { enabled: false },
    },
    scales: {
      x: { type: "linear", min: midX - halfX, max: midX + halfX, display: false },
      y: { type: "linear", min: midY - halfY, max: midY + halfY, display: false },
    },
  },
  plugins: [bar3dPlugin],
});
Runnable source as JSON, for any HTTP client: https://api.anyplot.ai/specs/bar-3d-categorical/chartjs/code. Any spec id and library id listed in llms-full.txt fit the same URL shape; every URL below is complete and callable.
{
  "spec_id": "bar-3d-categorical",
  "language": "javascript",
  "library": "chartjs",
  "page": "https://anyplot.ai/bar-3d-categorical/javascript/chartjs",
  "hub": "https://anyplot.ai/bar-3d-categorical",
  "code_json": "https://api.anyplot.ai/specs/bar-3d-categorical/chartjs/code",
  "spec_json": "https://api.anyplot.ai/specs/bar-3d-categorical",
  "render_light_png": "https://storage.googleapis.com/anyplot-images/plots/bar-3d-categorical/javascript/chartjs/plot-light.png",
  "render_dark_png": "https://storage.googleapis.com/anyplot-images/plots/bar-3d-categorical/javascript/chartjs/plot-dark.png",
  "interactive_light_html": "https://storage.googleapis.com/anyplot-images/plots/bar-3d-categorical/javascript/chartjs/plot-light.html",
  "interactive_dark_html": "https://storage.googleapis.com/anyplot-images/plots/bar-3d-categorical/javascript/chartjs/plot-dark.html",
  "quality_score": 90.0,
  "license": "MIT",
  "guide": "https://anyplot.ai/llms.txt"
}
Part of 3D Bar Chart for Categorical Comparison on anyplot.ai.