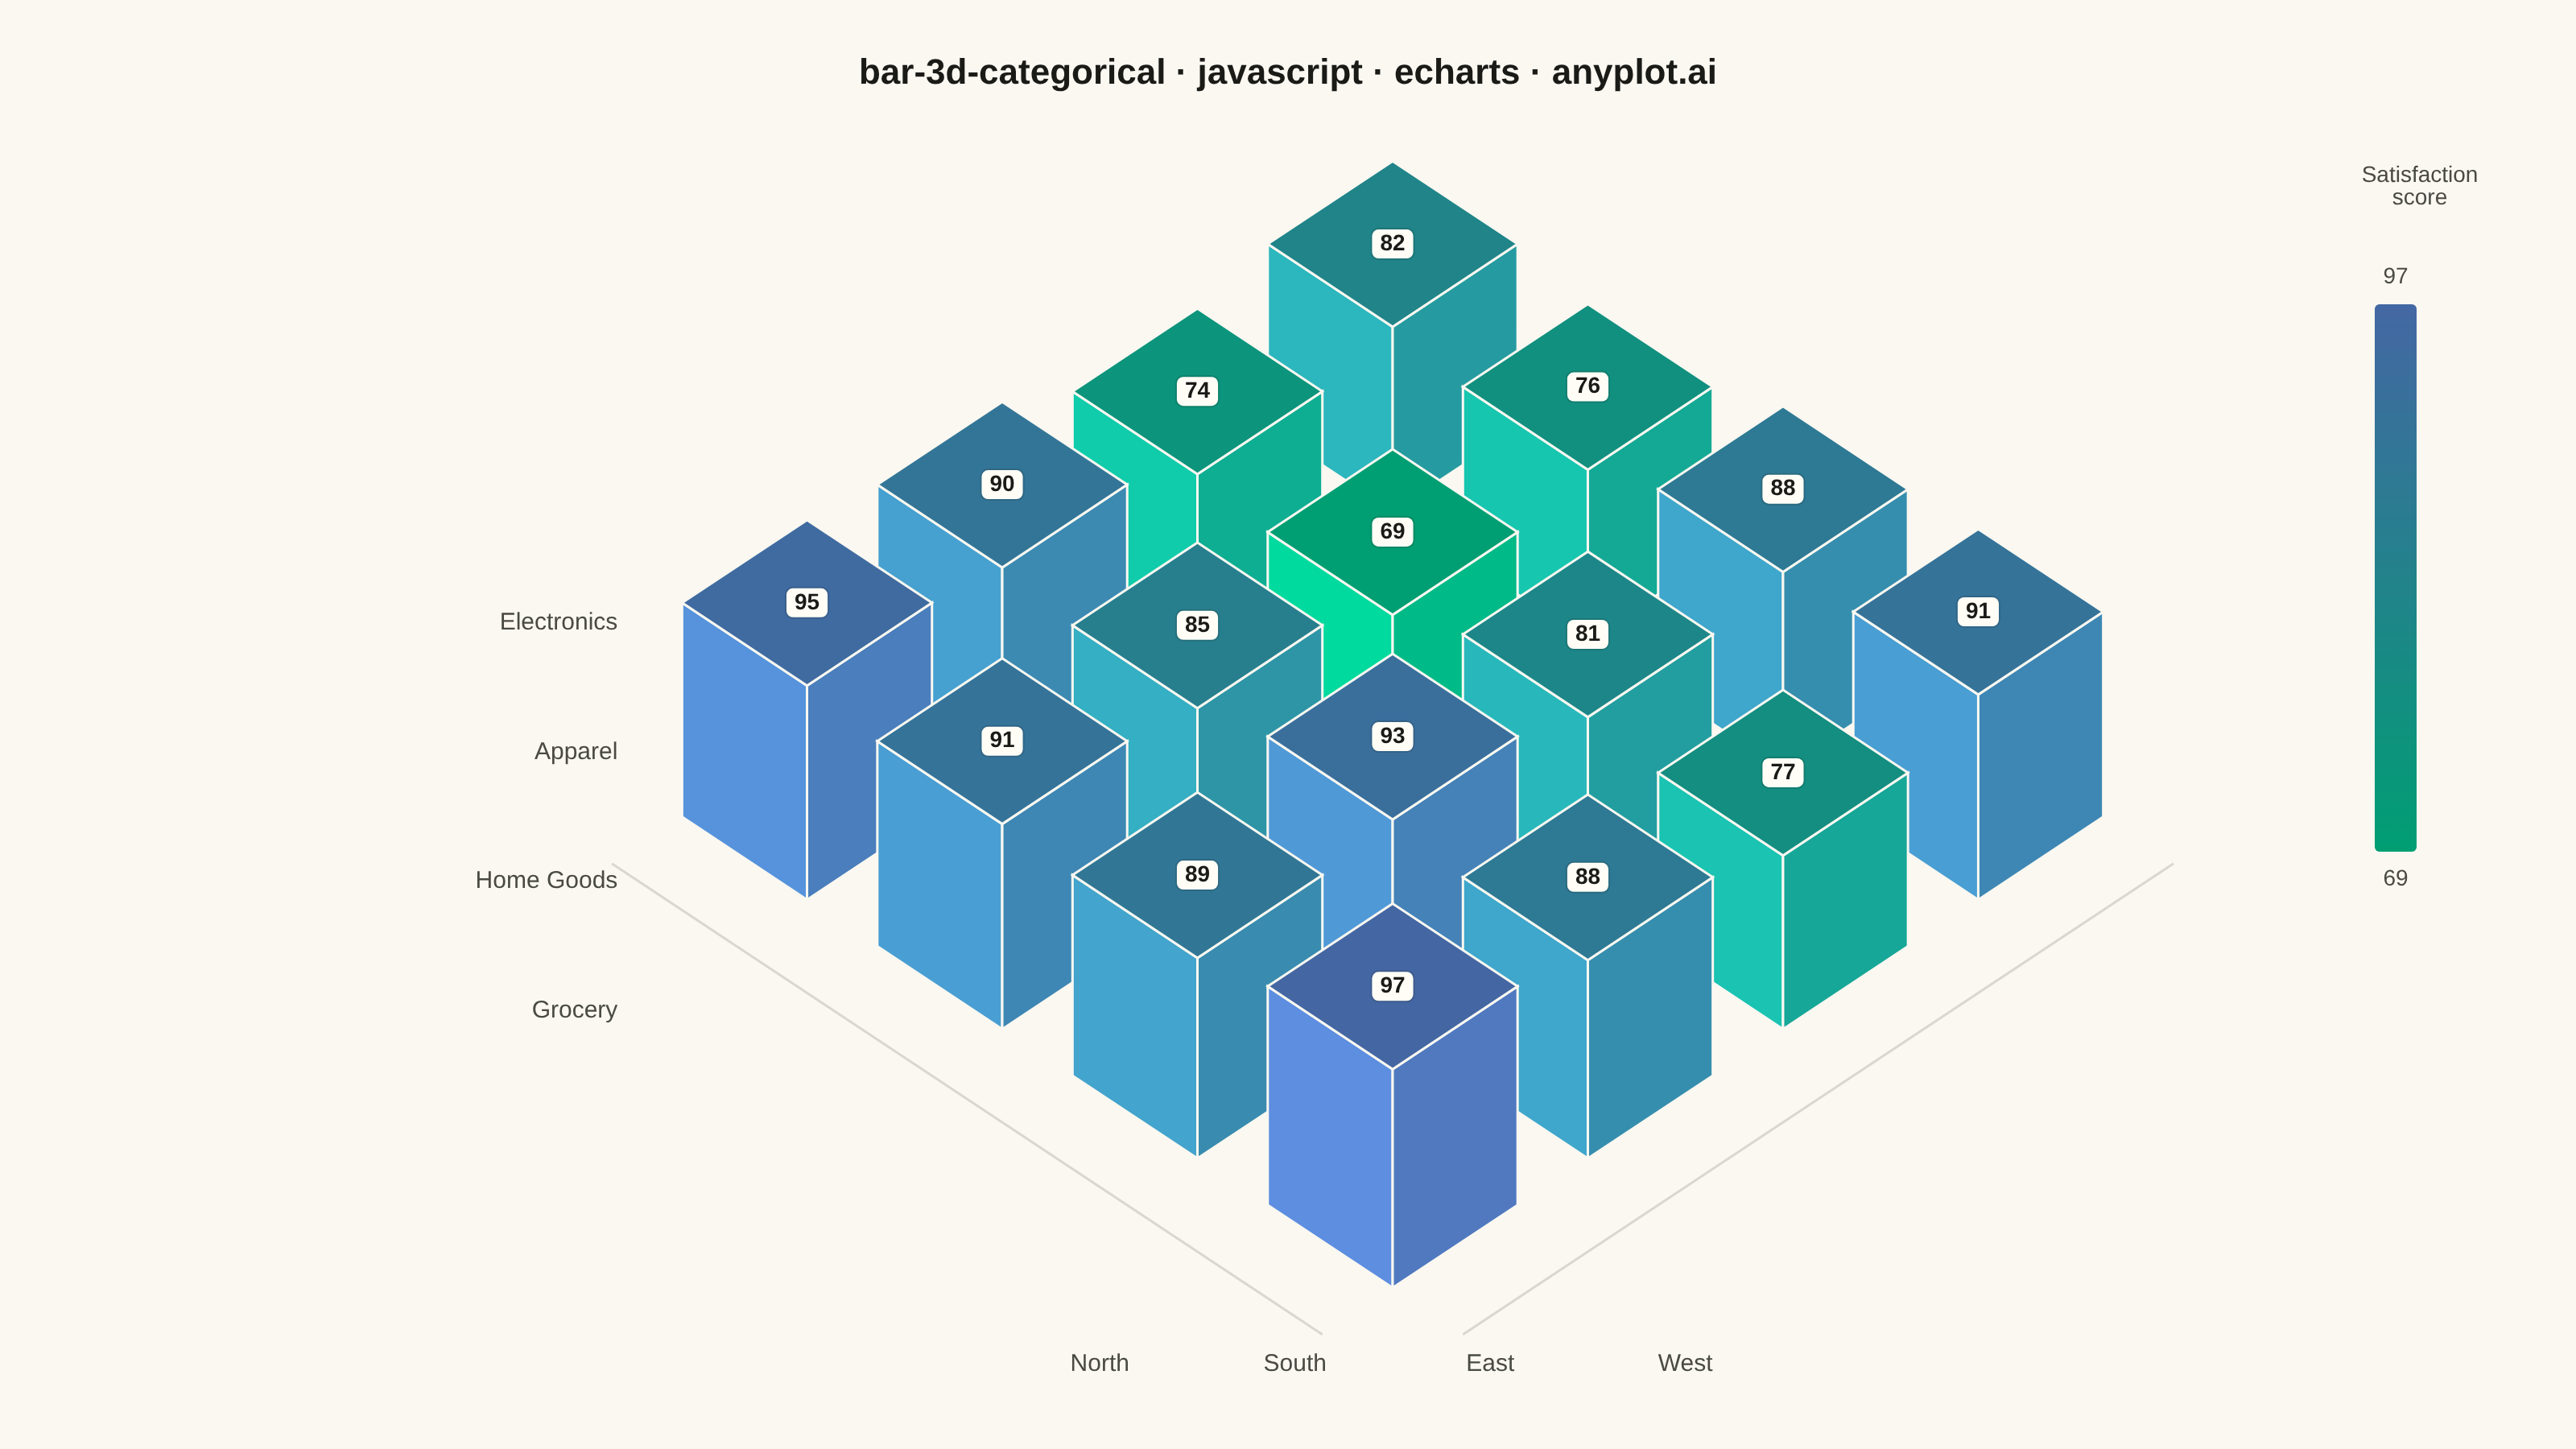
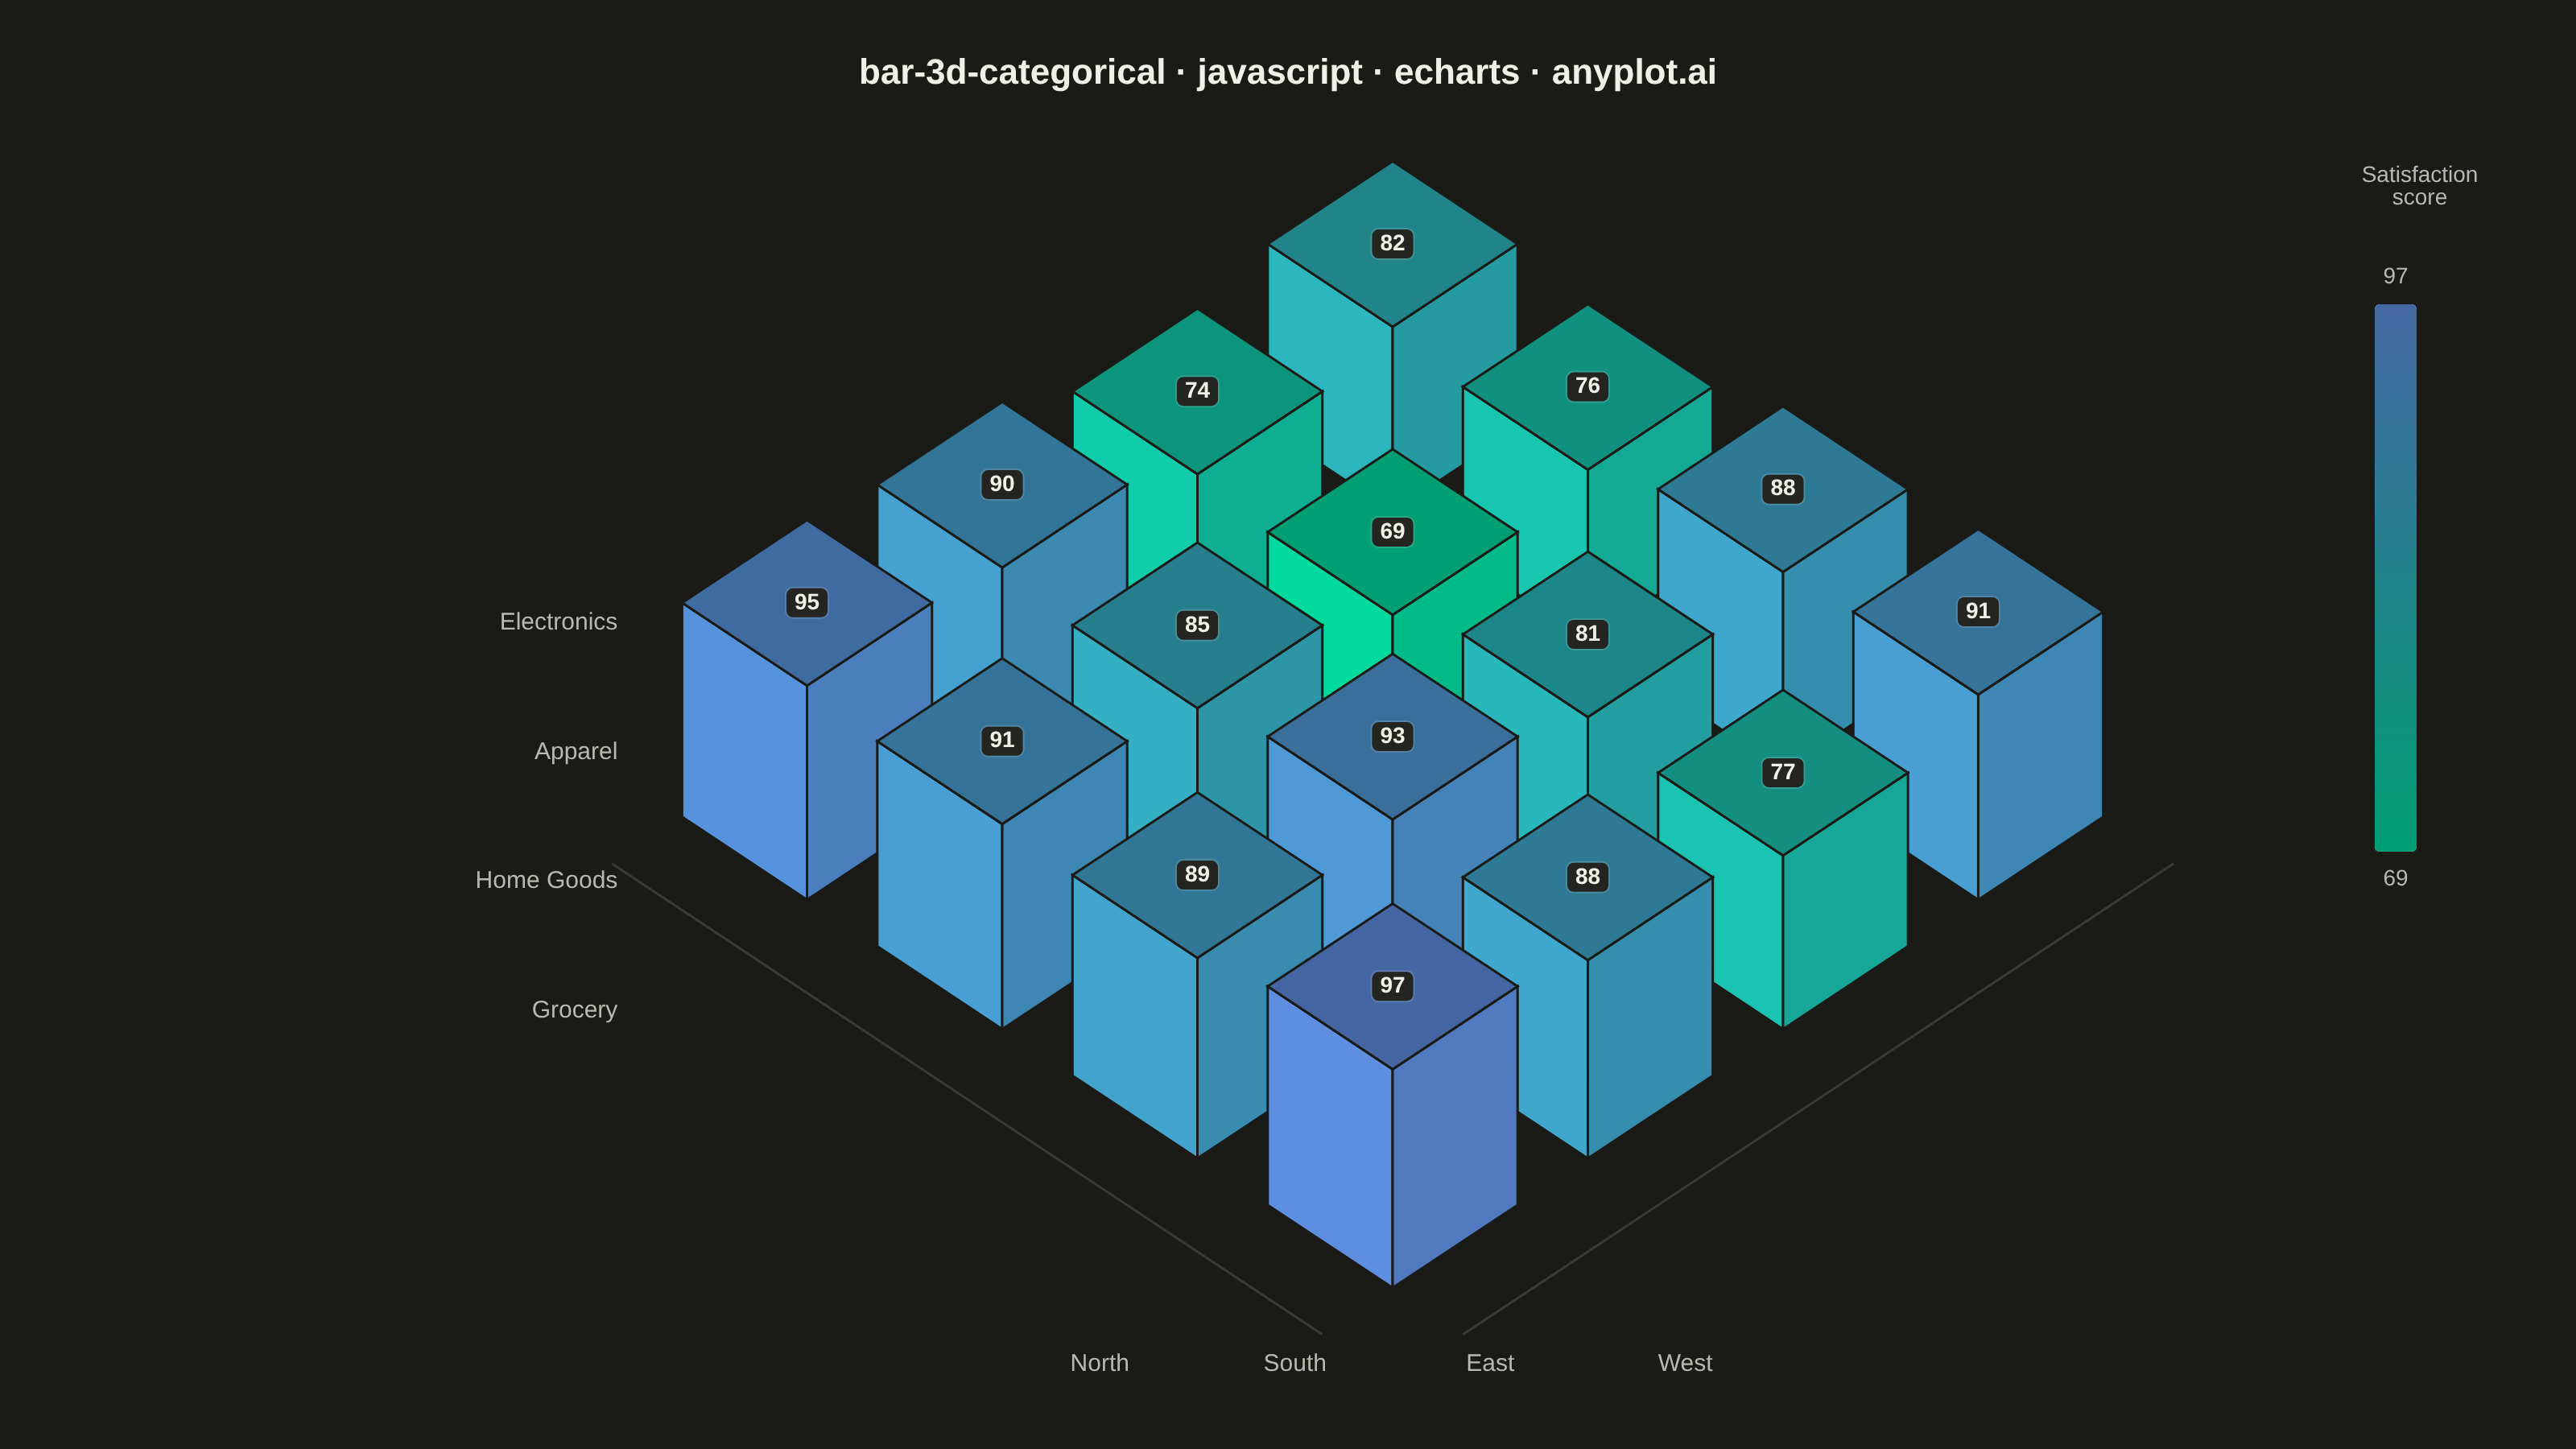
The same plot in 13 other libraries — JavaScript: Chart.js, D3.js, MUI X Charts; Python: Altair, Bokeh, lets-plot, Matplotlib, Plotly, plotnine, Pygal, Seaborn; R: ggplot2; Julia: Makie.jl. Compare all 14 side by side: 3D Bar Chart for Categorical Comparison in Python, R, Julia and JavaScript.
A three-dimensional bar chart where bars rise from a 2D categorical grid, with height encoding the measured value. Two categorical axes define the grid position on the base plane while the vertical axis shows magnitude. This visualization extends the bar chart family into 3D space, making it effective for comparing values across two categorical dimensions simultaneously.
// anyplot.ai
// bar-3d-categorical: 3D Bar Chart for Categorical Comparison
// Library: echarts 6.1.0 | JavaScript 22.23.2
// Quality: 92/100 | Created: 2026-09-04

//# anyplot-orientation: landscape

const t = window.ANYPLOT_TOKENS;
const size = window.ANYPLOT_SIZE;

// --- Data (in-memory, deterministic) ---------------------------------------
// Customer satisfaction score (0-100) by product line and region.
const regions = ["North", "South", "East", "West"];
const productLines = ["Electronics", "Apparel", "Home Goods", "Grocery"];
const scores = [
  [82, 76, 88, 91],
  [74, 69, 81, 77],
  [90, 85, 93, 88],
  [95, 91, 89, 97],
];

const cells = [];
productLines.forEach((yLabel, row) => {
  regions.forEach((xLabel, col) => {
    cells.push({ col, row, xLabel, yLabel, value: scores[row][col] });
  });
});
const values = cells.map((c) => c.value);
const minValue = Math.min(...values);
const maxValue = Math.max(...values);

// --- Isometric projection (elevation ~30deg, azimuth ~45deg) ---------------
// The depth factor is pushed slightly beyond a literal sin(30deg) so that
// consecutive rows/columns stay clear of each other even at max bar height —
// a purely 30deg depth step would let a tall back bar visually collide with
// a short bar one row closer (their screen-space heights overlap).
const ISO_ANGLE = (30 * Math.PI) / 180;
const COS_A = Math.cos(ISO_ANGLE);
const DEPTH_A = 0.574; // ~elevation 35deg equivalent, for readable depth spacing
const CELL = 140; // grid spacing along each categorical axis
const PAD = 0.32; // half bar footprint (cell units) — leaves a visible gap
const MAX_BAR_H = 140; // px for the tallest bar
const LABEL_MARGIN = 40; // px beyond the grid's silhouette for axis labels

function projectRaw(col, row, z) {
  const x = (col - row) * COS_A * CELL;
  const y = (col + row) * DEPTH_A * CELL - z;
  return [x, y];
}

function barHeight(value) {
  return (value / 100) * MAX_BAR_H;
}

// --- Center the isometric grid inside the mount -----------------------------
const TOP_MARGIN = 110;
const BOTTOM_MARGIN = 70;
const LEFT_MARGIN = 210;
const RIGHT_MARGIN = 190;
const midRow = (productLines.length - 1) / 2;
const midCol = (regions.length - 1) / 2;

const rawPoints = [];
for (const rowEdge of [-PAD, productLines.length - 1 + PAD]) {
  for (const colEdge of [-PAD, regions.length - 1 + PAD]) {
    rawPoints.push(projectRaw(colEdge, rowEdge, 0));
  }
}
cells.forEach(({ col, row, value }) => {
  rawPoints.push(projectRaw(col - PAD, row - PAD, barHeight(value)));
});
// Axis label lanes: a straight line below (x-axis) and to the left (y-axis)
// of the grid's silhouette, not the skewed isometric edge.
const frontTipYRaw = projectRaw(regions.length - 1 + PAD, productLines.length - 1 + PAD, 0)[1];
const leftTipXRaw = projectRaw(-PAD, productLines.length - 1 + PAD, 0)[0];
const xLabelYRaw = frontTipYRaw + LABEL_MARGIN;
const yLabelXRaw = leftTipXRaw - LABEL_MARGIN - 70;
regions.forEach((_, col) => rawPoints.push([projectRaw(col, midRow, 0)[0], xLabelYRaw]));
productLines.forEach((_, row) => rawPoints.push([yLabelXRaw, projectRaw(midCol, row, 0)[1]]));

const rawXs = rawPoints.map((p) => p[0]);
const rawYs = rawPoints.map((p) => p[1]);
const rawMinX = Math.min(...rawXs);
const rawMaxX = Math.max(...rawXs);
const rawMinY = Math.min(...rawYs);
const rawMaxY = Math.max(...rawYs);

const drawWidth = size.width - LEFT_MARGIN - RIGHT_MARGIN;
const drawHeight = size.height - TOP_MARGIN - BOTTOM_MARGIN;
const originX = LEFT_MARGIN + (drawWidth - (rawMaxX - rawMinX)) / 2 - rawMinX;
const originY = TOP_MARGIN + (drawHeight - (rawMaxY - rawMinY)) / 2 - rawMinY;

function project(col, row, z) {
  const [x, y] = projectRaw(col, row, z);
  return [x + originX, y + originY];
}

// --- Floor grid — relates bars to their categorical position ---------------
function gridLine(p1, p2) {
  return {
    type: "line",
    shape: { x1: p1[0], y1: p1[1], x2: p2[0], y2: p2[1] },
    style: { stroke: t.grid, lineWidth: 1.5 },
    silent: true,
  };
}

const chromeElements = [];
for (let row = 0; row <= productLines.length; row++) {
  chromeElements.push(gridLine(project(-PAD, row - PAD, 0), project(regions.length - 1 + PAD, row - PAD, 0)));
}
for (let col = 0; col <= regions.length; col++) {
  chromeElements.push(gridLine(project(col - PAD, -PAD, 0), project(col - PAD, productLines.length - 1 + PAD, 0)));
}

// Axis category labels — straight lanes outside the grid silhouette
regions.forEach((label, col) => {
  const x = project(col, midRow, 0)[0];
  chromeElements.push({
    type: "text",
    style: { text: label, x, y: frontTipYRaw + originY + LABEL_MARGIN, fill: t.inkSoft, fontSize: 15, align: "center", verticalAlign: "top" },
    silent: true,
  });
});
productLines.forEach((label, row) => {
  const y = project(midCol, row, 0)[1];
  chromeElements.push({
    type: "text",
    style: { text: label, x: leftTipXRaw + originX - LABEL_MARGIN, y, fill: t.inkSoft, fontSize: 15, align: "right", verticalAlign: "middle" },
    silent: true,
  });
});

// Legend title above the visualMap color bar (visualMap draws the gradient + min/max itself)
const legendWidth = 26;
const legendTop = TOP_MARGIN + 40;
const legendHeight = 340;
const legendRight = 84; // = 110 - legendWidth, mirrors the grid's RIGHT_MARGIN framing
chromeElements.push({
  type: "text",
  style: {
    text: "Satisfaction\nscore",
    x: size.width - legendRight - legendWidth / 2,
    y: legendTop - 20,
    fill: t.inkSoft,
    fontSize: 14,
    align: "center",
    verticalAlign: "bottom",
  },
  silent: true,
});

// --- Custom series: each data item renders one isometric 3D bar ------------
// Bound to the real dataset (value, col, row) so ECharts drives color via
// visualMap and keeps tooltip/hover interactivity, instead of static shapes.
function renderItem(params, api) {
  const value = api.value(0);
  const col = api.value(1);
  const row = api.value(2);
  const h = barHeight(value);
  const topColor = api.visual("color");
  const rightColor = echarts.color.lift(topColor, -0.18);
  const leftColor = echarts.color.lift(topColor, -0.38);

  const baseFront = project(col + PAD, row + PAD, 0);
  const baseLeft = project(col - PAD, row + PAD, 0);
  const baseRight = project(col + PAD, row - PAD, 0);
  const topFront = project(col + PAD, row + PAD, h);
  const topLeft = project(col - PAD, row + PAD, h);
  const topRight = project(col + PAD, row - PAD, h);
  const topBack = project(col - PAD, row - PAD, h);
  const topCenter = project(col, row, h);

  const face = (points, fill) => ({
    type: "polygon",
    shape: { points },
    style: { fill, stroke: t.pageBg, lineWidth: 1.5 },
  });

  return {
    type: "group",
    z2: col + row,
    children: [
      face([baseLeft, baseFront, topFront, topLeft], leftColor),
      face([baseFront, baseRight, topRight, topFront], rightColor),
      face([topBack, topLeft, topFront, topRight], topColor),
      {
        // Anchored at the top face's own centroid (not its back edge) so the
        // label always sits within its own bar's footprint, never drifting
        // over a taller neighbor drawn at a different depth.
        type: "text",
        style: {
          text: String(value),
          x: topCenter[0],
          y: topCenter[1],
          fill: t.ink,
          fontSize: 14,
          fontWeight: 600,
          align: "center",
          verticalAlign: "middle",
          backgroundColor: t.elevatedBg,
          borderColor: t.grid,
          borderWidth: 1,
          borderRadius: 4,
          padding: [2, 5],
        },
      },
    ],
  };
}

// --- Init ---------------------------------------------------------------
const chart = echarts.init(document.getElementById("container"));
chart.setOption({
  animation: false,
  backgroundColor: "transparent",
  title: {
    text: "bar-3d-categorical · javascript · echarts · anyplot.ai",
    left: "center",
    top: 30,
    textStyle: { color: t.ink, fontSize: 22 },
  },
  tooltip: { trigger: "item" },
  visualMap: {
    dimension: 0,
    min: minValue,
    max: maxValue,
    inRange: { color: t.seq },
    orient: "vertical",
    right: legendRight,
    top: legendTop,
    itemWidth: legendWidth,
    itemHeight: legendHeight,
    text: [String(maxValue), String(minValue)],
    textGap: 10,
    textStyle: { color: t.inkSoft, fontSize: 14 },
  },
  graphic: chromeElements,
  series: [
    {
      type: "custom",
      // No axis-based coordinate system backs this chart (the isometric
      // projection is computed manually in renderItem); without this,
      // ECharts' custom series defaults to cartesian2d and throws for
      // missing xAxis/yAxis components.
      coordinateSystem: null,
      renderItem,
      data: cells.map((c) => ({
        name: `${c.xLabel} · ${c.yLabel}`,
        value: [c.value, c.col, c.row],
      })),
      tooltip: {
        formatter: (params) => `${params.name}<br/><b>${params.value[0]}</b> satisfaction score`,
      },
    },
  ],
});
Runnable source as JSON, for any HTTP client: https://api.anyplot.ai/specs/bar-3d-categorical/echarts/code. Any spec id and library id listed in llms-full.txt fit the same URL shape; every URL below is complete and callable.
{
  "spec_id": "bar-3d-categorical",
  "language": "javascript",
  "library": "echarts",
  "page": "https://anyplot.ai/bar-3d-categorical/javascript/echarts",
  "hub": "https://anyplot.ai/bar-3d-categorical",
  "code_json": "https://api.anyplot.ai/specs/bar-3d-categorical/echarts/code",
  "spec_json": "https://api.anyplot.ai/specs/bar-3d-categorical",
  "render_light_png": "https://storage.googleapis.com/anyplot-images/plots/bar-3d-categorical/javascript/echarts/plot-light.png",
  "render_dark_png": "https://storage.googleapis.com/anyplot-images/plots/bar-3d-categorical/javascript/echarts/plot-dark.png",
  "interactive_light_html": "https://storage.googleapis.com/anyplot-images/plots/bar-3d-categorical/javascript/echarts/plot-light.html",
  "interactive_dark_html": "https://storage.googleapis.com/anyplot-images/plots/bar-3d-categorical/javascript/echarts/plot-dark.html",
  "quality_score": 92.0,
  "license": "MIT",
  "guide": "https://anyplot.ai/llms.txt"
}
Part of 3D Bar Chart for Categorical Comparison on anyplot.ai.