The same plot in 13 other libraries — JavaScript: Chart.js, Apache ECharts, MUI X Charts; Python: Altair, Bokeh, lets-plot, Matplotlib, Plotly, plotnine, Pygal, Seaborn; R: ggplot2; Julia: Makie.jl. Compare all 14 side by side: 3D Bar Chart for Categorical Comparison in Python, R, Julia and JavaScript.
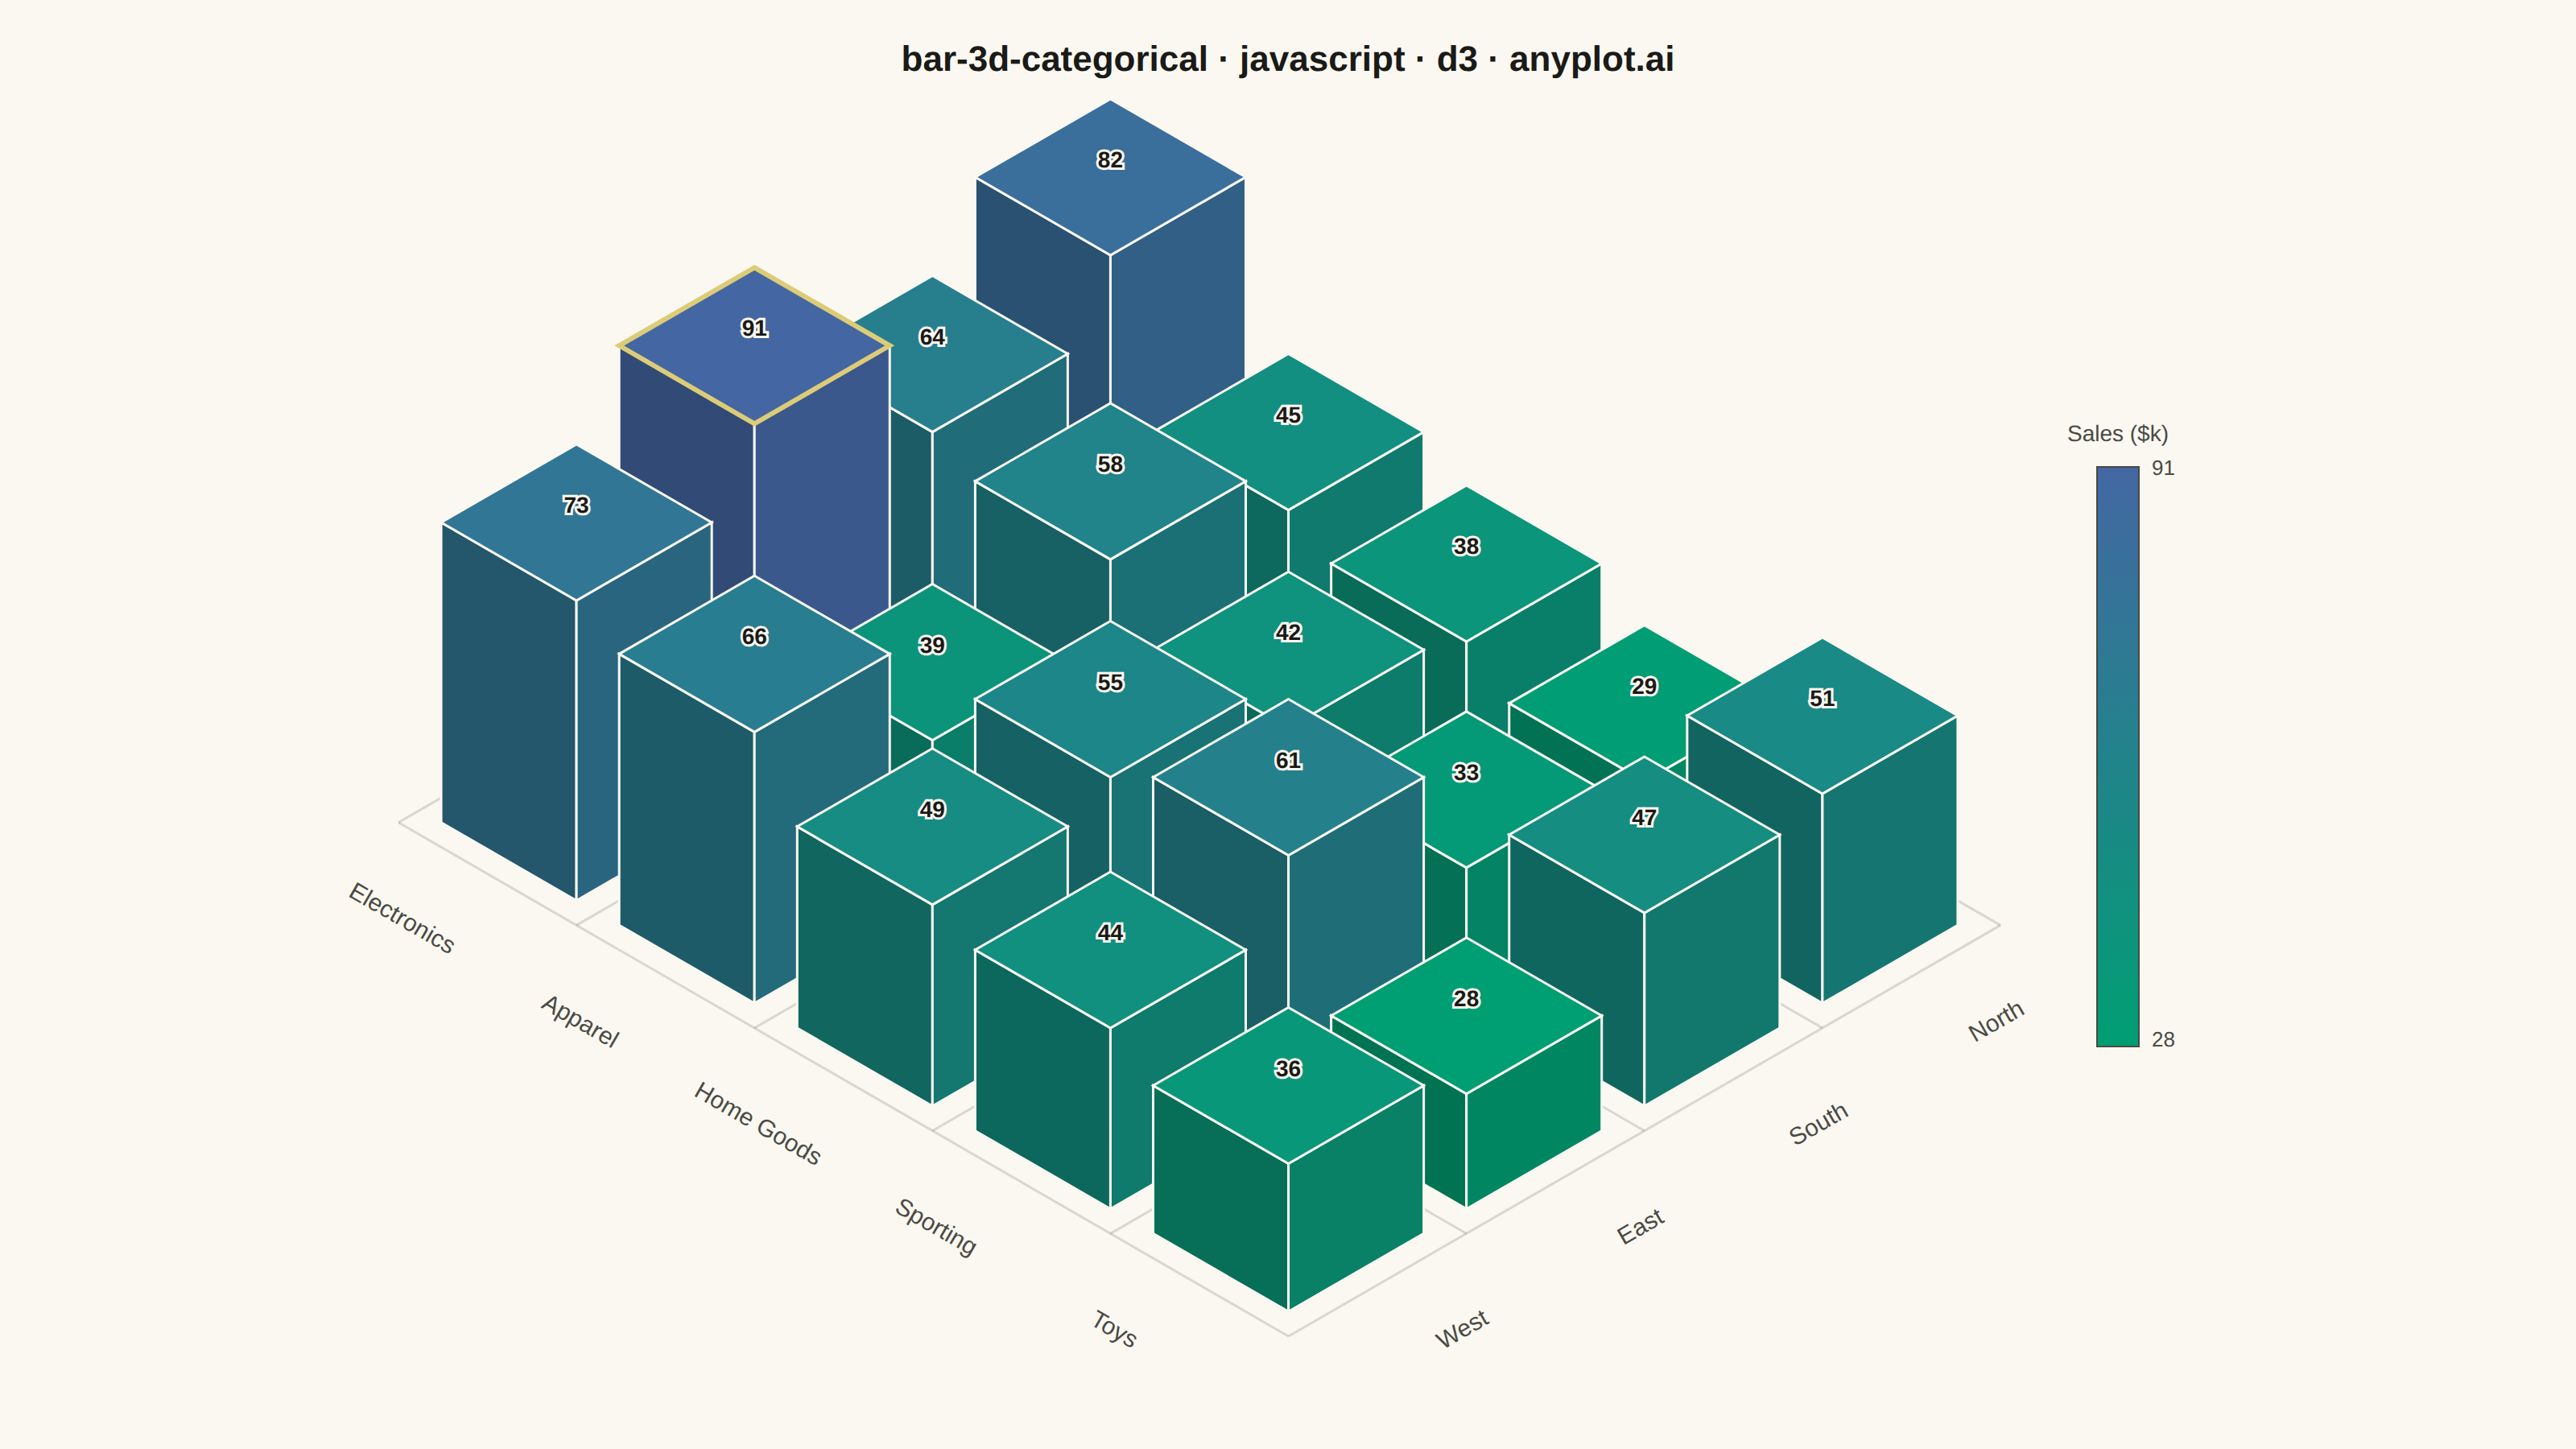
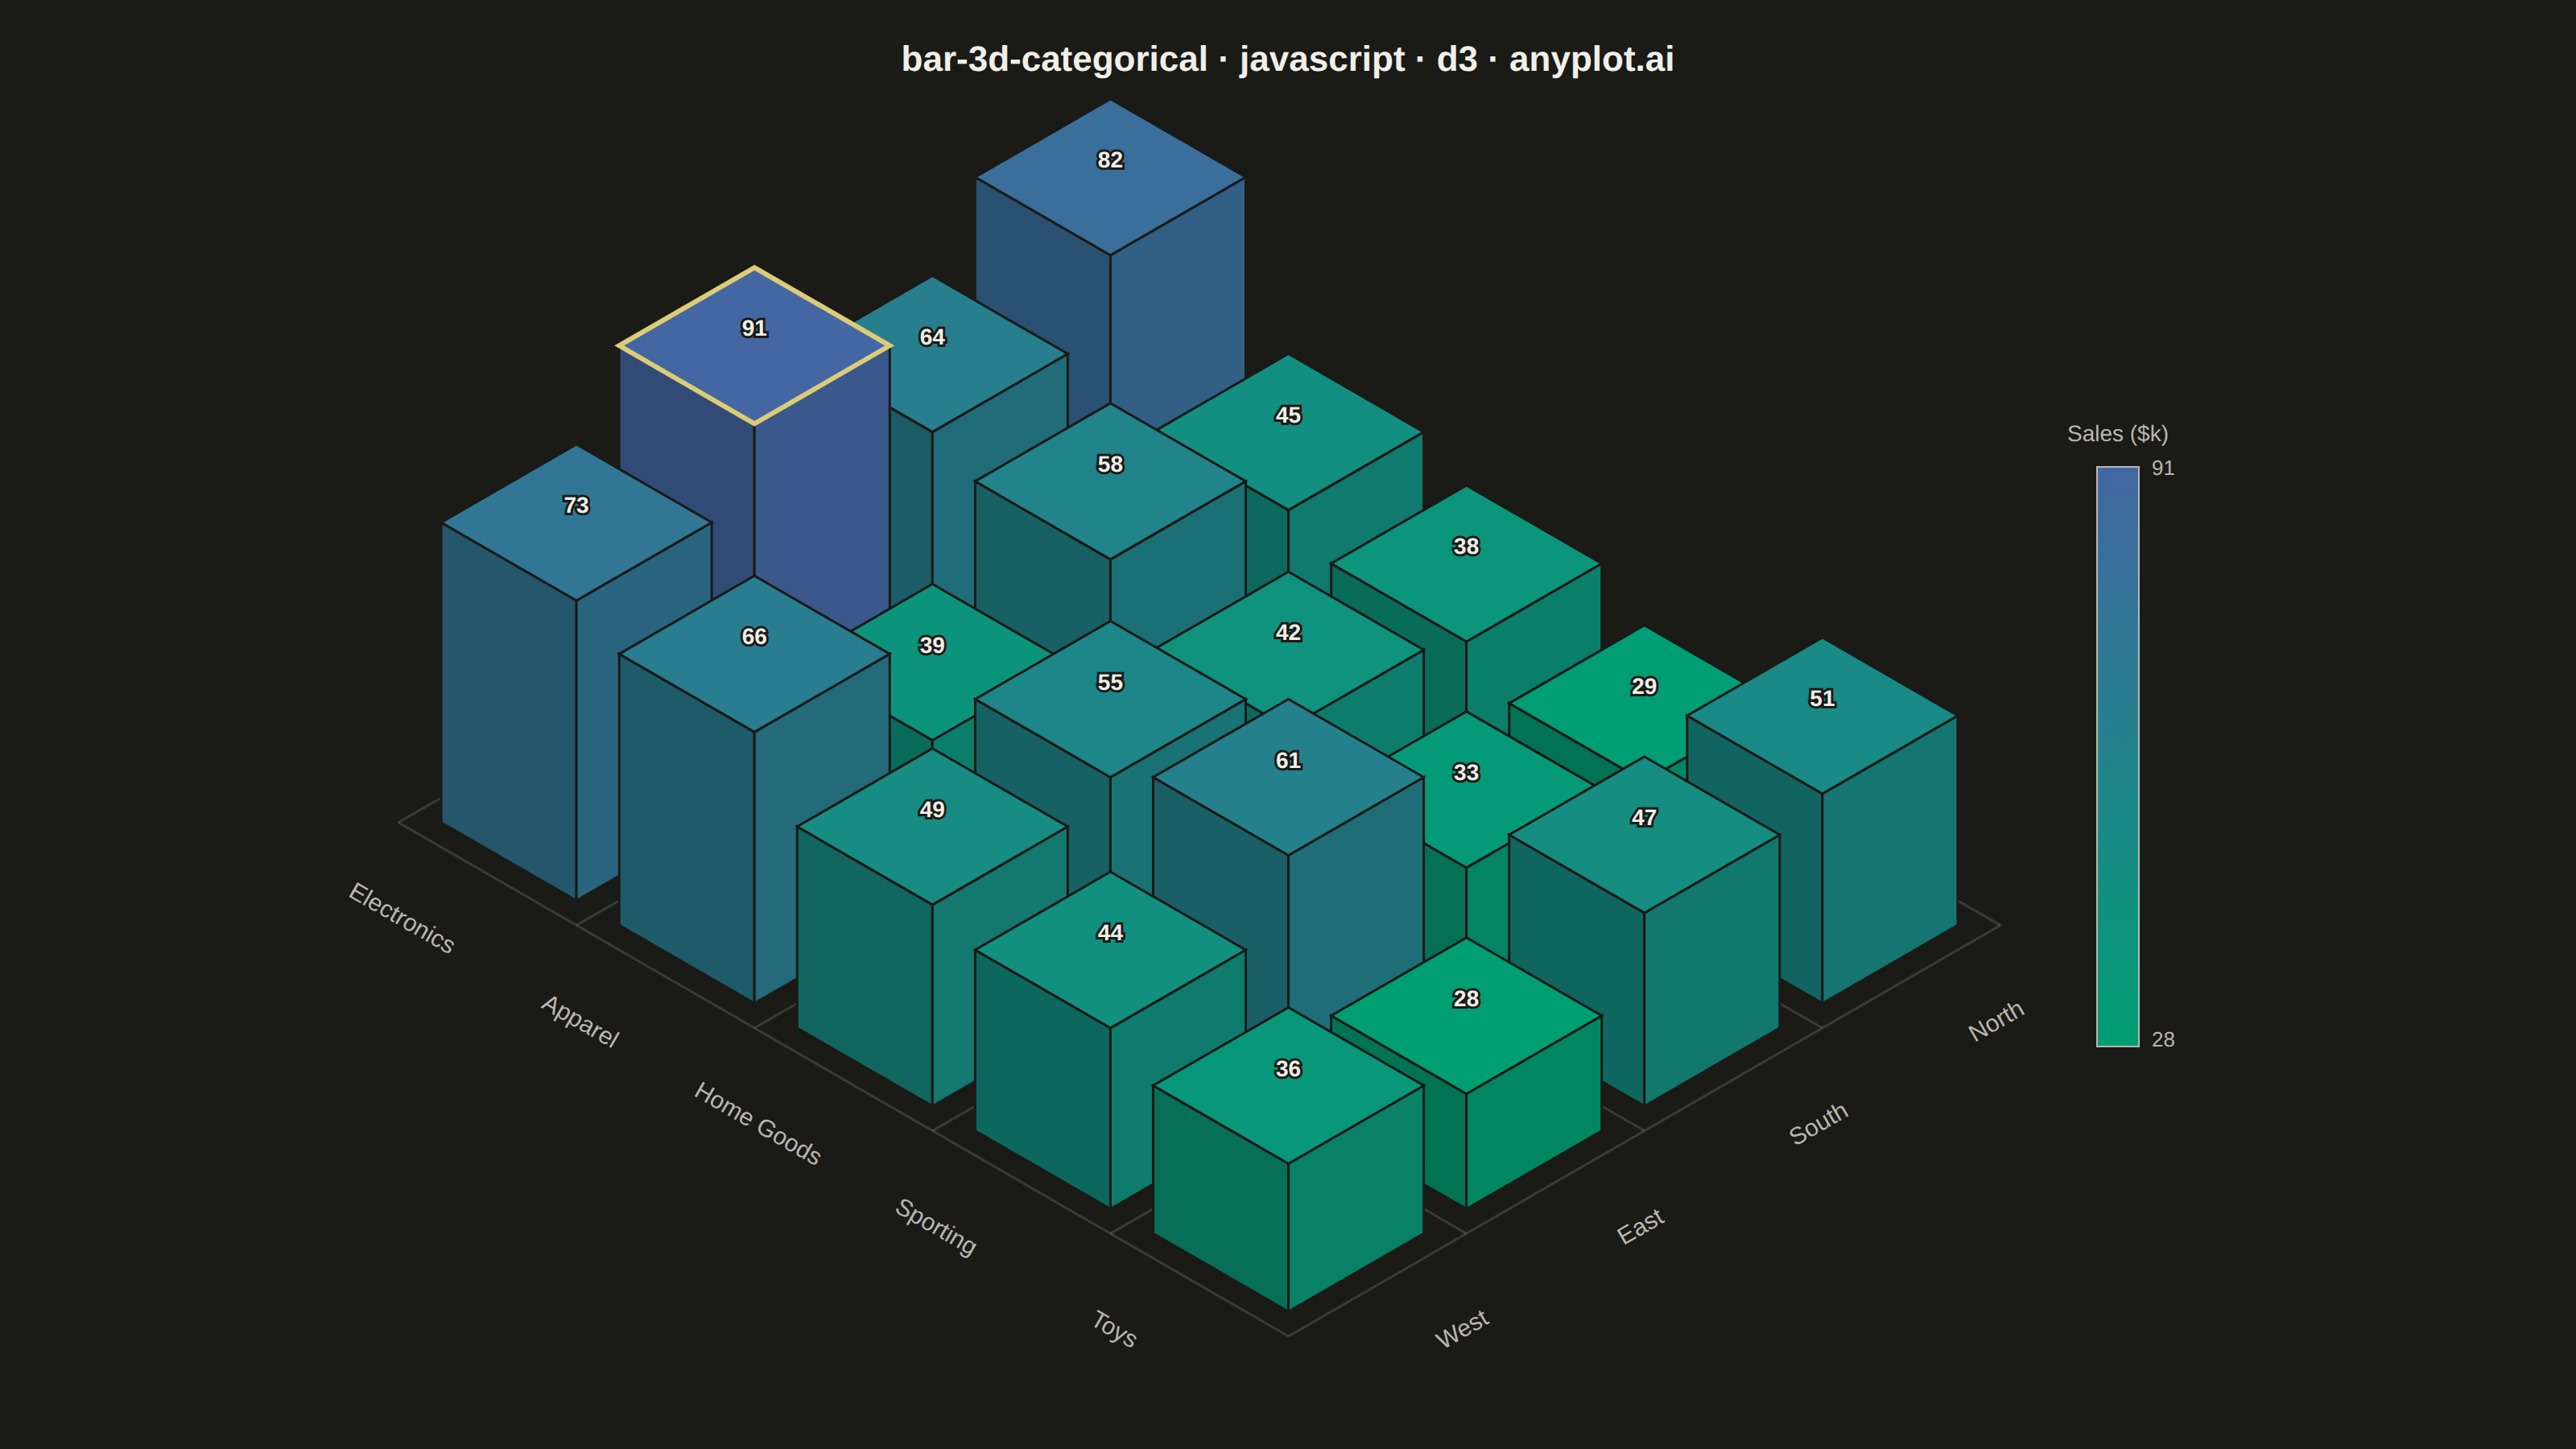
A three-dimensional bar chart where bars rise from a 2D categorical grid, with height encoding the measured value. Two categorical axes define the grid position on the base plane while the vertical axis shows magnitude. This visualization extends the bar chart family into 3D space, making it effective for comparing values across two categorical dimensions simultaneously.
// anyplot.ai
// bar-3d-categorical: 3D Bar Chart for Categorical Comparison
// Library: d3 7.9.0 | JavaScript 22.23.2
// Quality: 91/100 | Created: 2026-09-04

const t = window.ANYPLOT_TOKENS;
const { width, height } = window.ANYPLOT_SIZE;

// --- Data (in-memory, deterministic) ----------------------------------------
// Quarterly sales ($k) across product category (x) and sales region (y).
const xCategories = ["Electronics", "Apparel", "Home Goods", "Sporting", "Toys"];
const yCategories = ["North", "South", "East", "West"];
const values = [
  [82, 45, 38, 29, 51],
  [64, 58, 42, 33, 47],
  [91, 39, 55, 61, 28],
  [73, 66, 49, 44, 36],
];
const bars = [];
for (let iy = 0; iy < yCategories.length; iy++) {
  for (let ix = 0; ix < xCategories.length; ix++) {
    bars.push({ ix, iy, value: values[iy][ix] });
  }
}
const minValue = d3.min(bars, (d) => d.value);
const maxValue = d3.max(bars, (d) => d.value);

// --- Isometric projection ----------------------------------------------------
// Elevation/azimuth are named, adjustable parameters (spec calls for a ~30deg
// elevation / ~45deg azimuth default view); this symmetric 30deg decomposition
// of both grid axes reproduces that read while keeping the base plane fully
// legible.
const nCols = xCategories.length;
const nRows = yCategories.length;
const ELEVATION_DEG = 30;
const angle = (ELEVATION_DEG * Math.PI) / 180;
const cosA = Math.cos(angle);
const sinA = Math.sin(angle);
const HEIGHT_RATIO = 0.02; // px of bar height per $k, per unit of cellSize

function isoUnit(px, py) {
  return { x: (px - py) * cosA, y: (px + py) * sinA };
}

// Auto-fit the composition to the canvas: measure the projected footprint at
// unit scale (grid corners, category-label anchors, and bar tops), then solve
// for the cellSize/origin that centers it in the available plot area. This
// keeps the grid+legend balanced regardless of category count or data range,
// instead of hard-coding a cellSize/origin that only fits one dataset.
const gridCorners = [isoUnit(0, 0), isoUnit(nCols, 0), isoUnit(0, nRows), isoUnit(nCols, nRows)];
const xLabelPoints = xCategories.map((_, ix) => isoUnit(ix + 0.5, nRows + 0.5));
const yLabelPoints = yCategories.map((_, iy) => isoUnit(nCols + 0.5, iy + 0.5));
const chromePoints = [...gridCorners, ...xLabelPoints, ...yLabelPoints];
const barTopYUnits = bars.map((d) => (d.ix + 0.5 + (d.iy + 0.5)) * sinA - d.value * HEIGHT_RATIO);

const baseMinY = d3.min(gridCorners, (p) => p.y);
const baseMaxY = d3.max(gridCorners, (p) => p.y);
const rawMinX = d3.min(chromePoints, (p) => p.x);
const rawMaxX = d3.max(chromePoints, (p) => p.x);
const rawMinY = Math.min(d3.min(chromePoints, (p) => p.y), d3.min(barTopYUnits));
const rawMaxY = d3.max(chromePoints, (p) => p.y);
const rawWidth = rawMaxX - rawMinX;
const rawHeight = rawMaxY - rawMinY;

const margin = { top: 110, bottom: 70, left: 90, right: 50 };
const legendGap = 60;
const legendFootprint = 90;
const plotAreaWidth = width - margin.left - margin.right - legendGap - legendFootprint;
const plotAreaHeight = height - margin.top - margin.bottom;

const cellSize = Math.min(plotAreaWidth / rawWidth, plotAreaHeight / rawHeight);
const heightScale = cellSize * HEIGHT_RATIO;
const originX = margin.left - rawMinX * cellSize + (plotAreaWidth - rawWidth * cellSize) / 2;
const originY = margin.top - rawMinY * cellSize + (plotAreaHeight - rawHeight * cellSize) / 2;

function iso(px, py) {
  return {
    x: originX + (px - py) * cellSize * cosA,
    y: originY + (px + py) * cellSize * sinA,
  };
}
function pts(corners) {
  return corners.map((p) => `${p.x},${p.y}`).join(" ");
}

// --- Color: sequential Imprint scale encodes value magnitude ----------------
const colorScale = d3.scaleSequential(d3.interpolateRgbBasis(t.seq)).domain([minValue, maxValue]);

// --- SVG mount ----------------------------------------------------------------
const svg = d3.select("#container").append("svg").attr("width", width).attr("height", height);

const defs = svg.append("defs");
const gradient = defs
  .append("linearGradient")
  .attr("id", "seqGradient")
  .attr("x1", "0%")
  .attr("y1", "100%")
  .attr("x2", "0%")
  .attr("y2", "0%");
d3.range(0, 1.0001, 0.1).forEach((f) => {
  gradient
    .append("stop")
    .attr("offset", `${f * 100}%`)
    .attr("stop-color", colorScale(minValue + f * (maxValue - minValue)));
});

// --- Base-plane grid ----------------------------------------------------------
const gridGroup = svg.append("g");
for (let i = 0; i <= nCols; i++) {
  const a = iso(i, 0);
  const b = iso(i, nRows);
  gridGroup.append("line").attr("x1", a.x).attr("y1", a.y).attr("x2", b.x).attr("y2", b.y);
}
for (let j = 0; j <= nRows; j++) {
  const a = iso(0, j);
  const b = iso(nCols, j);
  gridGroup.append("line").attr("x1", a.x).attr("y1", a.y).attr("x2", b.x).attr("y2", b.y);
}
gridGroup.selectAll("line").attr("stroke", t.grid).attr("stroke-width", 1.5);

// --- Bars (painter's algorithm: back-to-front by grid depth) ----------------
const barGroup = svg.append("g");
const hw = 0.38; // half-width of footprint, leaves spacing between bars
const sorted = [...bars].sort((a, b) => a.ix + a.iy - (b.ix + b.iy));
let maxBarTopFace = null; // captured for a subtle focal-point highlight below

for (const d of sorted) {
  const cx = d.ix + 0.5;
  const cy = d.iy + 0.5;
  const baseTL = iso(cx - hw, cy - hw);
  const baseTR = iso(cx + hw, cy - hw);
  const baseBR = iso(cx + hw, cy + hw);
  const baseBL = iso(cx - hw, cy + hw);
  const barH = d.value * heightScale;
  const raise = (p) => ({ x: p.x, y: p.y - barH });
  const topTL = raise(baseTL);
  const topTR = raise(baseTR);
  const topBR = raise(baseBR);
  const topBL = raise(baseBL);

  const base = d3.color(colorScale(d.value));
  const g = barGroup.append("g");
  g.append("polygon")
    .attr("points", pts([baseBL, baseBR, topBR, topBL]))
    .attr("fill", base.darker(0.9))
    .attr("stroke", t.pageBg)
    .attr("stroke-width", 1.5);
  g.append("polygon")
    .attr("points", pts([baseTR, baseBR, topBR, topTR]))
    .attr("fill", base.darker(0.45))
    .attr("stroke", t.pageBg)
    .attr("stroke-width", 1.5);
  g.append("polygon")
    .attr("points", pts([topTL, topTR, topBR, topBL]))
    .attr("fill", base)
    .attr("stroke", t.pageBg)
    .attr("stroke-width", 1.5);

  const labelY = (topTL.y + topBR.y) / 2 - 6;
  const labelX = (topTL.x + topBR.x) / 2;
  g.append("text")
    .attr("x", labelX)
    .attr("y", labelY)
    .attr("text-anchor", "middle")
    .style("font-size", "14px")
    .style("font-weight", "600")
    .style("paint-order", "stroke")
    .style("stroke", t.pageBg)
    .style("stroke-width", "3px")
    .attr("fill", t.ink)
    .text(d.value);

  if (d.value === maxValue) {
    maxBarTopFace = [topTL, topTR, topBR, topBL];
  }
}

// --- Focal-point highlight: ring the single highest-value bar so the color
// ramp is not the only cue for hierarchy. ---------------------------------
if (maxBarTopFace) {
  barGroup
    .append("polygon")
    .attr("points", pts(maxBarTopFace))
    .attr("fill", "none")
    .attr("stroke", t.amber)
    .attr("stroke-width", 3);
}

// --- Category axis labels (along the two front grid edges) ------------------
const labelGroup = svg.append("g");
xCategories.forEach((name, ix) => {
  const p = iso(ix + 0.5, nRows + 0.5);
  labelGroup
    .append("text")
    .attr("transform", `translate(${p.x},${p.y}) rotate(30)`)
    .attr("text-anchor", "middle")
    .style("font-size", "15px")
    .attr("fill", t.inkSoft)
    .text(name);
});
yCategories.forEach((name, iy) => {
  const p = iso(nCols + 0.5, iy + 0.5);
  labelGroup
    .append("text")
    .attr("transform", `translate(${p.x},${p.y}) rotate(-30)`)
    .attr("text-anchor", "middle")
    .style("font-size", "15px")
    .attr("fill", t.inkSoft)
    .text(name);
});

// --- Color legend (value magnitude -> Imprint sequential scale) ------------
// Positioned relative to the fitted grid's right edge (not a fixed offset
// from the canvas edge) so it stays snug against the composition at any scale.
const gridRightX = originX + rawMaxX * cellSize;
const legendX = gridRightX + legendGap;
const legendW = 26;
const legendH = plotAreaHeight * 0.5;
const legendY = margin.top + (plotAreaHeight - legendH) / 2;
svg
  .append("rect")
  .attr("x", legendX)
  .attr("y", legendY)
  .attr("width", legendW)
  .attr("height", legendH)
  .attr("fill", "url(#seqGradient)")
  .attr("stroke", t.inkSoft)
  .attr("stroke-width", 1);
svg
  .append("text")
  .attr("x", legendX + legendW / 2)
  .attr("y", legendY - 16)
  .attr("text-anchor", "middle")
  .style("font-size", "14px")
  .attr("fill", t.inkSoft)
  .text("Sales ($k)");
svg
  .append("text")
  .attr("x", legendX + legendW + 8)
  .attr("y", legendY + 5)
  .style("font-size", "13px")
  .attr("fill", t.inkSoft)
  .text(maxValue);
svg
  .append("text")
  .attr("x", legendX + legendW + 8)
  .attr("y", legendY + legendH)
  .style("font-size", "13px")
  .attr("fill", t.inkSoft)
  .text(minValue);

// --- Title --------------------------------------------------------------------
svg
  .append("text")
  .attr("x", width / 2)
  .attr("y", 44)
  .attr("text-anchor", "middle")
  .attr("fill", t.ink)
  .style("font-size", "22px")
  .style("font-weight", "600")
  .text("bar-3d-categorical · javascript · d3 · anyplot.ai");
Runnable source as JSON, for any HTTP client: https://api.anyplot.ai/specs/bar-3d-categorical/d3/code. Any spec id and library id listed in llms-full.txt fit the same URL shape; every URL below is complete and callable.
{
  "spec_id": "bar-3d-categorical",
  "language": "javascript",
  "library": "d3",
  "page": "https://anyplot.ai/bar-3d-categorical/javascript/d3",
  "hub": "https://anyplot.ai/bar-3d-categorical",
  "code_json": "https://api.anyplot.ai/specs/bar-3d-categorical/d3/code",
  "spec_json": "https://api.anyplot.ai/specs/bar-3d-categorical",
  "render_light_png": "https://storage.googleapis.com/anyplot-images/plots/bar-3d-categorical/javascript/d3/plot-light.png",
  "render_dark_png": "https://storage.googleapis.com/anyplot-images/plots/bar-3d-categorical/javascript/d3/plot-dark.png",
  "interactive_light_html": "https://storage.googleapis.com/anyplot-images/plots/bar-3d-categorical/javascript/d3/plot-light.html",
  "interactive_dark_html": "https://storage.googleapis.com/anyplot-images/plots/bar-3d-categorical/javascript/d3/plot-dark.html",
  "quality_score": 91.0,
  "license": "MIT",
  "guide": "https://anyplot.ai/llms.txt"
}
Part of 3D Bar Chart for Categorical Comparison on anyplot.ai.