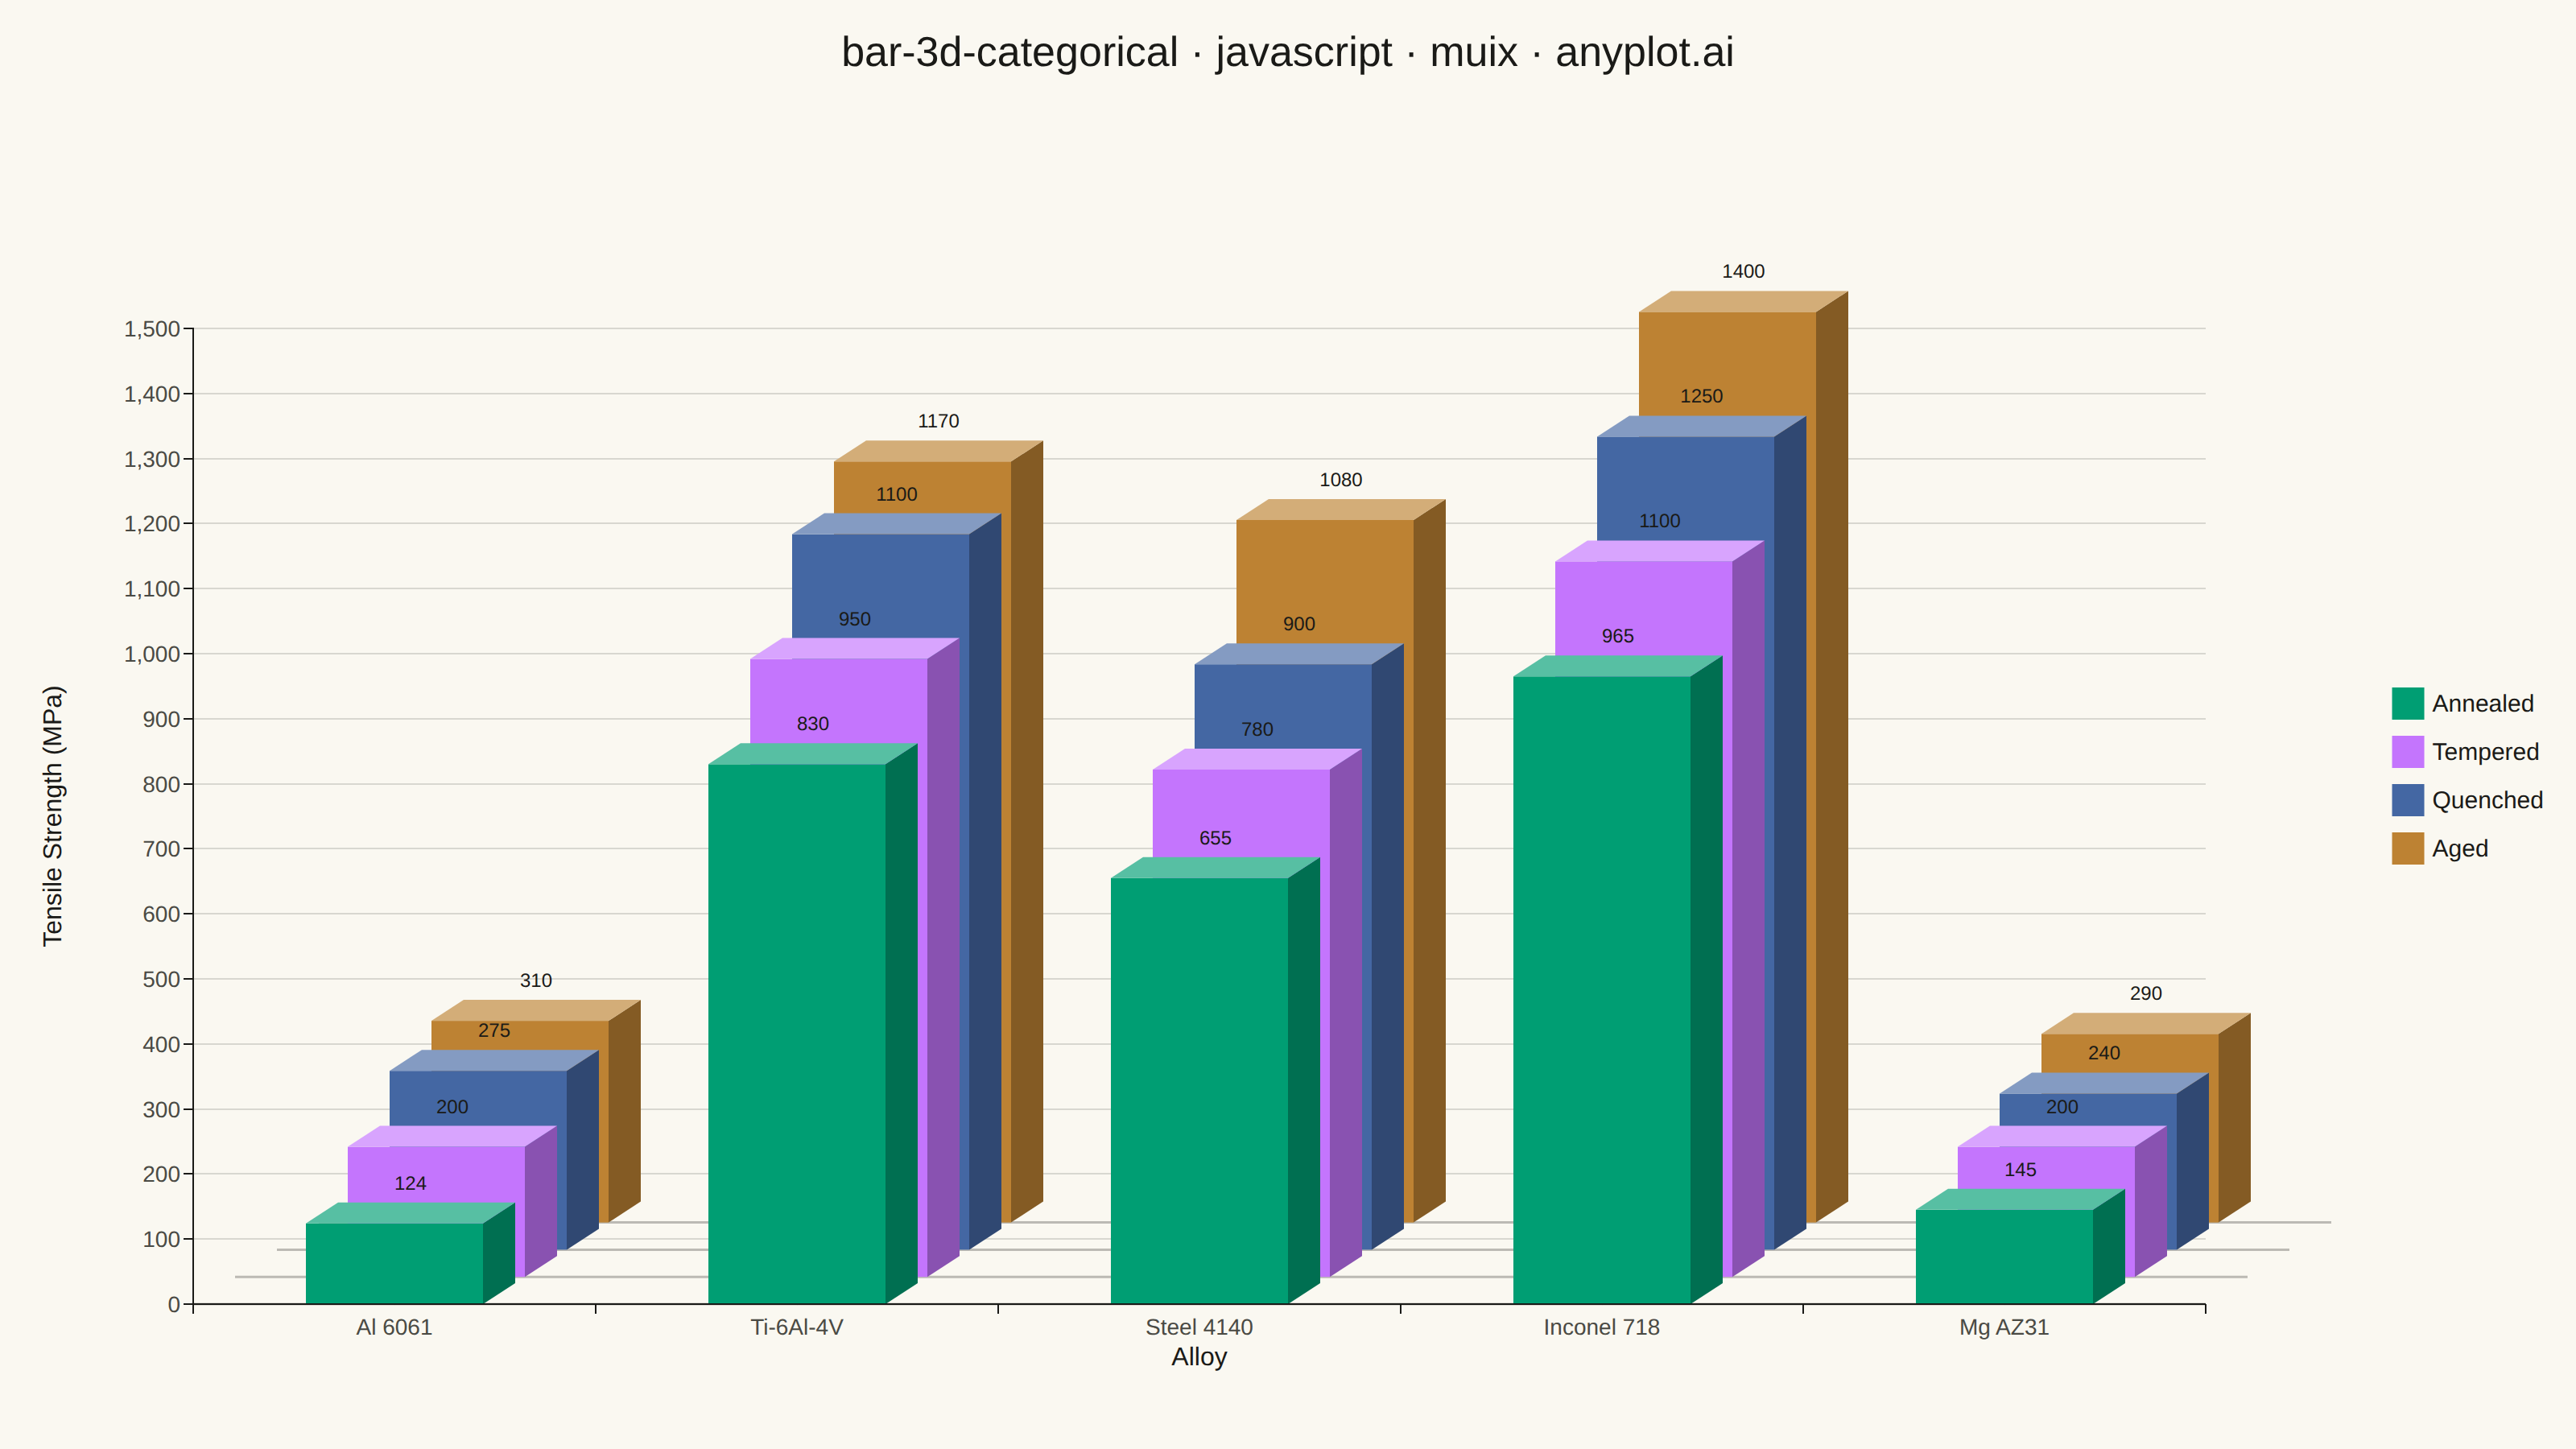
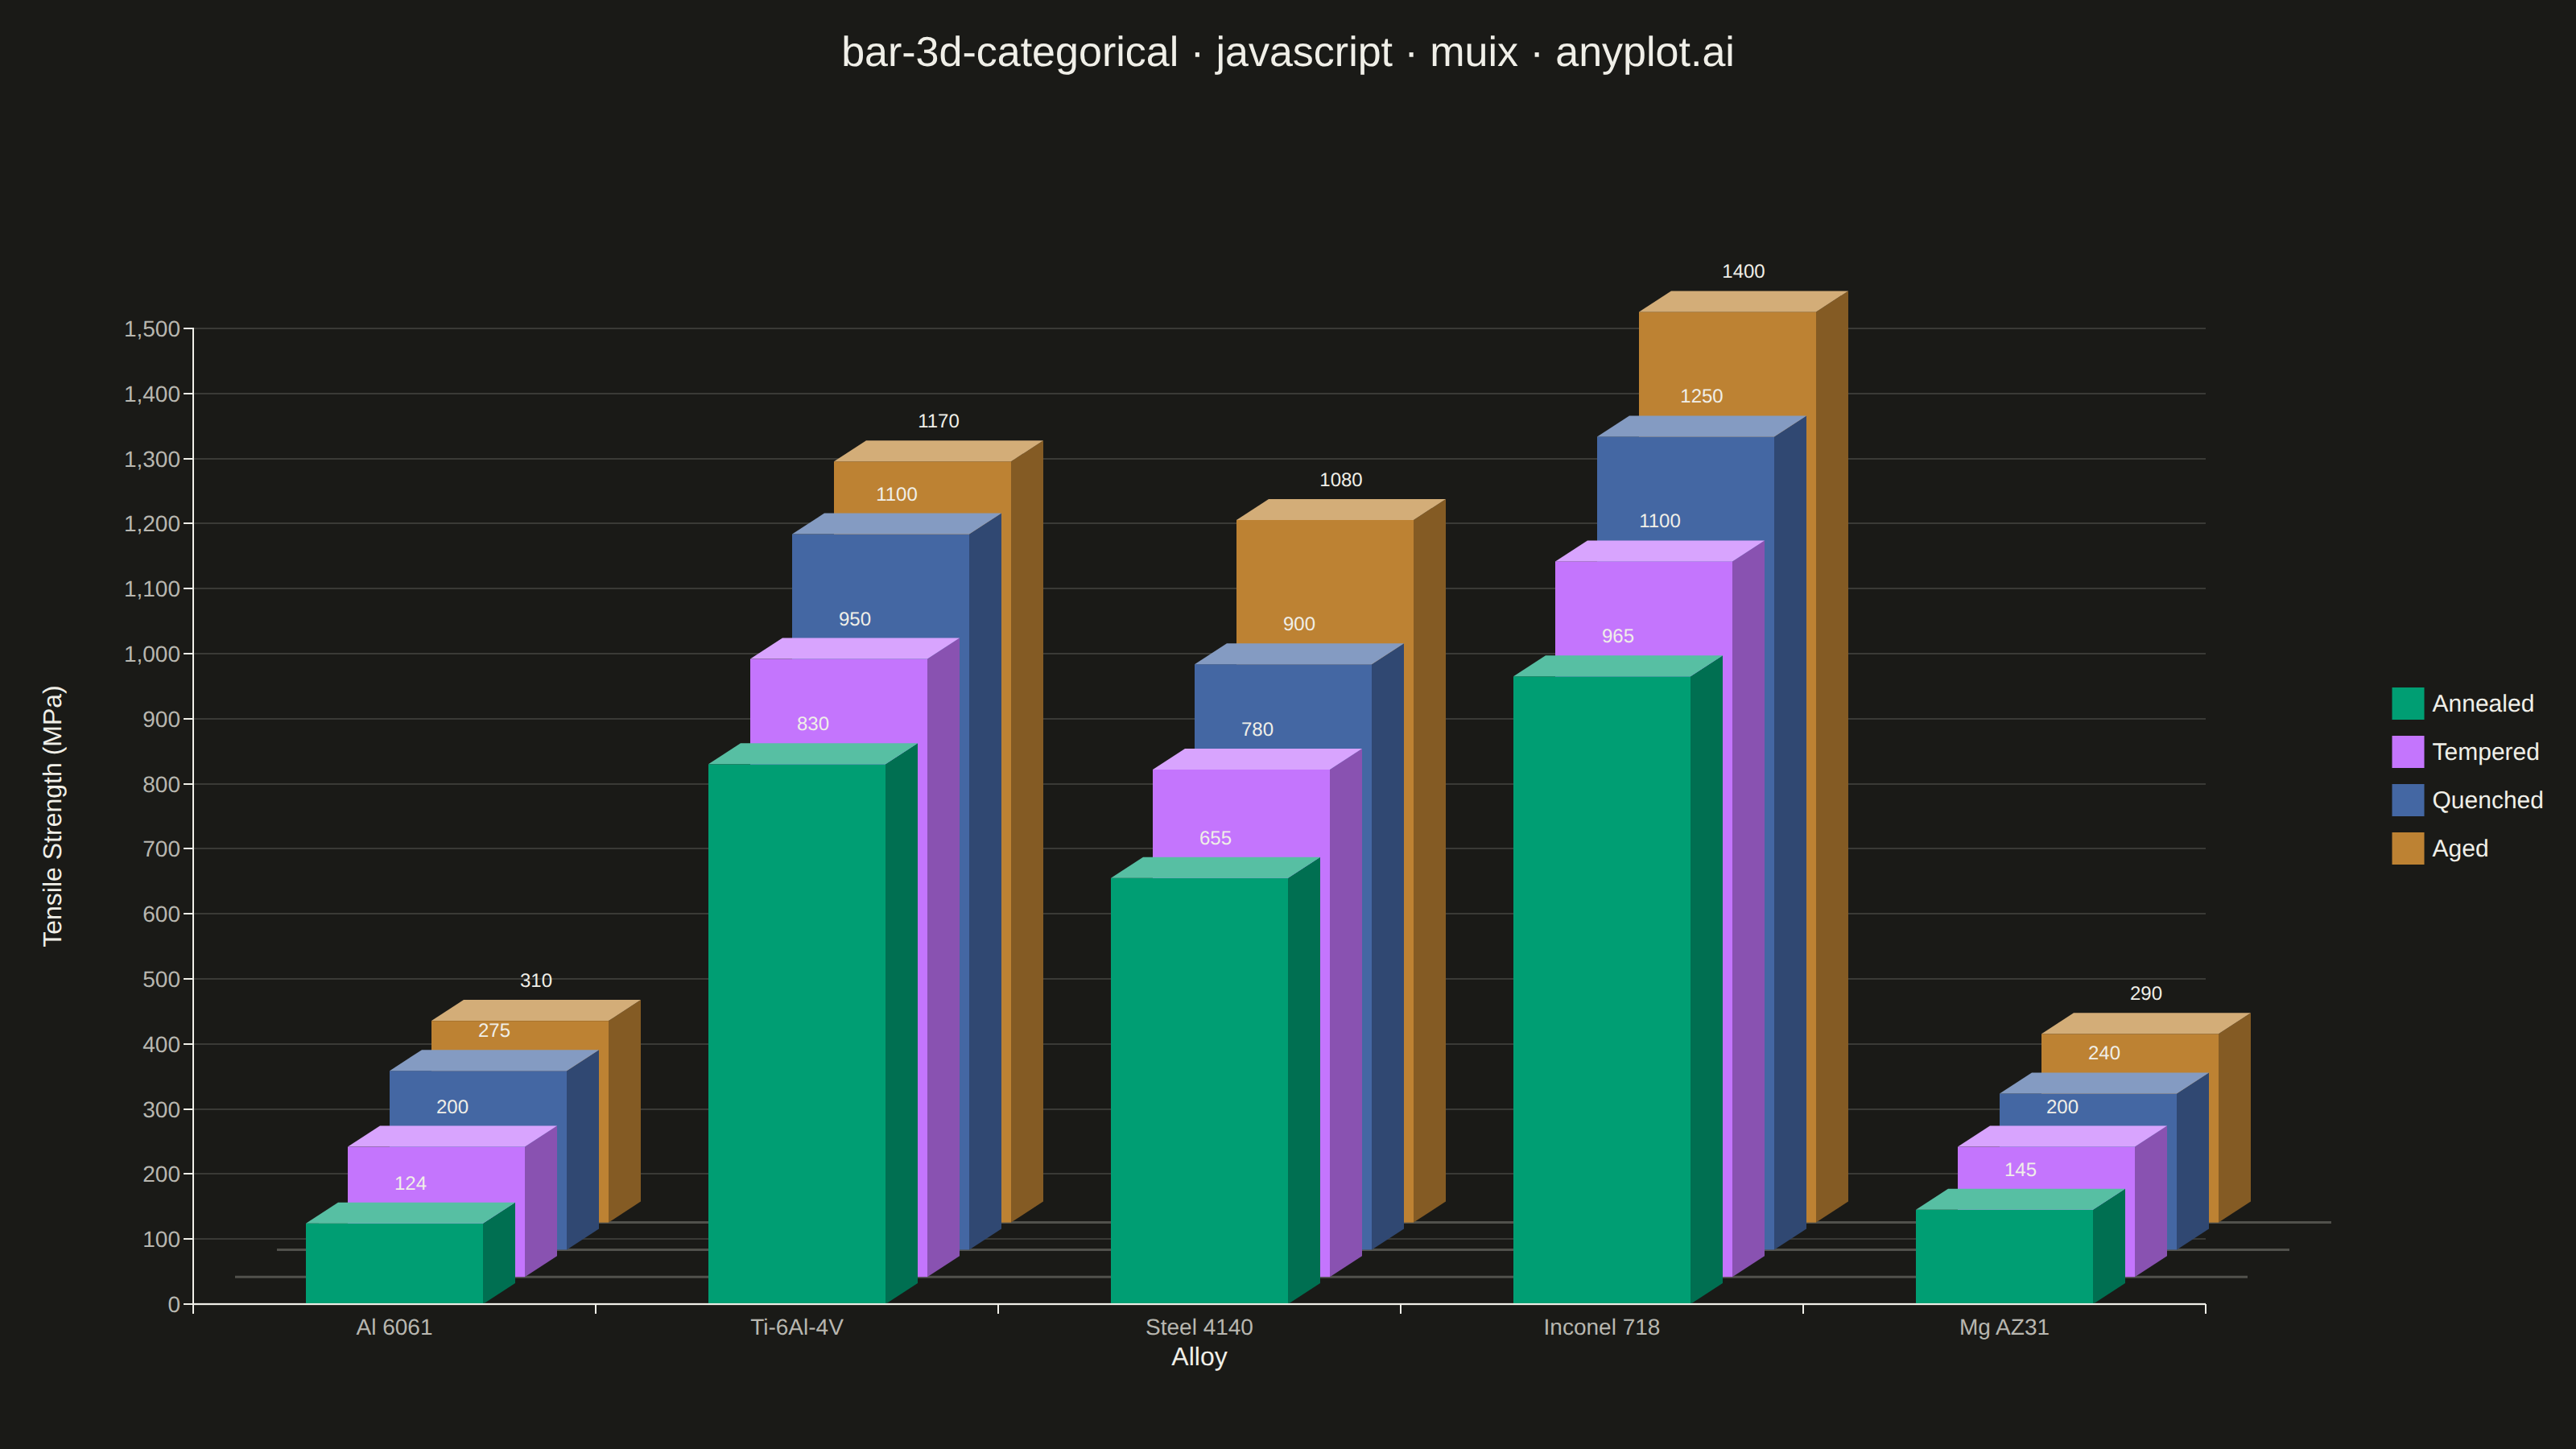
The same plot in 13 other libraries — JavaScript: Chart.js, D3.js, Apache ECharts; Python: Altair, Bokeh, lets-plot, Matplotlib, Plotly, plotnine, Pygal, Seaborn; R: ggplot2; Julia: Makie.jl. Compare all 14 side by side: 3D Bar Chart for Categorical Comparison in Python, R, Julia and JavaScript.
A three-dimensional bar chart where bars rise from a 2D categorical grid, with height encoding the measured value. Two categorical axes define the grid position on the base plane while the vertical axis shows magnitude. This visualization extends the bar chart family into 3D space, making it effective for comparing values across two categorical dimensions simultaneously.
// anyplot.ai
// bar-3d-categorical: 3D Bar Chart for Categorical Comparison
// Library: muix 7.29.1 | JavaScript 22.23.2
// Quality: 95/100 | Created: 2026-09-04
//# anyplot-orientation: landscape
// anyplot.ai
// bar-3d-categorical: 3D Bar Chart for Categorical Comparison
// Library: MUI X Charts | React | Node 22
// License: @mui/x-charts — MIT (community). Pro/Premium are out of scope.
// Quality: 88/100 | Created: 2026-09-04
import { ChartContainer } from "@mui/x-charts/ChartContainer";
import { ChartsXAxis } from "@mui/x-charts/ChartsXAxis";
import { ChartsYAxis } from "@mui/x-charts/ChartsYAxis";
import { ChartsGrid } from "@mui/x-charts/ChartsGrid";
import { ChartsLegend } from "@mui/x-charts/ChartsLegend";
import { ChartsText } from "@mui/x-charts/ChartsText";
import { useXScale, useYScale, useDrawingArea } from "@mui/x-charts/hooks";

const t = window.ANYPLOT_TOKENS;

// --- Data (in-memory, deterministic) ----------------------------------------
// Factorial-design experiment: tensile strength across alloy × heat-treatment.
const alloys = ["Al 6061", "Ti-6Al-4V", "Steel 4140", "Inconel 718", "Mg AZ31"];
// Depth order runs weakest → strongest per alloy, so the row offset (which
// pushes further rows up-and-right) always reinforces the value-driven
// height difference between neighbors instead of fighting it — that keeps
// the value labels of adjacent rows from colliding even where two treatments
// land close together (see Al 6061 / Mg AZ31 below).
const treatments = ["Annealed", "Tempered", "Quenched", "Aged"];
// tensileStrengthMPa[treatmentIndex][alloyIndex], in MPa — strictly
// increasing down each column (alloy) from Annealed to Aged.
const tensileStrengthMPa = [
  [124, 830, 655, 965, 145], // Annealed
  [200, 950, 780, 1100, 200], // Tempered
  [275, 1100, 900, 1250, 240], // Quenched
  [310, 1170, 1080, 1400, 290], // Aged
];

const MAX_STRENGTH = 1500;
const ROW_COLORS = [t.palette[0], t.palette[1], t.palette[2], t.palette[3]];

const series = treatments.map((label, i) => ({
  type: "bar",
  id: label,
  label,
  data: alloys.map((_, j) => tensileStrengthMPa[i][j]),
  color: ROW_COLORS[i],
}));

// Isometric depth vector, in CSS px within the mount's coordinate space —
// this is each cuboid's own front-to-back thickness.
const ISO_DX = 20;
const ISO_DY = -13;

// Per-treatment row stagger: slightly larger than the cuboid depth vector so
// consecutive rows don't sit edge-to-edge — the extra step opens a thin gap
// between the back face of one row and the front face of the next, per the
// spec's "slight spacing between them for visual clarity and depth
// perception".
const STAGGER_DX = ISO_DX * 1.3;
const STAGGER_DY = ISO_DY * 1.3;

const TITLE = "bar-3d-categorical · javascript · muix · anyplot.ai";
const TITLE_HEIGHT = 64;
const MARGIN = { top: 140, right: 230, bottom: 90, left: 120 };

function shade(hex, amount) {
  const num = parseInt(hex.slice(1), 16);
  const r = (num >> 16) & 0xff;
  const g = (num >> 8) & 0xff;
  const b = num & 0xff;
  const target = amount > 0 ? 255 : 0;
  const k = Math.abs(amount);
  const mix = (c) => Math.round(c + (target - c) * k);
  return `rgb(${mix(r)}, ${mix(g)}, ${mix(b)})`;
}

// --- Custom Y-axis title -----------------------------------------------------
// ChartsYAxis's own `label` places the rotated title at a fixed
// `tickFontSize + tickSize + 10` offset from the axis line (ChartsYAxis.js),
// which assumes short tick text; it collides with wide numeric tick labels
// like "1,500". Rendering the title separately with a hand-picked offset
// sidesteps that.
function YAxisTitle() {
  const { top, height } = useDrawingArea();
  return (
    <ChartsText
      x={38}
      y={top + height / 2}
      text="Tensile Strength (MPa)"
      style={{ fontSize: 16, fill: t.ink, fontWeight: 500, textAnchor: "middle", dominantBaseline: "auto", angle: -90 }}
    />
  );
}

// --- Custom overlay: a 2D categorical grid (alloy × treatment) rendered as
// isometric cuboids, height-encoded by value. Community `@mui/x-charts/hooks`
// (useXScale/useYScale) map data coordinates to pixels so the grid stays
// aligned with the axes at any size — the same composition pattern used for
// mohr-circle's custom geometry, applied here to a chart type (3D bars) the
// declarative BarChart can't express on its own. -----------------------------
function Bars3D() {
  const xScale = useXScale();
  const yScale = useYScale();
  const { left, width } = useDrawingArea();
  const bandwidth = xScale.bandwidth();
  const barWidth = bandwidth * 0.55;
  const baseline = yScale(0);

  // Paint back row first so nearer (lower-index) rows correctly occlude it.
  const paintOrder = [...treatments.keys()].sort((a, b) => b - a);

  // Base-plane grid: faint iso-projected floor lines tying each bar back to
  // its (alloy, treatment) cell — one receding line per treatment depth, and
  // one line per alloy running front-to-back through all four depths.
  const floorRowLines = treatments.map((_, row) => {
    const dx = row * STAGGER_DX;
    const dy = row * STAGGER_DY;
    return (
      <line
        key={`row-${row}`}
        x1={left + dx}
        y1={baseline + dy}
        x2={left + width + dx}
        y2={baseline + dy}
        stroke={t.inkSoft}
        strokeWidth={1.5}
        opacity={0.35}
      />
    );
  });
  const floorColumnLines = alloys.map((alloy) => {
    const cx = xScale(alloy) + bandwidth / 2;
    const points = treatments
      .map((_, row) => `${cx + row * STAGGER_DX},${baseline + row * STAGGER_DY}`)
      .join(" ");
    return (
      <polyline
        key={`col-${alloy}`}
        points={points}
        fill="none"
        stroke={t.inkSoft}
        strokeWidth={1.5}
        opacity={0.35}
      />
    );
  });

  return (
    <>
      <g>
        {floorRowLines}
        {floorColumnLines}
      </g>
      {paintOrder.map((row) => {
        const dx = row * STAGGER_DX;
        const dy = row * STAGGER_DY;
        const color = ROW_COLORS[row];
        const topColor = shade(color, 0.34);
        const sideColor = shade(color, -0.3);
        return (
          <g key={treatments[row]} transform={`translate(${dx}, ${dy})`}>
            {alloys.map((alloy, col) => {
              const value = tensileStrengthMPa[row][col];
              const x = xScale(alloy) + (bandwidth - barWidth) / 2;
              const y = yScale(value);
              const barHeight = baseline - y;
              const topFace = [
                `${x},${y}`,
                `${x + barWidth},${y}`,
                `${x + barWidth + ISO_DX},${y + ISO_DY}`,
                `${x + ISO_DX},${y + ISO_DY}`,
              ].join(" ");
              const sideFace = [
                `${x + barWidth},${y}`,
                `${x + barWidth},${y + barHeight}`,
                `${x + barWidth + ISO_DX},${y + barHeight + ISO_DY}`,
                `${x + barWidth + ISO_DX},${y + ISO_DY}`,
              ].join(" ");
              return (
                <g key={alloy}>
                  <rect x={x} y={y} width={barWidth} height={barHeight} fill={color} />
                  <polygon points={sideFace} fill={sideColor} />
                  <polygon points={topFace} fill={topColor} />
                  <ChartsText
                    x={x + barWidth / 2 + ISO_DX / 2}
                    y={y + ISO_DY - 8}
                    text={String(value)}
                    style={{ fontSize: 12, fill: t.ink, textAnchor: "middle", dominantBaseline: "auto" }}
                  />
                </g>
              );
            })}
          </g>
        );
      })}
    </>
  );
}

// --- Chart (default-exported component — the harness mounts it) -------------
export default function Chart() {
  const { width, height } = window.ANYPLOT_SIZE;
  const chartHeight = height - TITLE_HEIGHT;

  return (
    <div style={{ width, height, display: "flex", flexDirection: "column" }}>
      <div
        style={{
          height: TITLE_HEIGHT,
          display: "flex",
          alignItems: "center",
          justifyContent: "center",
          fontSize: 26,
          fontWeight: 500,
          color: t.ink,
          fontFamily: "'Roboto', 'Helvetica', 'Arial', sans-serif",
        }}
      >
        {TITLE}
      </div>
      <ChartContainer
        width={width}
        height={chartHeight}
        margin={MARGIN}
        skipAnimation
        series={series}
        xAxis={[{ scaleType: "band", data: alloys, label: "Alloy" }]}
        yAxis={[{ scaleType: "linear", min: 0, max: MAX_STRENGTH }]}
      >
        <ChartsGrid horizontal />
        <Bars3D />
        <ChartsXAxis
          labelStyle={{ fontSize: 16, fill: t.ink, fontWeight: 500 }}
          tickLabelStyle={{ fontSize: 14, fill: t.inkSoft }}
          stroke={t.inkSoft}
        />
        <ChartsYAxis tickLabelStyle={{ fontSize: 14, fill: t.inkSoft }} stroke={t.inkSoft} />
        <YAxisTitle />
        <ChartsLegend
          direction="column"
          position={{ horizontal: "right", vertical: "middle" }}
          labelStyle={{ fontSize: 15, fill: t.ink }}
        />
      </ChartContainer>
    </div>
  );
}
Runnable source as JSON, for any HTTP client: https://api.anyplot.ai/specs/bar-3d-categorical/muix/code. Any spec id and library id listed in llms-full.txt fit the same URL shape; every URL below is complete and callable.
{
  "spec_id": "bar-3d-categorical",
  "language": "javascript",
  "library": "muix",
  "page": "https://anyplot.ai/bar-3d-categorical/javascript/muix",
  "hub": "https://anyplot.ai/bar-3d-categorical",
  "code_json": "https://api.anyplot.ai/specs/bar-3d-categorical/muix/code",
  "spec_json": "https://api.anyplot.ai/specs/bar-3d-categorical",
  "render_light_png": "https://storage.googleapis.com/anyplot-images/plots/bar-3d-categorical/javascript/muix/plot-light.png",
  "render_dark_png": "https://storage.googleapis.com/anyplot-images/plots/bar-3d-categorical/javascript/muix/plot-dark.png",
  "interactive_light_html": "https://storage.googleapis.com/anyplot-images/plots/bar-3d-categorical/javascript/muix/plot-light.html",
  "interactive_dark_html": "https://storage.googleapis.com/anyplot-images/plots/bar-3d-categorical/javascript/muix/plot-dark.html",
  "quality_score": 95.0,
  "license": "MIT",
  "guide": "https://anyplot.ai/llms.txt"
}
Part of 3D Bar Chart for Categorical Comparison on anyplot.ai.