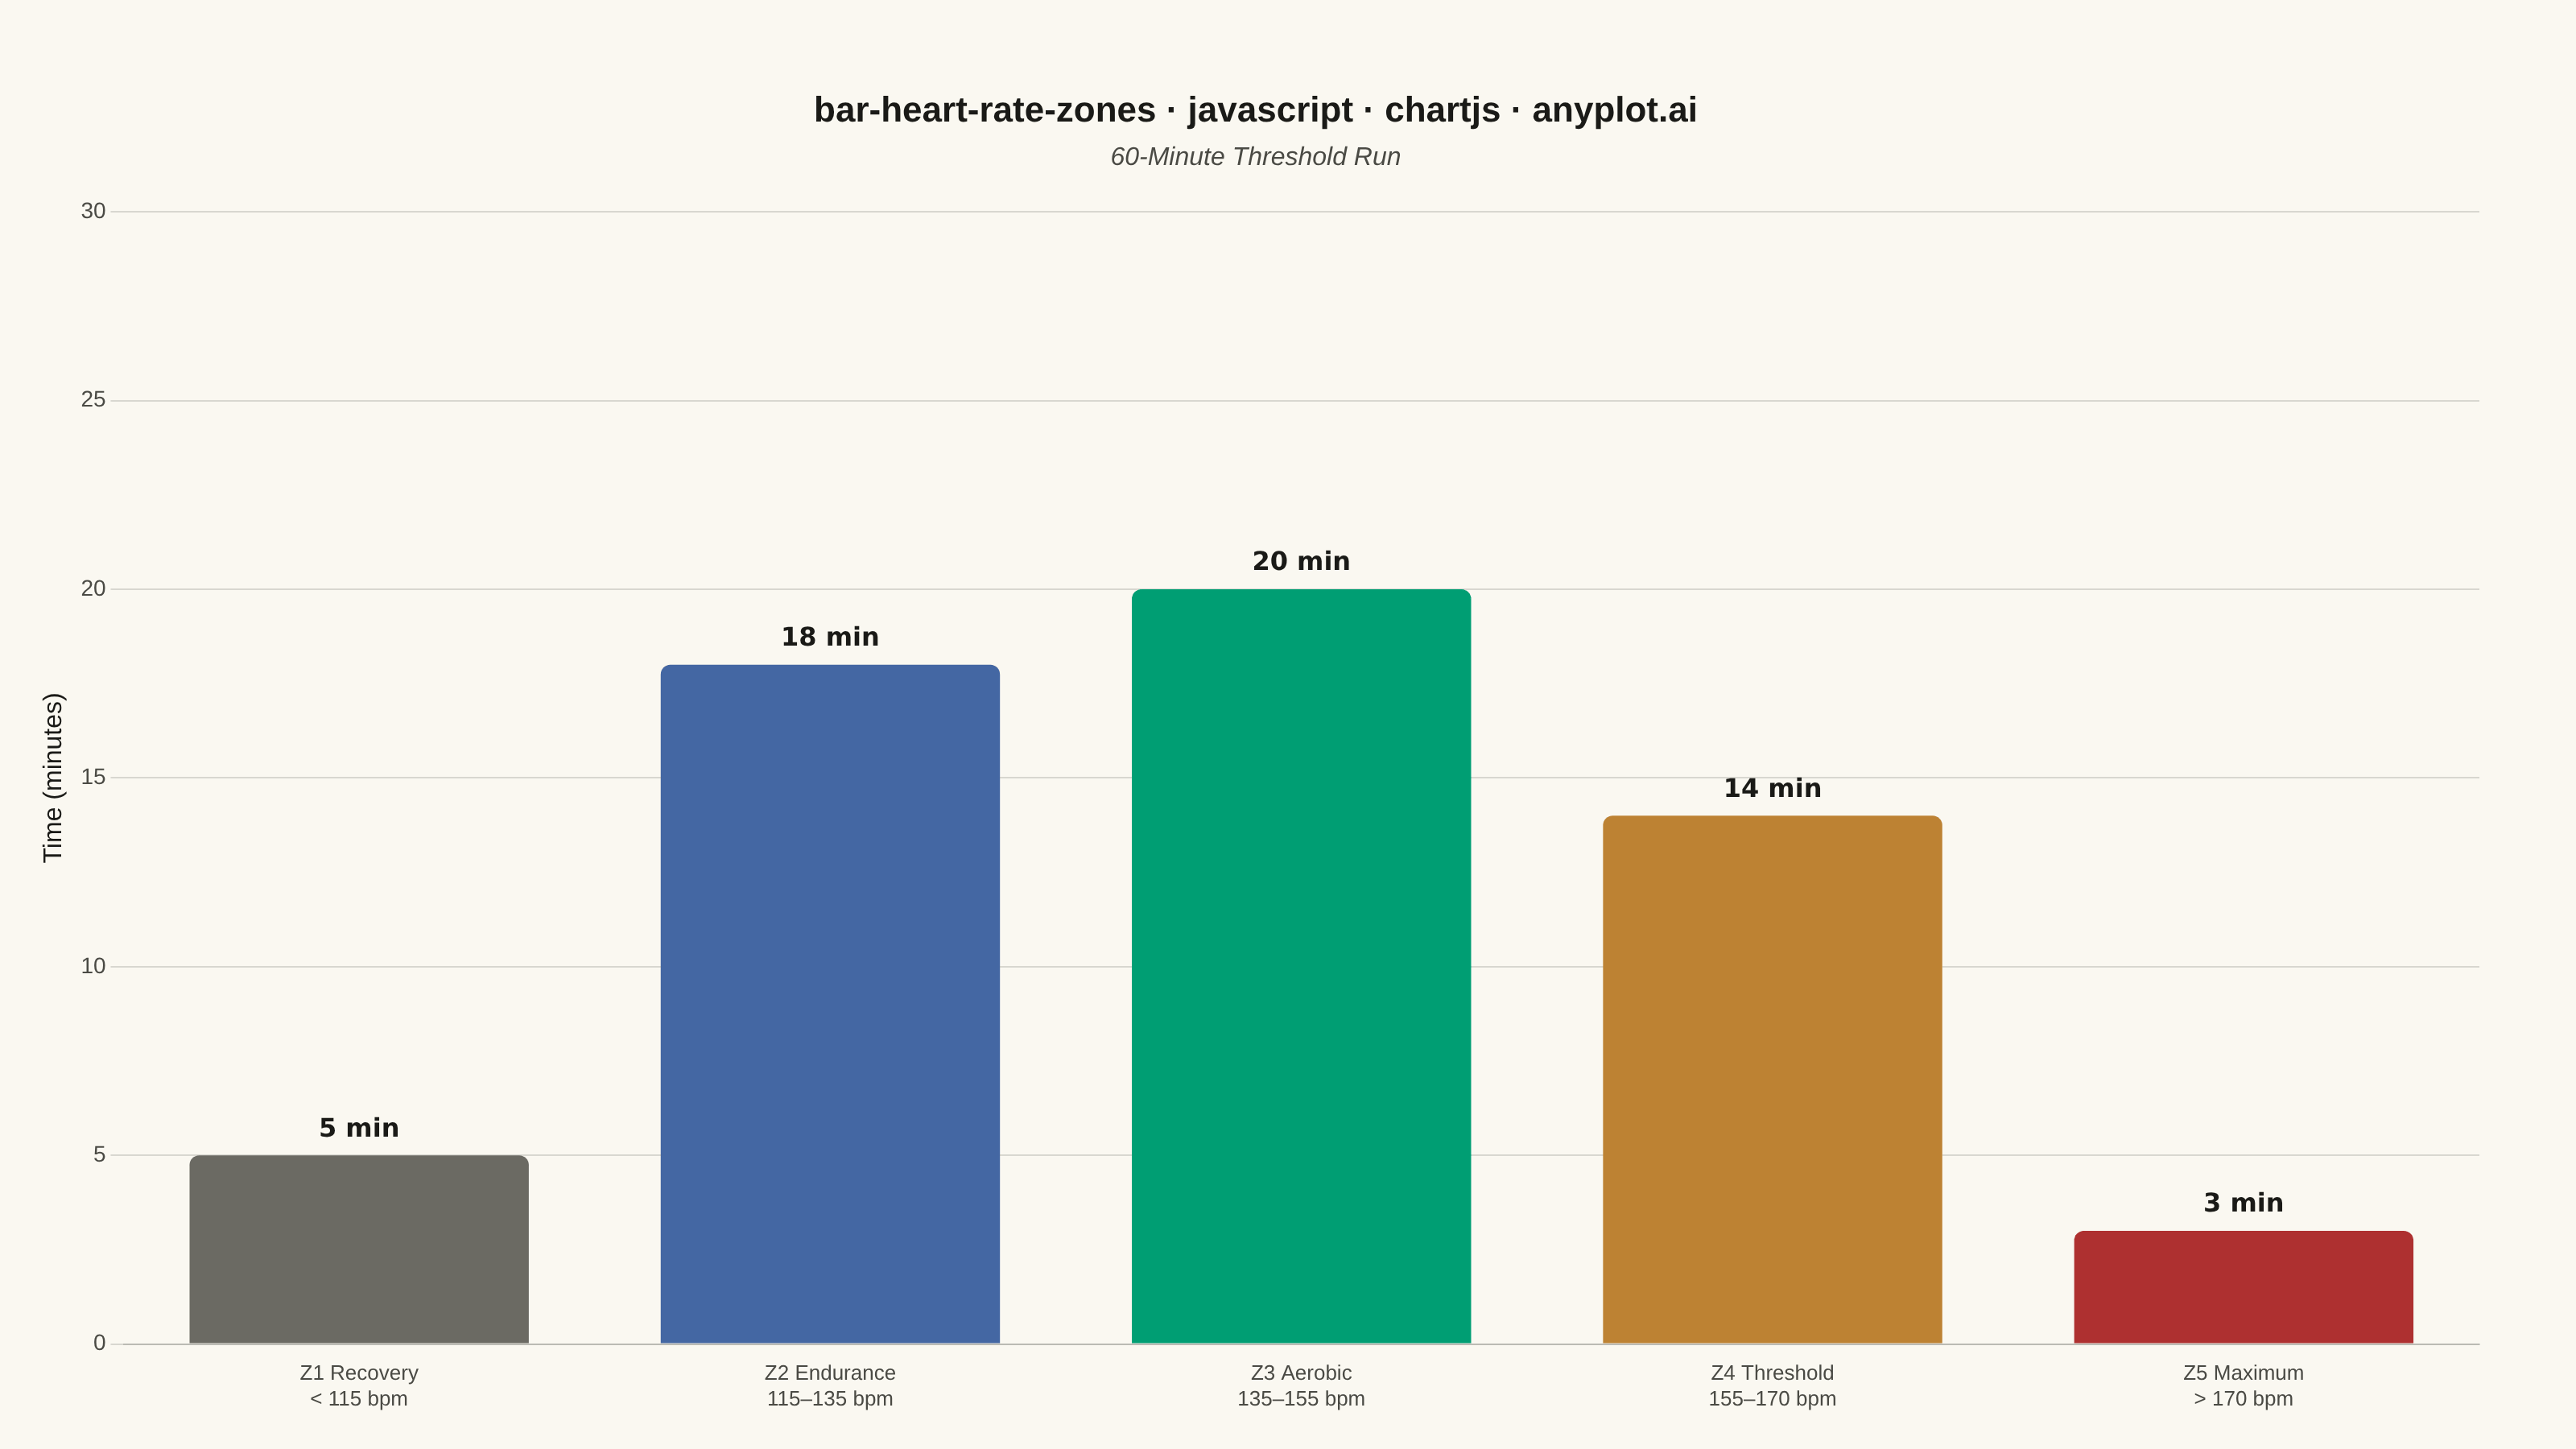
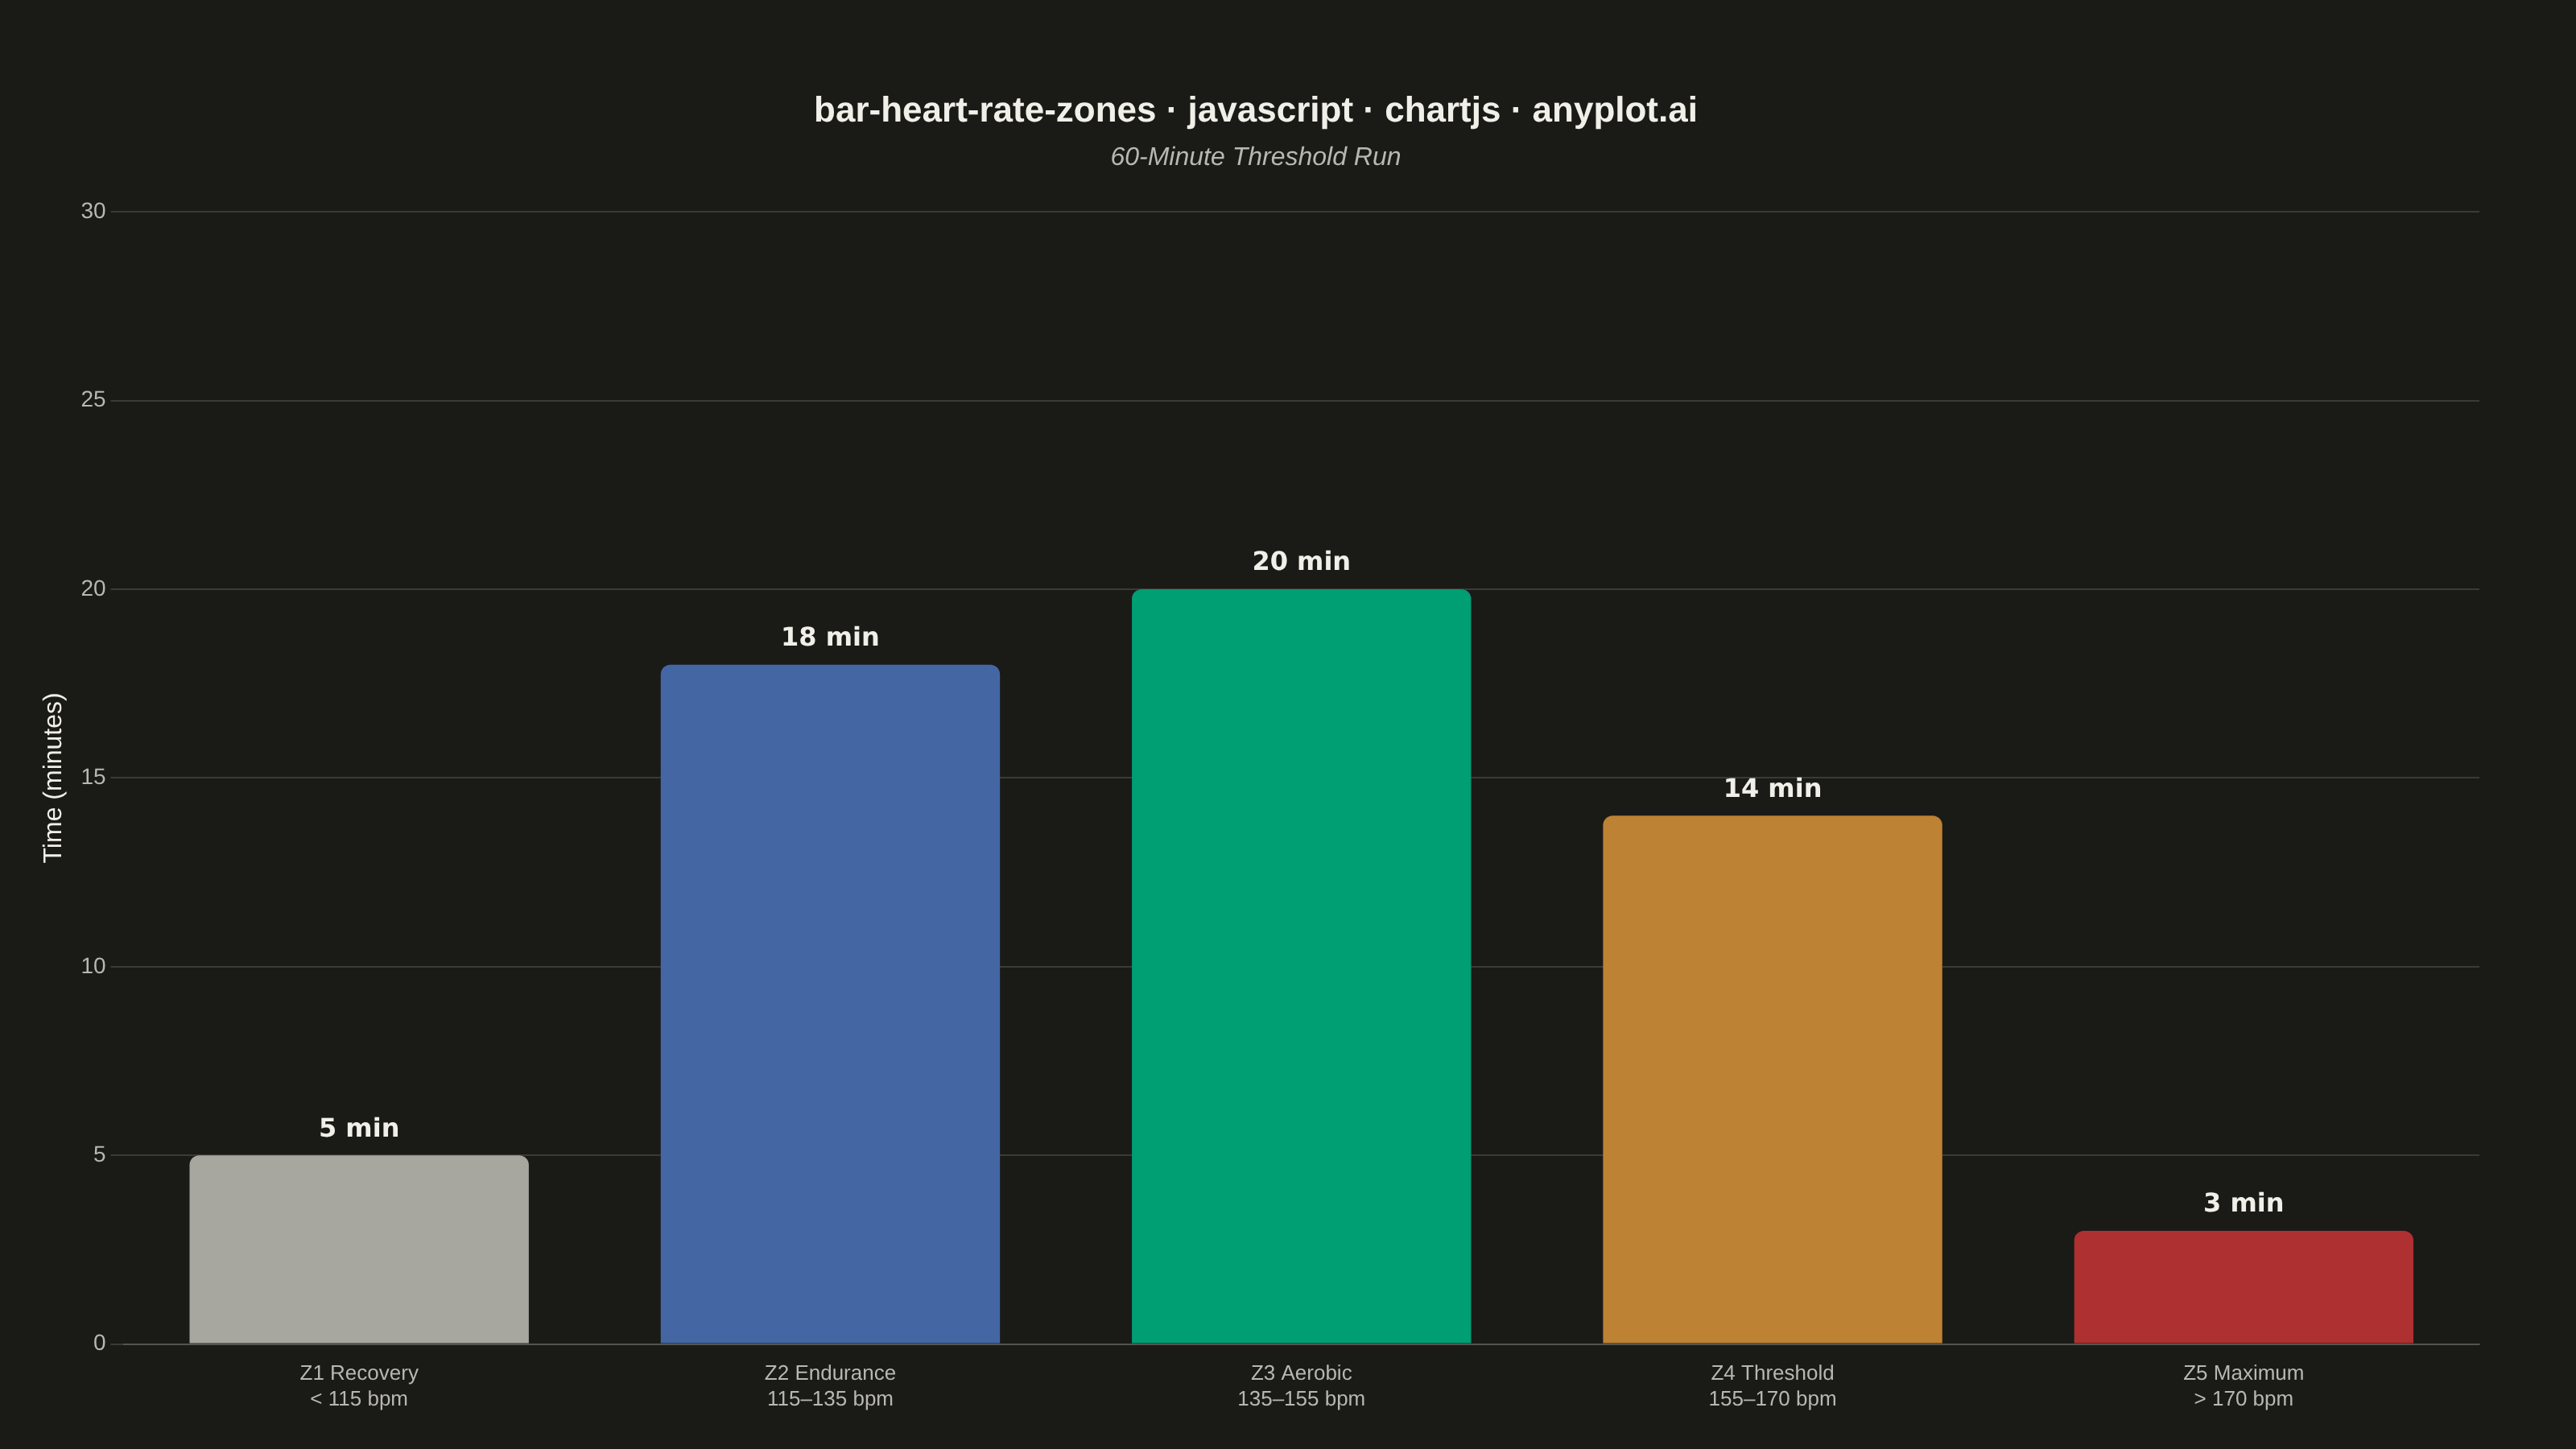
A vertical bar chart showing the time spent in each heart rate training zone (Z1–Z5) during a workout or training period. Each bar uses the conventional zone color semantics (grey for Z1 recovery, blue for Z2 endurance, green for Z3 aerobic, orange for Z4 threshold, red for Z5 maximum) and is annotated with its duration, making the distribution of training intensity immediately readable. This is the standard summary chart found in fitness platforms such as Garmin, Strava, and Polar, and it reveals at a glance whether a session was easy, balanced, or high-intensity.
Preview render from the Chart.js implementation.