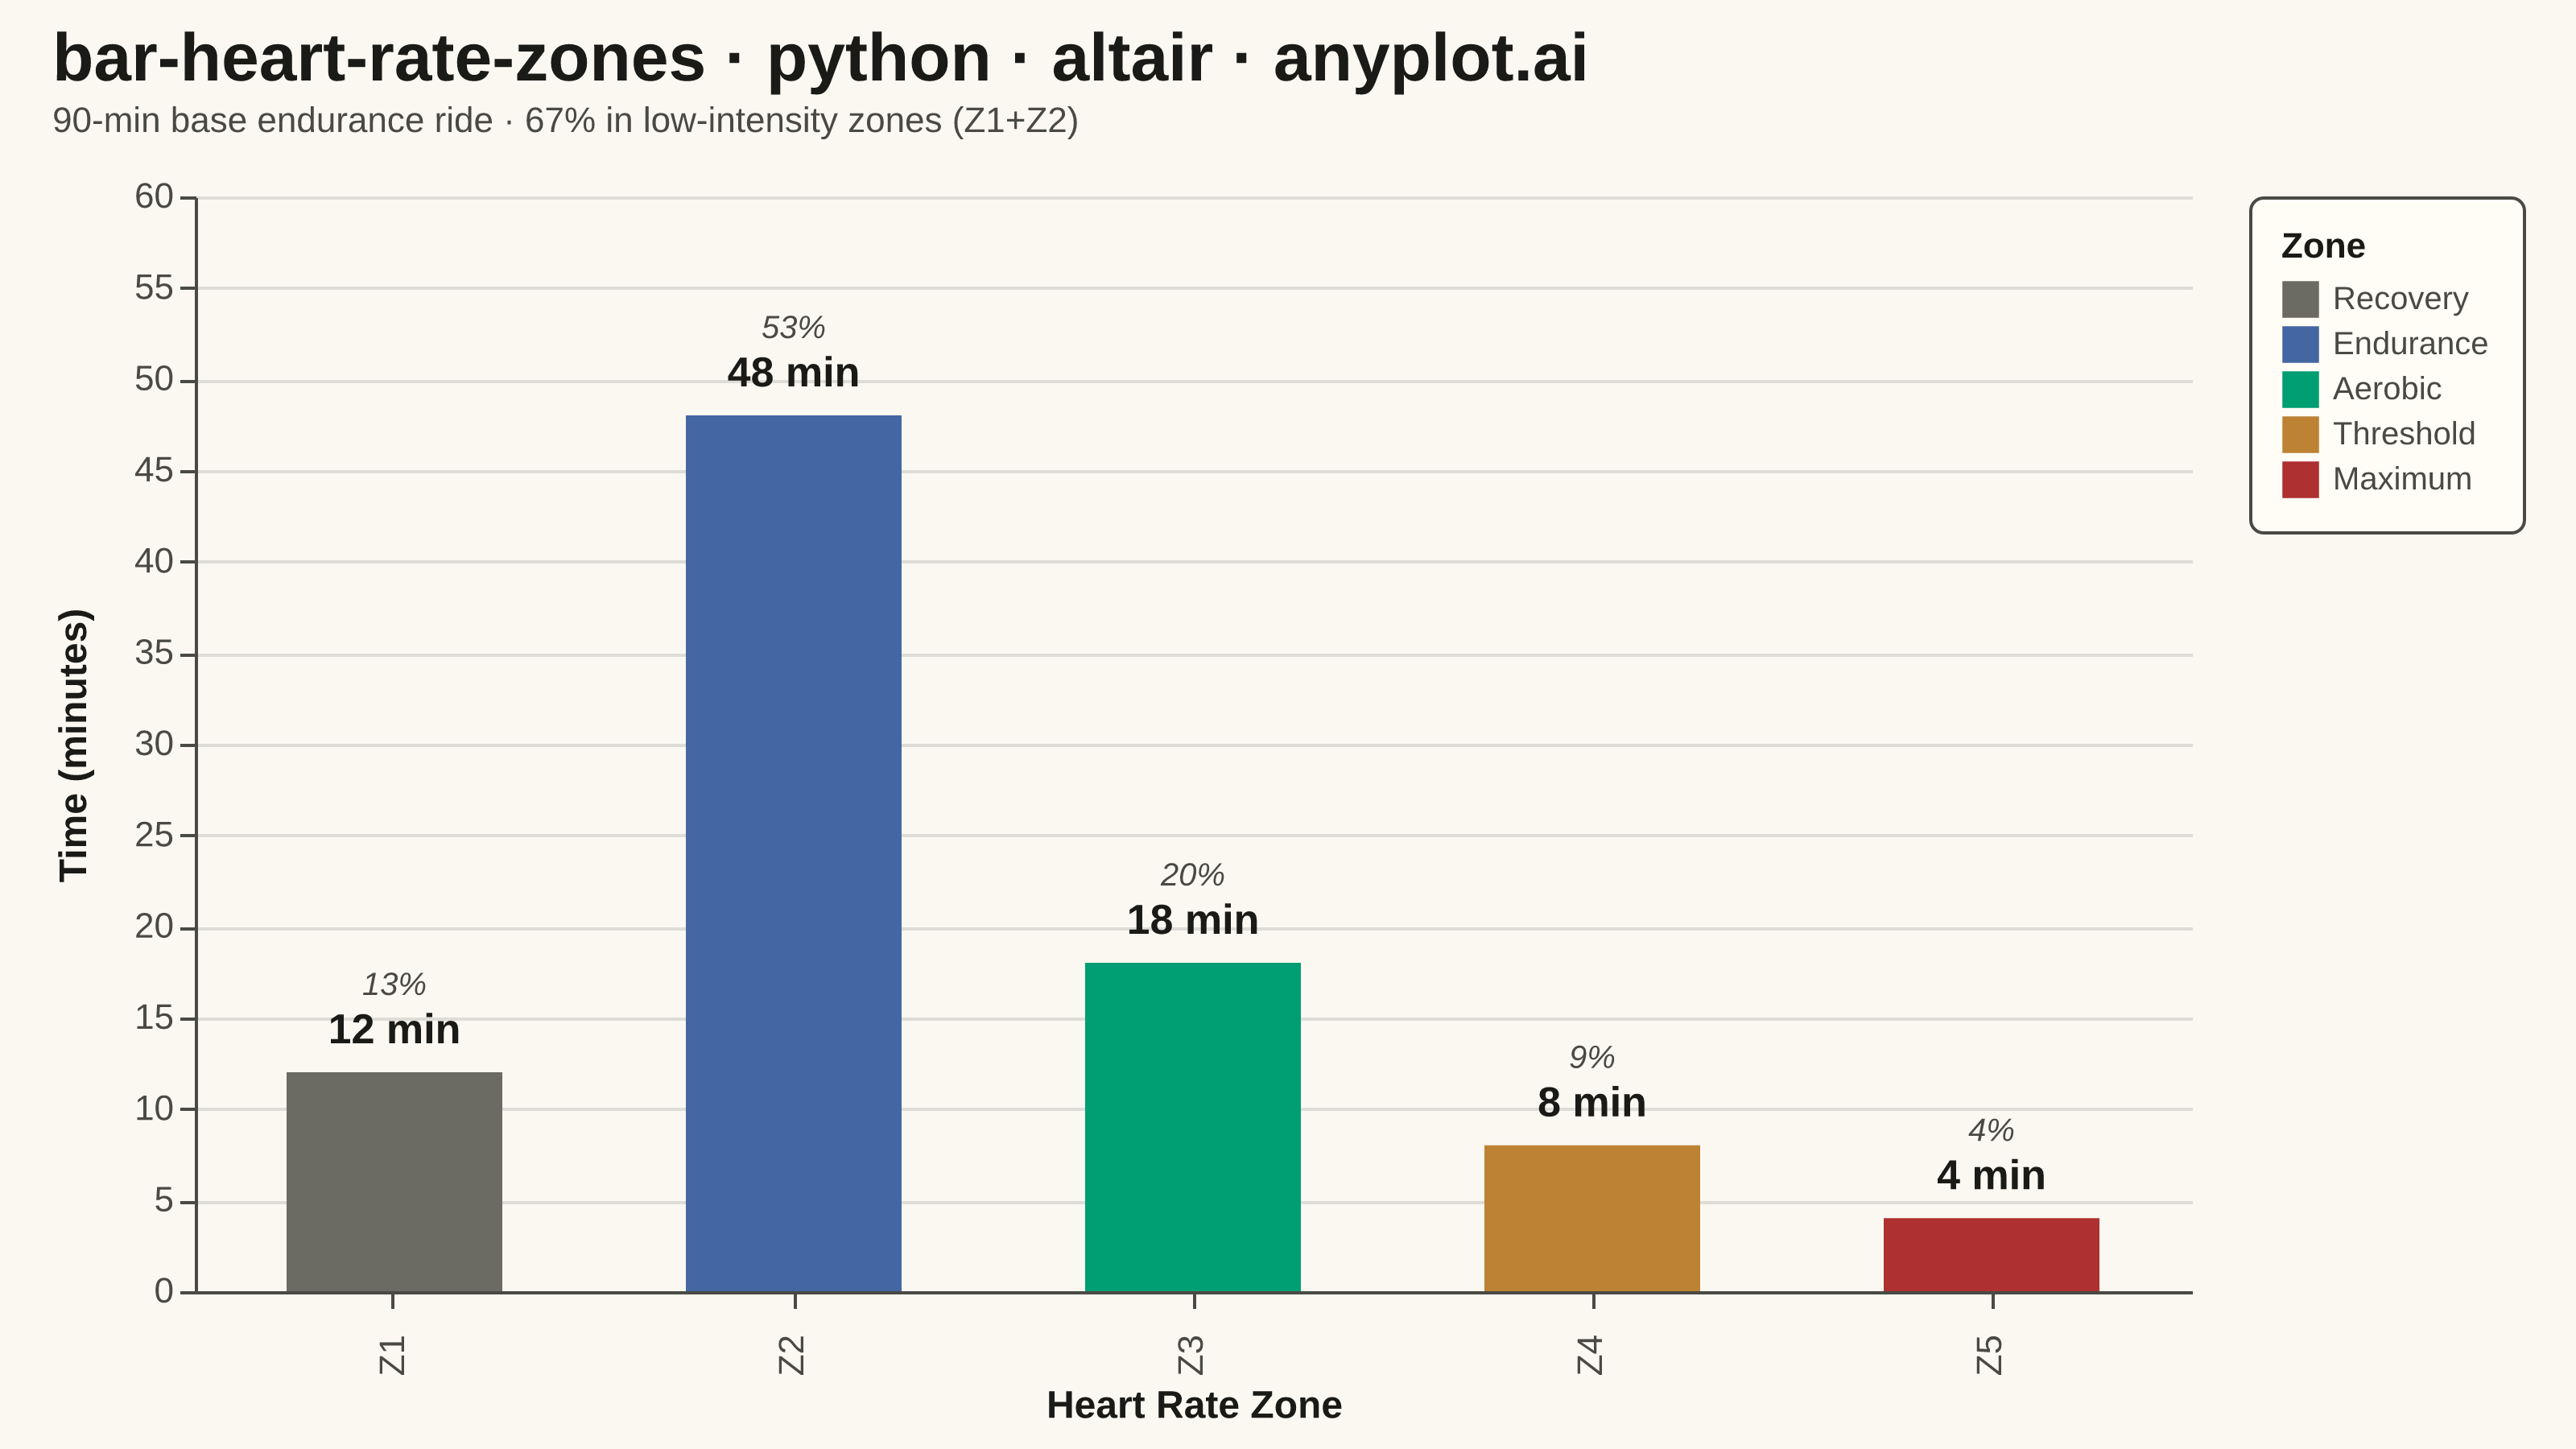
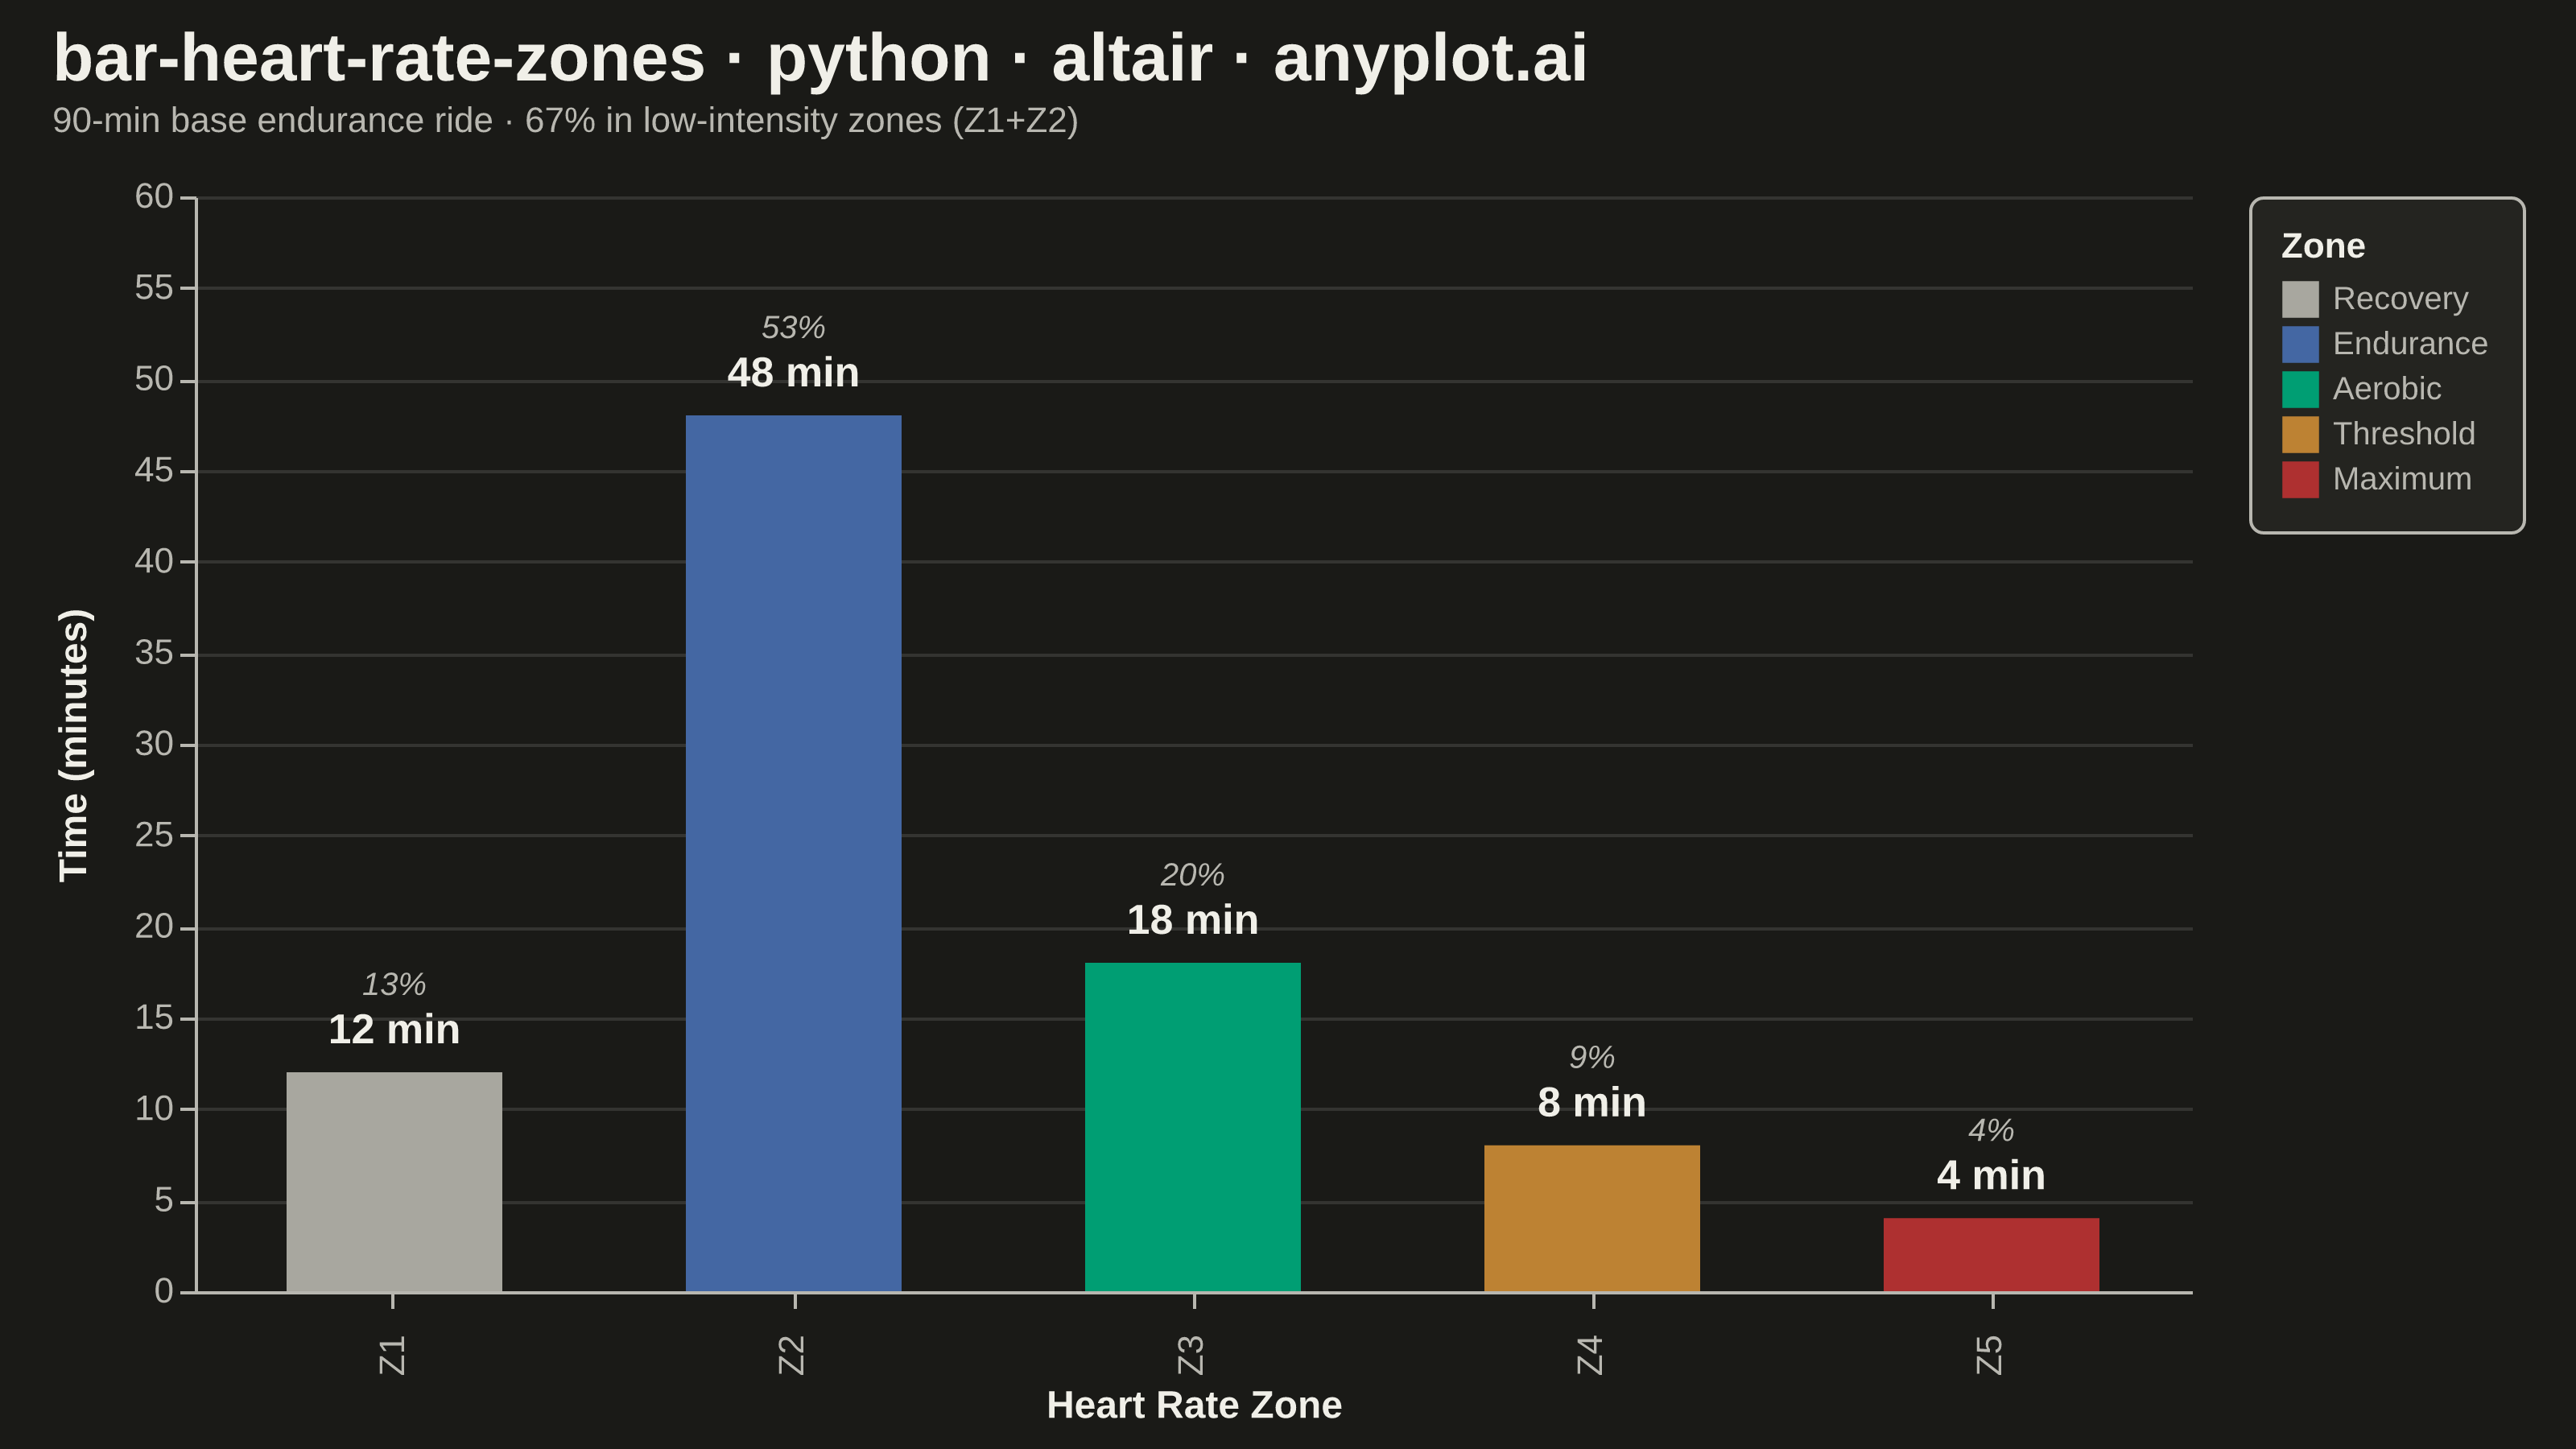
A vertical bar chart showing the time spent in each heart rate training zone (Z1–Z5) during a workout or training period. Each bar uses the conventional zone color semantics (grey for Z1 recovery, blue for Z2 endurance, green for Z3 aerobic, orange for Z4 threshold, red for Z5 maximum) and is annotated with its duration, making the distribution of training intensity immediately readable. This is the standard summary chart found in fitness platforms such as Garmin, Strava, and Polar, and it reveals at a glance whether a session was easy, balanced, or high-intensity.
""" anyplot.ai
bar-heart-rate-zones: Time in Heart Rate Zones Bar Chart
Library: altair 6.2.1 | Python 3.13.13
Quality: 91/100 | Created: 2026-06-14
"""

import os

import altair as alt
import pandas as pd
from PIL import Image


# Theme tokens (Imprint palette, theme-adaptive chrome)
THEME = os.getenv("ANYPLOT_THEME", "light")
PAGE_BG = "#FAF8F1" if THEME == "light" else "#1A1A17"
ELEVATED_BG = "#FFFDF6" if THEME == "light" else "#242420"
INK = "#1A1A17" if THEME == "light" else "#F0EFE8"
INK_SOFT = "#4A4A44" if THEME == "light" else "#B8B7B0"

# Zone colors — semantic exception: conventional HR zone palette mapped to Imprint members.
# Z1 grey → Imprint muted anchor, Z2 blue → Imprint blue, Z3 green → Imprint brand green,
# Z4 orange → Imprint ochre, Z5 red → Imprint matte red.
ZONE_COLOR = {
    "Recovery": "#6B6A63" if THEME == "light" else "#A8A79F",
    "Endurance": "#4467A3",
    "Aerobic": "#009E73",
    "Threshold": "#BD8233",
    "Maximum": "#AE3030",
}

# Data — 90-minute base endurance ride (mostly Z2 aerobic base building)
zone_codes = ["Z1", "Z2", "Z3", "Z4", "Z5"]
zone_names = ["Recovery", "Endurance", "Aerobic", "Threshold", "Maximum"]
minutes = [12, 48, 18, 8, 4]
hr_ranges = ["50–59% max HR", "60–69% max HR", "70–79% max HR", "80–89% max HR", "90–100% max HR"]

df = pd.DataFrame(
    {
        "zone": zone_codes,
        "name": zone_names,
        "minutes": minutes,
        "hr_range": hr_ranges,
        "duration": [f"{m} min" for m in minutes],
    }
)

# Title — 51 chars, under 67-char baseline, so default 16px fontsize is fine
title = "bar-heart-rate-zones · python · altair · anyplot.ai"
title_fontsize = max(11, round(16 * 67 / len(title)))

# Bars — color encoding drives the legend (zone name → Imprint-mapped color)
bars = (
    alt.Chart(df)
    .mark_bar(width={"band": 0.6})
    .encode(
        x=alt.X("zone:O", sort=zone_codes, axis=alt.Axis(title="Heart Rate Zone", labelPadding=8)),
        y=alt.Y("minutes:Q", axis=alt.Axis(title="Time (minutes)", titlePadding=12), scale=alt.Scale(domain=[0, 58])),
        color=alt.Color(
            "name:N",
            scale=alt.Scale(domain=zone_names, range=[ZONE_COLOR[n] for n in zone_names]),
            legend=alt.Legend(title="Zone", symbolSize=130, symbolStrokeWidth=0),
        ),
        tooltip=[
            alt.Tooltip("zone:N", title="Zone"),
            alt.Tooltip("name:N", title="Type"),
            alt.Tooltip("minutes:Q", title="Duration (min)"),
            alt.Tooltip("hr_range:N", title="HR Range"),
        ],
    )
)

# Duration labels above each bar
text_labels = (
    alt.Chart(df)
    .mark_text(align="center", baseline="bottom", dy=-6, fontSize=13, fontWeight="bold")
    .encode(x=alt.X("zone:O", sort=zone_codes), y=alt.Y("minutes:Q"), text=alt.Text("duration:N"), color=alt.value(INK))
)

# Percentage-of-session labels above duration labels (transform_calculate computes share of 90 min)
pct_labels = (
    alt.Chart(df)
    .transform_calculate(pct_text="format(datum.minutes / 90 * 100, '.0f') + '%'")
    .mark_text(align="center", baseline="bottom", dy=-22, fontSize=10, fontStyle="italic")
    .encode(
        x=alt.X("zone:O", sort=zone_codes), y=alt.Y("minutes:Q"), text=alt.Text("pct_text:N"), color=alt.value(INK_SOFT)
    )
)

chart = (
    (bars + text_labels + pct_labels)
    .properties(
        width=620,
        height=340,
        background=PAGE_BG,
        title=alt.TitleParams(
            text=title,
            fontSize=title_fontsize,
            color=INK,
            anchor="start",
            offset=12,
            subtitle="90-min base endurance ride · 67% in low-intensity zones (Z1+Z2)",
            subtitleColor=INK_SOFT,
            subtitleFontSize=11,
        ),
        padding={"left": 0, "right": 0, "top": 0, "bottom": 0},
    )
    .configure_view(fill=PAGE_BG, stroke=None)
    .configure_axis(
        domainColor=INK_SOFT,
        tickColor=INK_SOFT,
        gridColor=INK,
        gridOpacity=0.12,
        labelColor=INK_SOFT,
        titleColor=INK,
        labelFontSize=11,
        titleFontSize=12,
    )
    .configure_legend(
        fillColor=ELEVATED_BG,
        strokeColor=INK_SOFT,
        labelColor=INK_SOFT,
        titleColor=INK,
        labelFontSize=10,
        titleFontSize=11,
        padding=10,
        cornerRadius=4,
    )
)

# Save PNG
chart.save(f"plot-{THEME}.png", scale_factor=4.0)

# Pad to exact 3200×1800 target (vl-convert may under-shoot the inner-view size).
# Never crop — cropping clips title/axis labels and triggers AR-09 auto-reject.
TW, TH = 3200, 1800
_img = Image.open(f"plot-{THEME}.png").convert("RGB")
_w, _h = _img.size
if _w > TW or _h > TH:
    raise SystemExit(
        f"altair vl-convert produced {_w}×{_h}, exceeds target {TW}×{TH}. "
        f"Shrink chart .properties(width=, height=) values and re-render."
    )
if _w < TW or _h < TH:
    _canvas = Image.new("RGB", (TW, TH), PAGE_BG)
    _canvas.paste(_img, ((TW - _w) // 2, (TH - _h) // 2))
    _canvas.save(f"plot-{THEME}.png")

# Save interactive HTML
chart.save(f"plot-{THEME}.html")
Runnable source as JSON, for any HTTP client: https://api.anyplot.ai/specs/bar-heart-rate-zones/altair/code. Any spec id and library id listed in llms-full.txt fit the same URL shape; every URL below is complete and callable.
{
  "spec_id": "bar-heart-rate-zones",
  "language": "python",
  "library": "altair",
  "page": "https://anyplot.ai/bar-heart-rate-zones/python/altair",
  "hub": "https://anyplot.ai/bar-heart-rate-zones",
  "code_json": "https://api.anyplot.ai/specs/bar-heart-rate-zones/altair/code",
  "spec_json": "https://api.anyplot.ai/specs/bar-heart-rate-zones",
  "render_light_png": "https://storage.googleapis.com/anyplot-images/plots/bar-heart-rate-zones/python/altair/plot-light.png",
  "render_dark_png": "https://storage.googleapis.com/anyplot-images/plots/bar-heart-rate-zones/python/altair/plot-dark.png",
  "interactive_light_html": "https://storage.googleapis.com/anyplot-images/plots/bar-heart-rate-zones/python/altair/plot-light.html",
  "interactive_dark_html": "https://storage.googleapis.com/anyplot-images/plots/bar-heart-rate-zones/python/altair/plot-dark.html",
  "quality_score": 91.0,
  "license": "MIT",
  "guide": "https://anyplot.ai/llms.txt"
}
Part of Time in Heart Rate Zones Bar Chart on anyplot.ai.