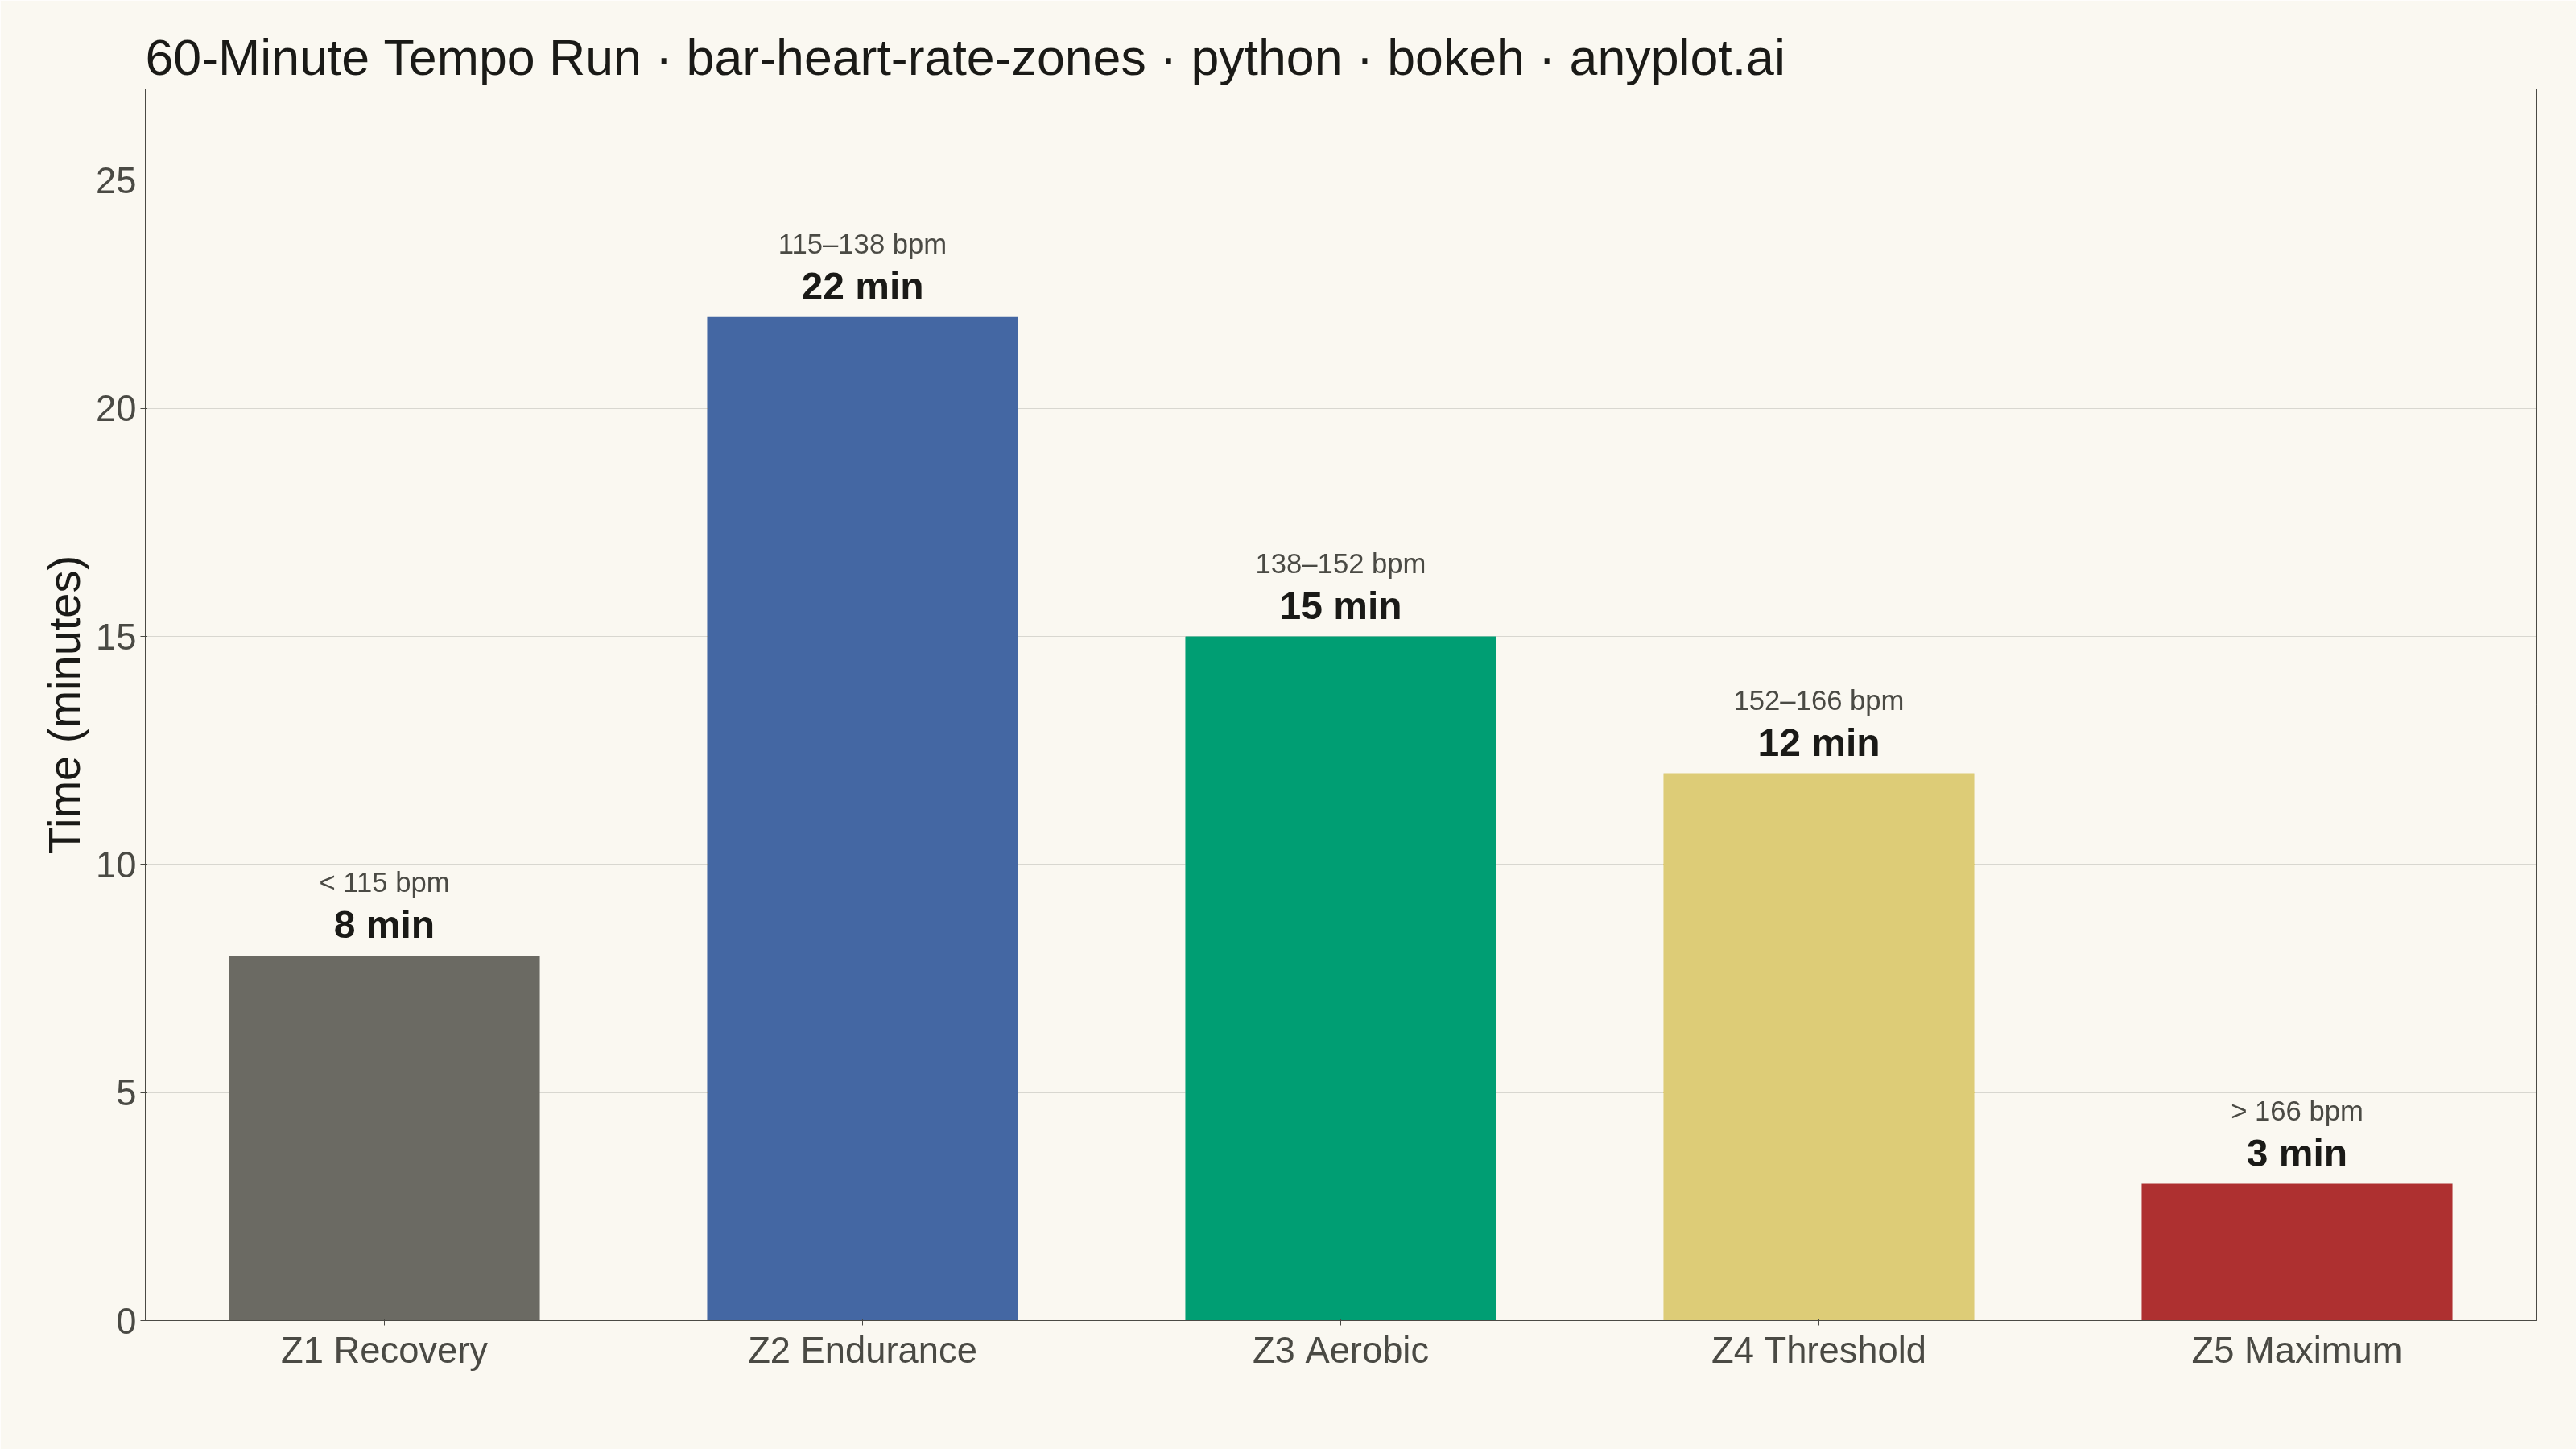
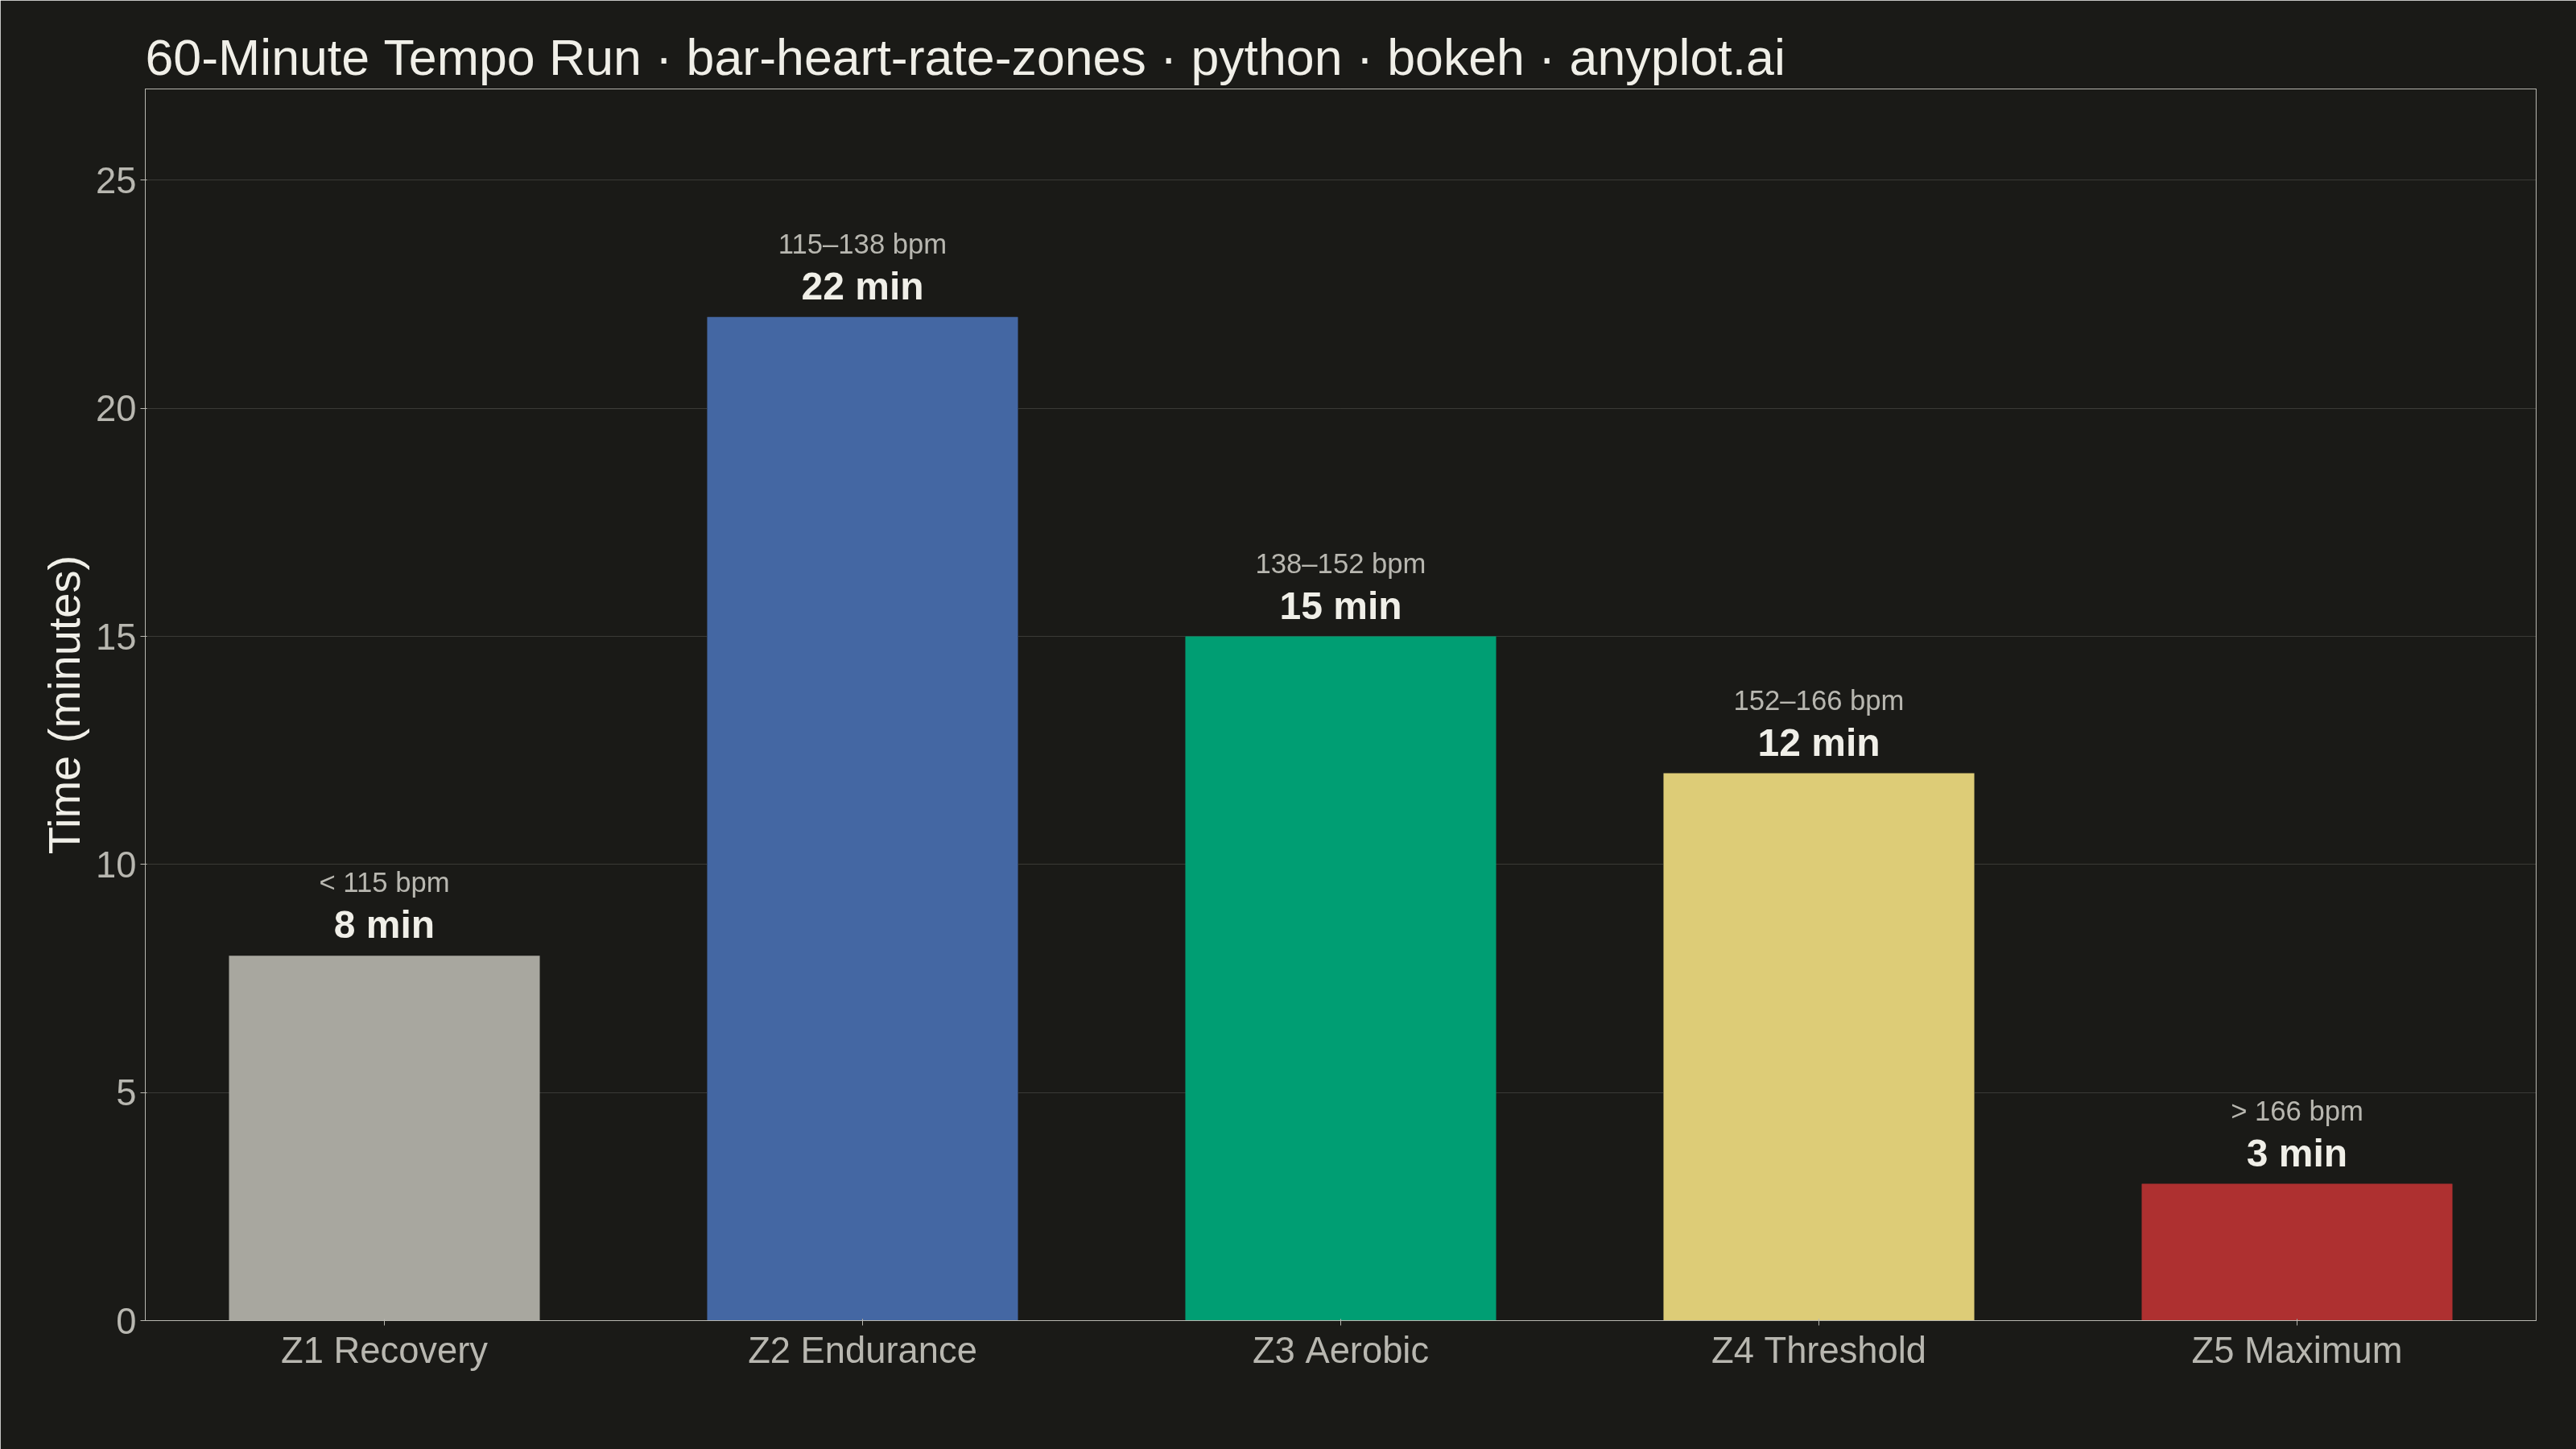
A vertical bar chart showing the time spent in each heart rate training zone (Z1–Z5) during a workout or training period. Each bar uses the conventional zone color semantics (grey for Z1 recovery, blue for Z2 endurance, green for Z3 aerobic, orange for Z4 threshold, red for Z5 maximum) and is annotated with its duration, making the distribution of training intensity immediately readable. This is the standard summary chart found in fitness platforms such as Garmin, Strava, and Polar, and it reveals at a glance whether a session was easy, balanced, or high-intensity.
""" anyplot.ai
bar-heart-rate-zones: Time in Heart Rate Zones Bar Chart
Library: bokeh 3.9.1 | Python 3.13.13
Quality: 91/100 | Created: 2026-06-14
"""

import os
import sys
import time
from pathlib import Path


# Remove current dir from import path so bokeh.py doesn't shadow the bokeh package
sys.path = [p for p in sys.path if p != "" and not (os.path.isfile(os.path.join(p, "bokeh.py")) if p else False)]

import io

from bokeh.io import output_file, save
from bokeh.models import ColumnDataSource, FixedTicker, LabelSet, Range1d
from bokeh.plotting import figure
from PIL import Image
from selenium import webdriver
from selenium.webdriver.chrome.options import Options


# Theme tokens (Imprint palette — see prompts/default-style-guide.md)
THEME = os.getenv("ANYPLOT_THEME", "light")
PAGE_BG = "#FAF8F1" if THEME == "light" else "#1A1A17"
ELEVATED_BG = "#FFFDF6" if THEME == "light" else "#242420"
INK = "#1A1A17" if THEME == "light" else "#F0EFE8"
INK_SOFT = "#4A4A44" if THEME == "light" else "#B8B7B0"
INK_MUTED = "#6B6A63" if THEME == "light" else "#A8A79F"

# Zone colors — semantic exception: conventional heart rate zone colors map to Imprint roles
# Z1→grey (Imprint muted), Z2→blue (Imprint pos 3), Z3→green (Imprint brand pos 1),
# Z4→amber (Imprint warning anchor — caution/threshold), Z5→red (Imprint semantic anchor)
ZONE_COLORS = [INK_MUTED, "#4467A3", "#009E73", "#DDCC77", "#AE3030"]

# Data — 60-minute tempo run
zones = ["Z1 Recovery", "Z2 Endurance", "Z3 Aerobic", "Z4 Threshold", "Z5 Maximum"]
minutes_data = [8, 22, 15, 12, 3]
hr_ranges_text = ["< 115 bpm", "115–138 bpm", "138–152 bpm", "152–166 bpm", "> 166 bpm"]
duration_labels = [f"{m} min" for m in minutes_data]

source = ColumnDataSource(
    data={
        "zones": zones,
        "minutes": minutes_data,
        "colors": ZONE_COLORS,
        "durations": duration_labels,
        "hr_ranges": hr_ranges_text,
    }
)

# Title — fontsize scaled for length (default 50pt for ~67-char title)
title = "60-Minute Tempo Run · bar-heart-rate-zones · python · bokeh · anyplot.ai"
n = len(title)
title_fontsize = f"{max(34, round(50 * 67 / n))}pt"

# Figure — 3200×1800 landscape (toolbar_location=None avoids height drift)
p = figure(
    width=3200,
    height=1800,
    title=title,
    x_range=zones,
    y_range=Range1d(start=0, end=27),
    y_axis_label="Time (minutes)",
    toolbar_location=None,
    min_border_bottom=160,
    min_border_left=180,
    min_border_top=110,
    min_border_right=50,
)

# Bars
p.vbar(x="zones", top="minutes", width=0.65, source=source, color="colors", line_color=None)

# Duration labels — just above each bar
duration_set = LabelSet(
    x="zones",
    y="minutes",
    text="durations",
    source=source,
    y_offset=12,
    text_align="center",
    text_baseline="bottom",
    text_font_size="36pt",
    text_font_style="bold",
    text_color=INK,
)
p.add_layout(duration_set)

# HR range labels — above the duration labels
hr_set = LabelSet(
    x="zones",
    y="minutes",
    text="hr_ranges",
    source=source,
    y_offset=72,
    text_align="center",
    text_baseline="bottom",
    text_font_size="26pt",
    text_color=INK_SOFT,
)
p.add_layout(hr_set)

# Theme-adaptive chrome
p.background_fill_color = PAGE_BG
p.border_fill_color = PAGE_BG
p.outline_line_color = INK_SOFT

p.title.text_font_size = title_fontsize
p.title.text_color = INK
p.title.text_font_style = "normal"

p.yaxis.axis_label_text_font_size = "42pt"
p.yaxis.axis_label_text_color = INK
p.yaxis.axis_label_text_font_style = "normal"
p.xaxis.major_label_text_font_size = "34pt"
p.yaxis.major_label_text_font_size = "34pt"
p.xaxis.major_label_text_color = INK_SOFT
p.yaxis.major_label_text_color = INK_SOFT
p.xaxis.axis_line_color = INK_SOFT
p.yaxis.axis_line_color = INK_SOFT
p.xaxis.major_tick_line_color = INK_SOFT
p.yaxis.major_tick_line_color = INK_SOFT
p.xaxis.minor_tick_line_color = None
p.yaxis.minor_tick_line_color = None

p.xgrid.grid_line_color = None
p.ygrid.grid_line_color = INK
p.ygrid.grid_line_alpha = 0.15
p.ygrid.ticker = FixedTicker(ticks=[0, 5, 10, 15, 20, 25])
p.yaxis.ticker = FixedTicker(ticks=[0, 5, 10, 15, 20, 25])

# Save HTML artifact
output_file(f"plot-{THEME}.html")
save(p)

# Screenshot with headless Chrome (Selenium 4 / Selenium Manager)
# Window is set taller than the 1800px target to absorb any OS/browser chrome
# overhead; PIL crops the screenshot to exactly 3200×1800 to pass the canvas gate.
FIG_W, FIG_H = 3200, 1800
WIN_W, WIN_H = FIG_W, FIG_H + 200
opts = Options()
for arg in (
    "--headless=new",
    "--no-sandbox",
    "--disable-dev-shm-usage",
    "--disable-gpu",
    "--force-device-scale-factor=1",
    f"--window-size={WIN_W},{WIN_H}",
    "--hide-scrollbars",
):
    opts.add_argument(arg)
driver = webdriver.Chrome(options=opts)
driver.set_window_size(WIN_W, WIN_H)
driver.get(f"file://{Path(f'plot-{THEME}.html').resolve()}")
time.sleep(3)
raw = driver.get_screenshot_as_png()
driver.quit()
img = Image.open(io.BytesIO(raw))
img.crop((0, 0, FIG_W, FIG_H)).save(f"plot-{THEME}.png")
Runnable source as JSON, for any HTTP client: https://api.anyplot.ai/specs/bar-heart-rate-zones/bokeh/code. Any spec id and library id listed in llms-full.txt fit the same URL shape; every URL below is complete and callable.
{
  "spec_id": "bar-heart-rate-zones",
  "language": "python",
  "library": "bokeh",
  "page": "https://anyplot.ai/bar-heart-rate-zones/python/bokeh",
  "hub": "https://anyplot.ai/bar-heart-rate-zones",
  "code_json": "https://api.anyplot.ai/specs/bar-heart-rate-zones/bokeh/code",
  "spec_json": "https://api.anyplot.ai/specs/bar-heart-rate-zones",
  "render_light_png": "https://storage.googleapis.com/anyplot-images/plots/bar-heart-rate-zones/python/bokeh/plot-light.png",
  "render_dark_png": "https://storage.googleapis.com/anyplot-images/plots/bar-heart-rate-zones/python/bokeh/plot-dark.png",
  "interactive_light_html": "https://storage.googleapis.com/anyplot-images/plots/bar-heart-rate-zones/python/bokeh/plot-light.html",
  "interactive_dark_html": "https://storage.googleapis.com/anyplot-images/plots/bar-heart-rate-zones/python/bokeh/plot-dark.html",
  "quality_score": 91.0,
  "license": "MIT",
  "guide": "https://anyplot.ai/llms.txt"
}
Part of Time in Heart Rate Zones Bar Chart on anyplot.ai.