The same plot in 14 other libraries — JavaScript: D3.js, Apache ECharts, Highcharts, MUI X Charts; Python: Altair, Bokeh, lets-plot, Matplotlib, Plotly, plotnine, Pygal, Seaborn; R: ggplot2; Julia: Makie.jl. Compare all 15 side by side: Density Plot with Rug Marks in Python, R, Julia and JavaScript.
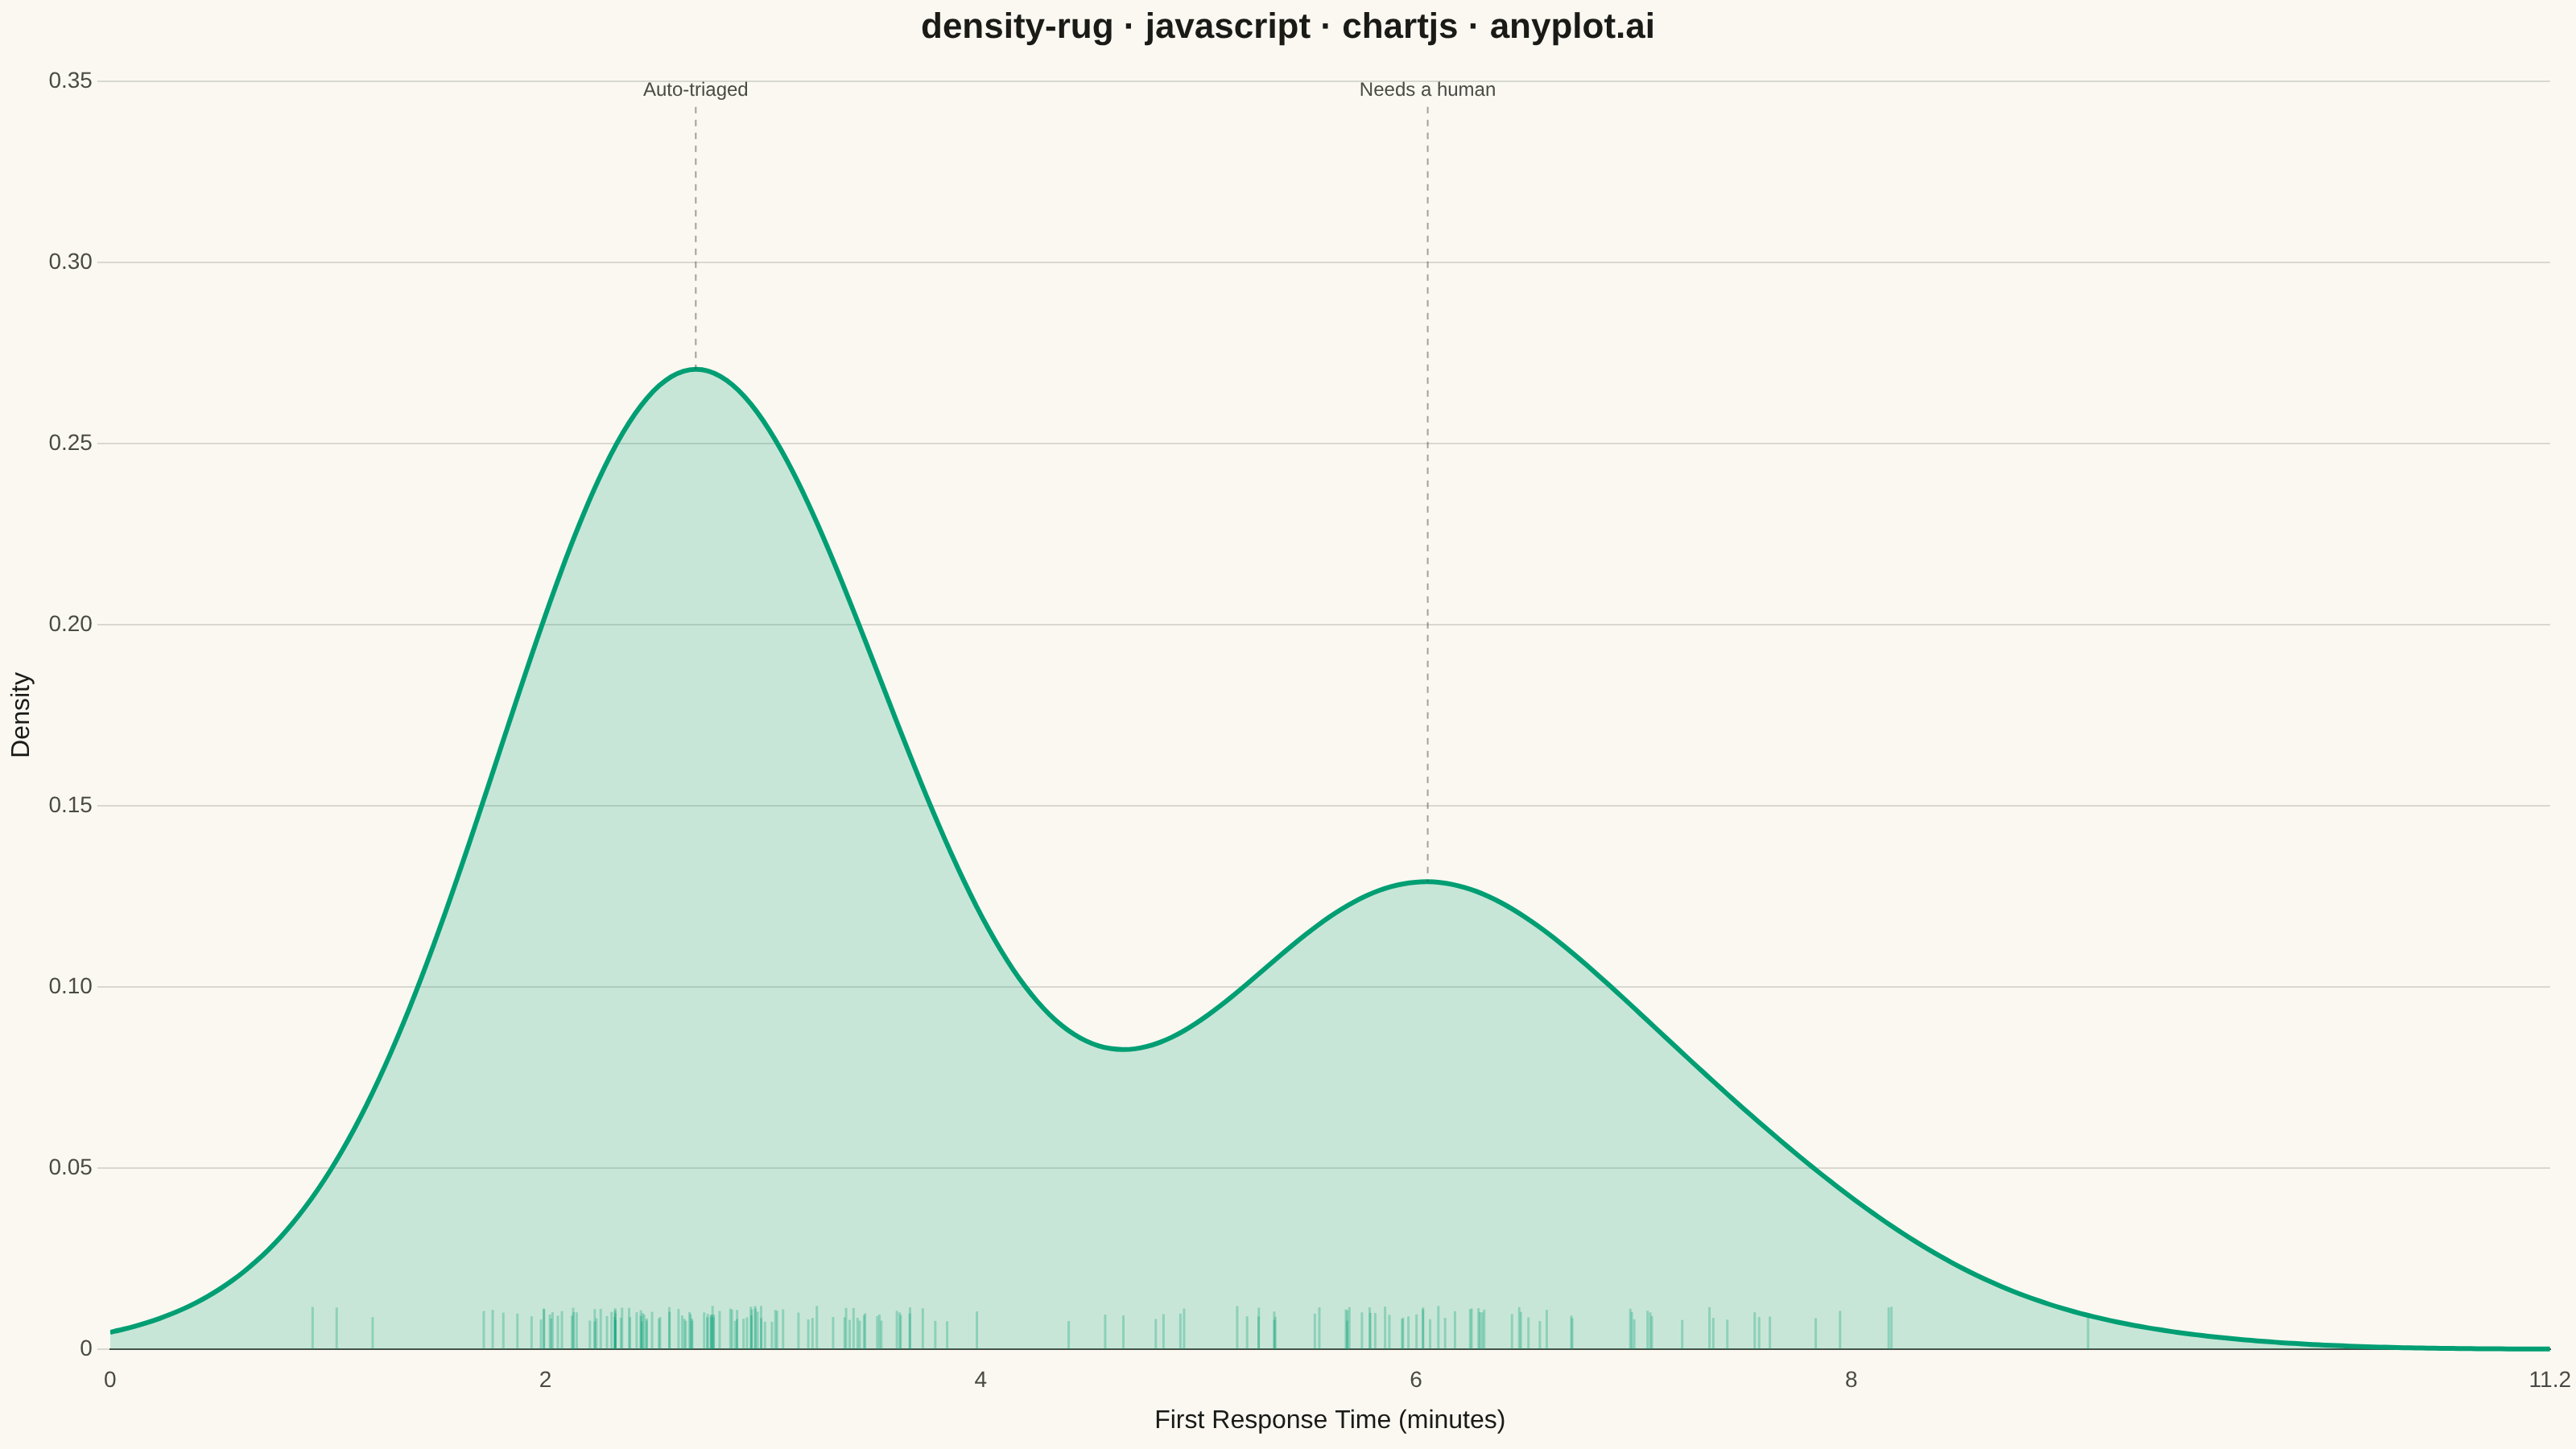
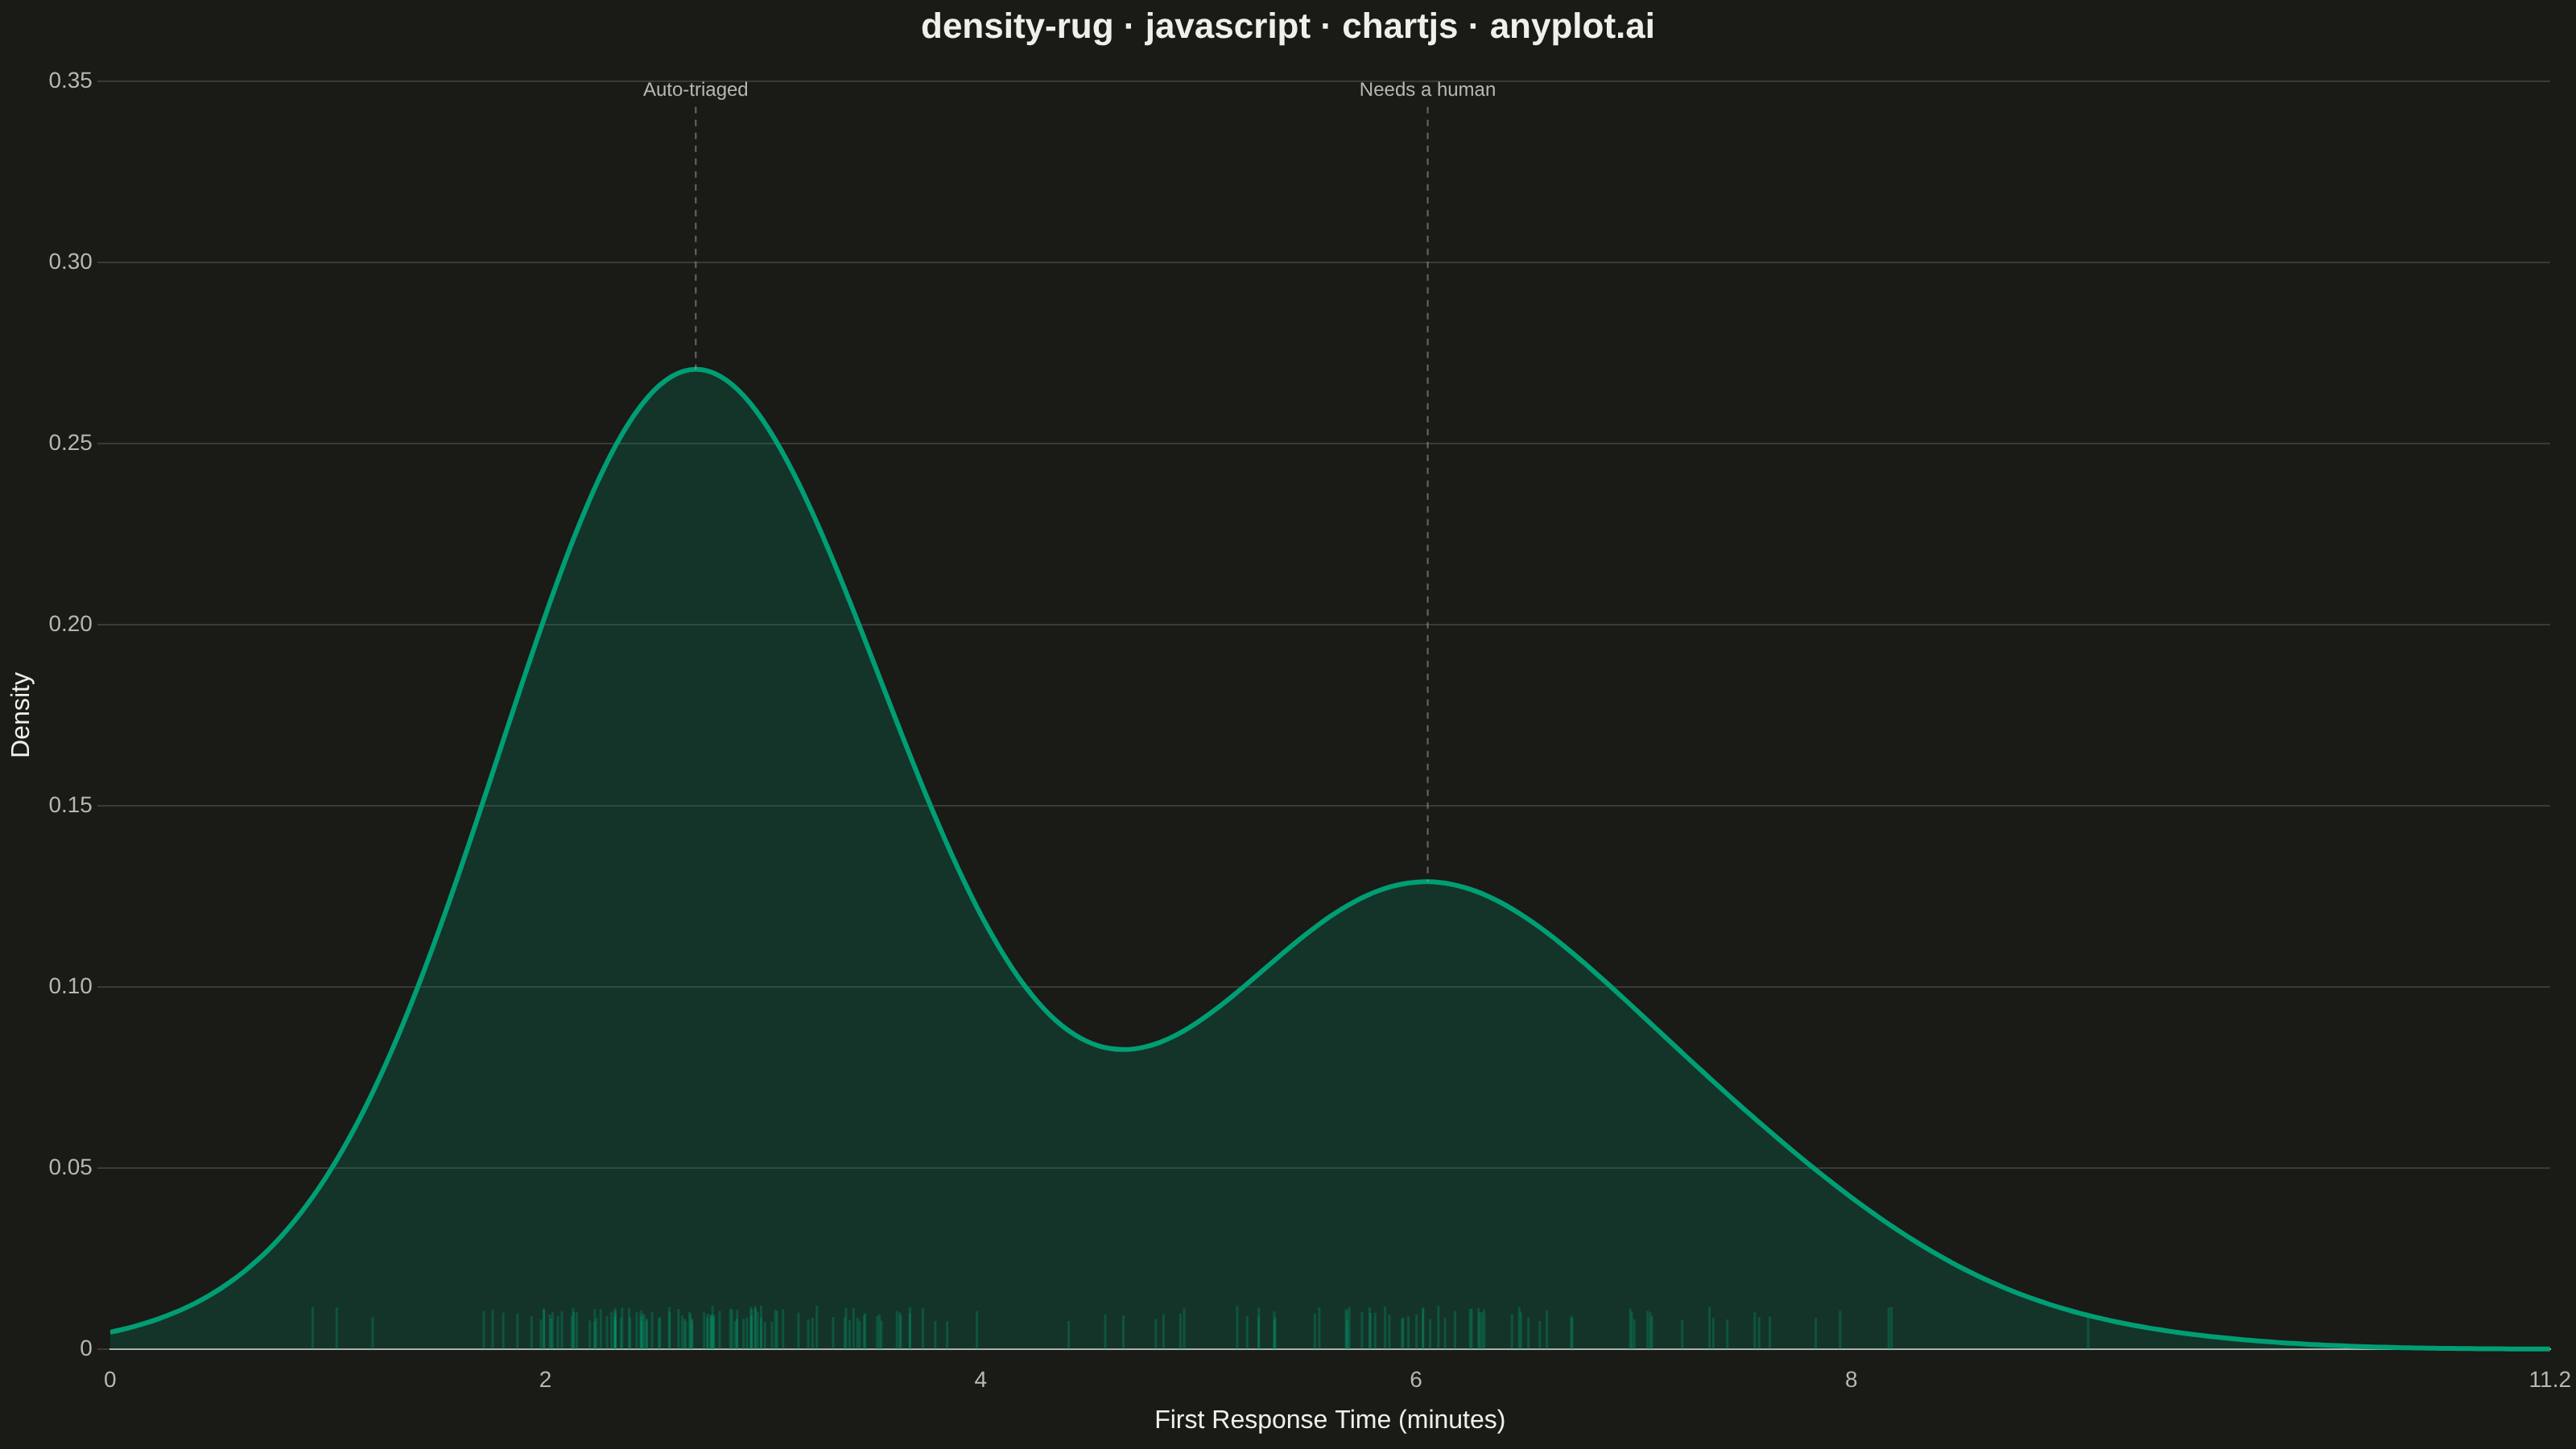
A kernel density estimation (KDE) plot combined with rug marks along the x-axis, showing both the smoothed probability distribution and the exact location of each individual data point. This combination provides the best of both worlds: the KDE reveals the overall shape, modality, and smoothed density of the distribution, while the rug marks preserve transparency about where actual observations fall, highlighting data density and potential gaps.
// anyplot.ai
// density-rug: Density Plot with Rug Marks
// Library: chartjs 4.4.7 | JavaScript 22.23.2
// Quality: 94/100 | Created: 2026-09-02

const t = window.ANYPLOT_TOKENS;

// --- Data (in-memory, deterministic) ----------------------------------------
// Support-ticket first-response times (minutes): a fast "auto-triaged" cohort
// and a slower "needs a human" cohort — a realistic bimodal shape.
function lcg(seed) {
  let state = seed;
  return () => {
    state = (state * 1103515245 + 12345) & 0x7fffffff;
    return state / 0x7fffffff;
  };
}
const rand = lcg(42);
const jitterRand = lcg(7);
function gaussian() {
  const u1 = Math.max(rand(), 1e-9);
  const u2 = rand();
  return Math.sqrt(-2 * Math.log(u1)) * Math.cos(2 * Math.PI * u2);
}

const responseTimes = [];
for (let i = 0; i < 110; i++) {
  responseTimes.push(Math.max(0.2, 2.6 + gaussian() * 0.55));
}
for (let i = 0; i < 70; i++) {
  responseTimes.push(Math.max(0.2, 6.3 + gaussian() * 1.15));
}

// --- Kernel density estimate (Gaussian kernel, Silverman bandwidth) --------
const n = responseTimes.length;
const mean = responseTimes.reduce((a, b) => a + b, 0) / n;
const variance =
  responseTimes.reduce((a, b) => a + (b - mean) ** 2, 0) / (n - 1);
const std = Math.sqrt(variance);
const bandwidth = 1.06 * std * n ** (-1 / 5);

function gaussianKernel(u) {
  return Math.exp(-0.5 * u * u) / Math.sqrt(2 * Math.PI);
}
function density(x) {
  const sum = responseTimes.reduce(
    (acc, xi) => acc + gaussianKernel((x - xi) / bandwidth),
    0,
  );
  return sum / (n * bandwidth);
}

const dataMin = Math.min(...responseTimes);
const dataMax = Math.max(...responseTimes);
const gridMin = Math.max(0, dataMin - 3 * bandwidth);
const gridMax = dataMax + 3 * bandwidth;
const gridSteps = 200;
const curve = Array.from({ length: gridSteps + 1 }, (_, i) => {
  const x = gridMin + ((gridMax - gridMin) * i) / gridSteps;
  return { x, y: density(x) };
});
const peakDensity = Math.max(...curve.map((p) => p.y));

// Two tallest local maxima, ordered by x, call out the fast/slow cohorts.
function localMaxima(points) {
  const maxima = [];
  for (let i = 1; i < points.length - 1; i++) {
    if (points[i].y > points[i - 1].y && points[i].y > points[i + 1].y) {
      maxima.push(points[i]);
    }
  }
  return maxima;
}
const modes = localMaxima(curve)
  .sort((a, b) => b.y - a.y)
  .slice(0, 2)
  .sort((a, b) => a.x - b.x);
const modeLabels = ["Auto-triaged", "Needs a human"];

// --- Color helpers -----------------------------------------------------------
function hexToRgba(hex, alpha) {
  const r = parseInt(hex.slice(1, 3), 16);
  const g = parseInt(hex.slice(3, 5), 16);
  const b = parseInt(hex.slice(5, 7), 16);
  return `rgba(${r}, ${g}, ${b}, ${alpha})`;
}
const brand = t.palette[0];

// --- Mount --------------------------------------------------------------------
const canvas = document.createElement("canvas");
document.getElementById("container").appendChild(canvas);

// --- Rug marks plugin (core Chart.js plugin API — no external dependency) ---
const rugTickHeight = 22;
const rugPlugin = {
  id: "rugMarks",
  afterDatasetsDraw(chart) {
    const { ctx, chartArea, scales } = chart;
    const xScale = scales.x;
    ctx.save();
    ctx.strokeStyle = hexToRgba(brand, 0.3);
    ctx.lineWidth = 1.5;
    responseTimes.forEach((value) => {
      const xPixel = xScale.getPixelForValue(value);
      // Stagger tick height so overlapping ticks in the two dense clusters
      // don't merge into a solid block.
      const tickHeight = rugTickHeight + (jitterRand() - 0.5) * 10;
      ctx.beginPath();
      ctx.moveTo(xPixel, chartArea.bottom);
      ctx.lineTo(xPixel, chartArea.bottom - tickHeight);
      ctx.stroke();
    });
    ctx.restore();
  },
};

// --- Mode guides plugin (dashed callouts at the two KDE peaks) --------------
const modeGuidesPlugin = {
  id: "modeGuides",
  afterDatasetsDraw(chart) {
    if (modes.length < 2) return;
    const { ctx, chartArea, scales } = chart;
    const xScale = scales.x;
    const yScale = scales.y;
    ctx.save();
    ctx.strokeStyle = hexToRgba(t.inkSoft, 0.5);
    ctx.lineWidth = 1;
    ctx.setLineDash([4, 4]);
    ctx.font = "12px sans-serif";
    ctx.fillStyle = t.inkSoft;
    ctx.textAlign = "center";
    ctx.textBaseline = "top";
    const lineTop = chartArea.top + 16;
    modes.forEach((mode, i) => {
      const xPixel = xScale.getPixelForValue(mode.x);
      const yPixel = yScale.getPixelForValue(mode.y);
      ctx.beginPath();
      ctx.moveTo(xPixel, lineTop);
      ctx.lineTo(xPixel, yPixel);
      ctx.stroke();
      ctx.fillText(modeLabels[i], xPixel, chartArea.top);
    });
    ctx.restore();
  },
};

// --- Chart ---------------------------------------------------------------------
new Chart(canvas, {
  type: "line",
  data: {
    datasets: [
      {
        label: "Density estimate",
        data: curve,
        parsing: false,
        borderColor: brand,
        backgroundColor: hexToRgba(brand, 0.2),
        borderWidth: 3,
        fill: "origin",
        tension: 0.3,
        pointRadius: 0,
      },
    ],
  },
  options: {
    responsive: true,
    maintainAspectRatio: false,
    animation: false,
    layout: { padding: { top: 4, bottom: 4 } },
    plugins: {
      title: {
        display: true,
        text: "density-rug · javascript · chartjs · anyplot.ai",
        color: t.ink,
        font: { size: 22 },
        padding: { bottom: 20 },
      },
      legend: { display: false },
      tooltip: { enabled: false },
    },
    scales: {
      x: {
        type: "linear",
        min: gridMin,
        max: gridMax,
        ticks: { color: t.inkSoft, font: { size: 14 } },
        grid: { display: false },
        border: { color: t.inkSoft },
        title: {
          display: true,
          text: "First Response Time (minutes)",
          color: t.ink,
          font: { size: 16 },
        },
      },
      y: {
        beginAtZero: true,
        suggestedMax: peakDensity * 1.2,
        ticks: { color: t.inkSoft, font: { size: 14 } },
        grid: { color: t.grid },
        border: { display: false },
        title: {
          display: true,
          text: "Density",
          color: t.ink,
          font: { size: 16 },
        },
      },
    },
  },
  plugins: [rugPlugin, modeGuidesPlugin],
});
Runnable source as JSON, for any HTTP client: https://api.anyplot.ai/specs/density-rug/chartjs/code. Any spec id and library id listed in llms-full.txt fit the same URL shape; every URL below is complete and callable.
{
  "spec_id": "density-rug",
  "language": "javascript",
  "library": "chartjs",
  "page": "https://anyplot.ai/density-rug/javascript/chartjs",
  "hub": "https://anyplot.ai/density-rug",
  "code_json": "https://api.anyplot.ai/specs/density-rug/chartjs/code",
  "spec_json": "https://api.anyplot.ai/specs/density-rug",
  "render_light_png": "https://storage.googleapis.com/anyplot-images/plots/density-rug/javascript/chartjs/plot-light.png",
  "render_dark_png": "https://storage.googleapis.com/anyplot-images/plots/density-rug/javascript/chartjs/plot-dark.png",
  "interactive_light_html": "https://storage.googleapis.com/anyplot-images/plots/density-rug/javascript/chartjs/plot-light.html",
  "interactive_dark_html": "https://storage.googleapis.com/anyplot-images/plots/density-rug/javascript/chartjs/plot-dark.html",
  "quality_score": 94.0,
  "license": "MIT",
  "guide": "https://anyplot.ai/llms.txt"
}
Part of Density Plot with Rug Marks on anyplot.ai.