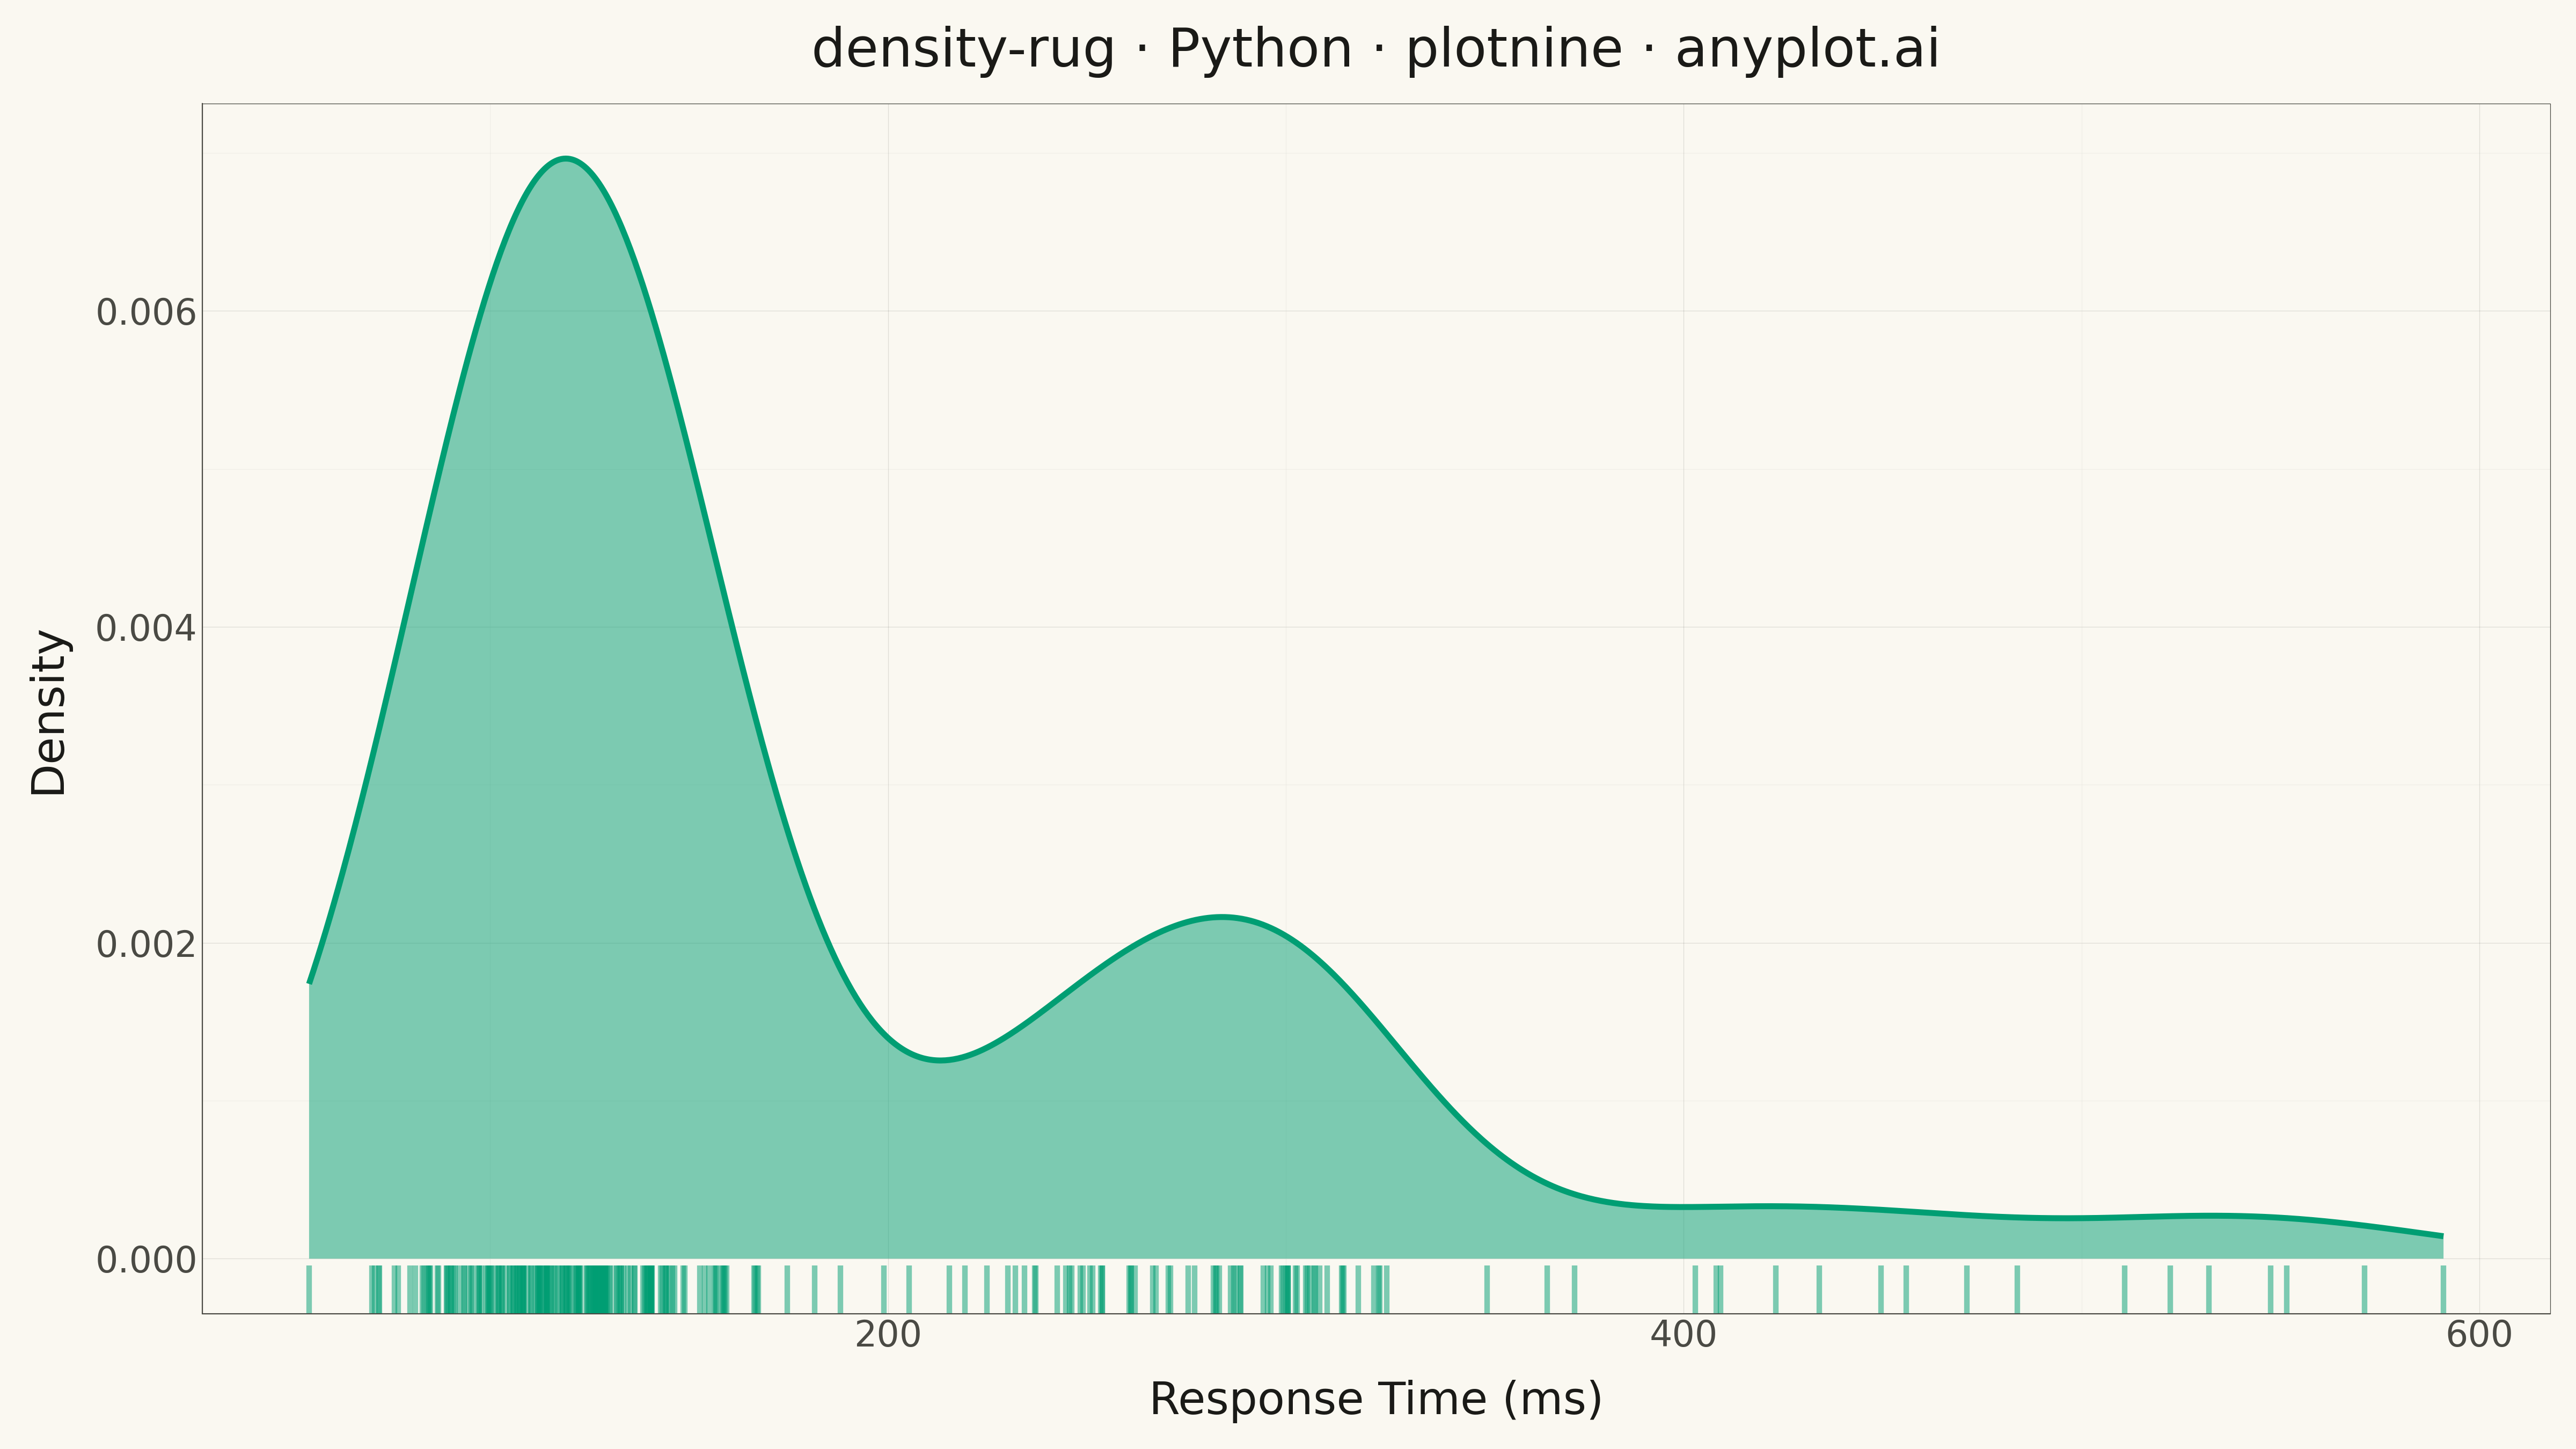
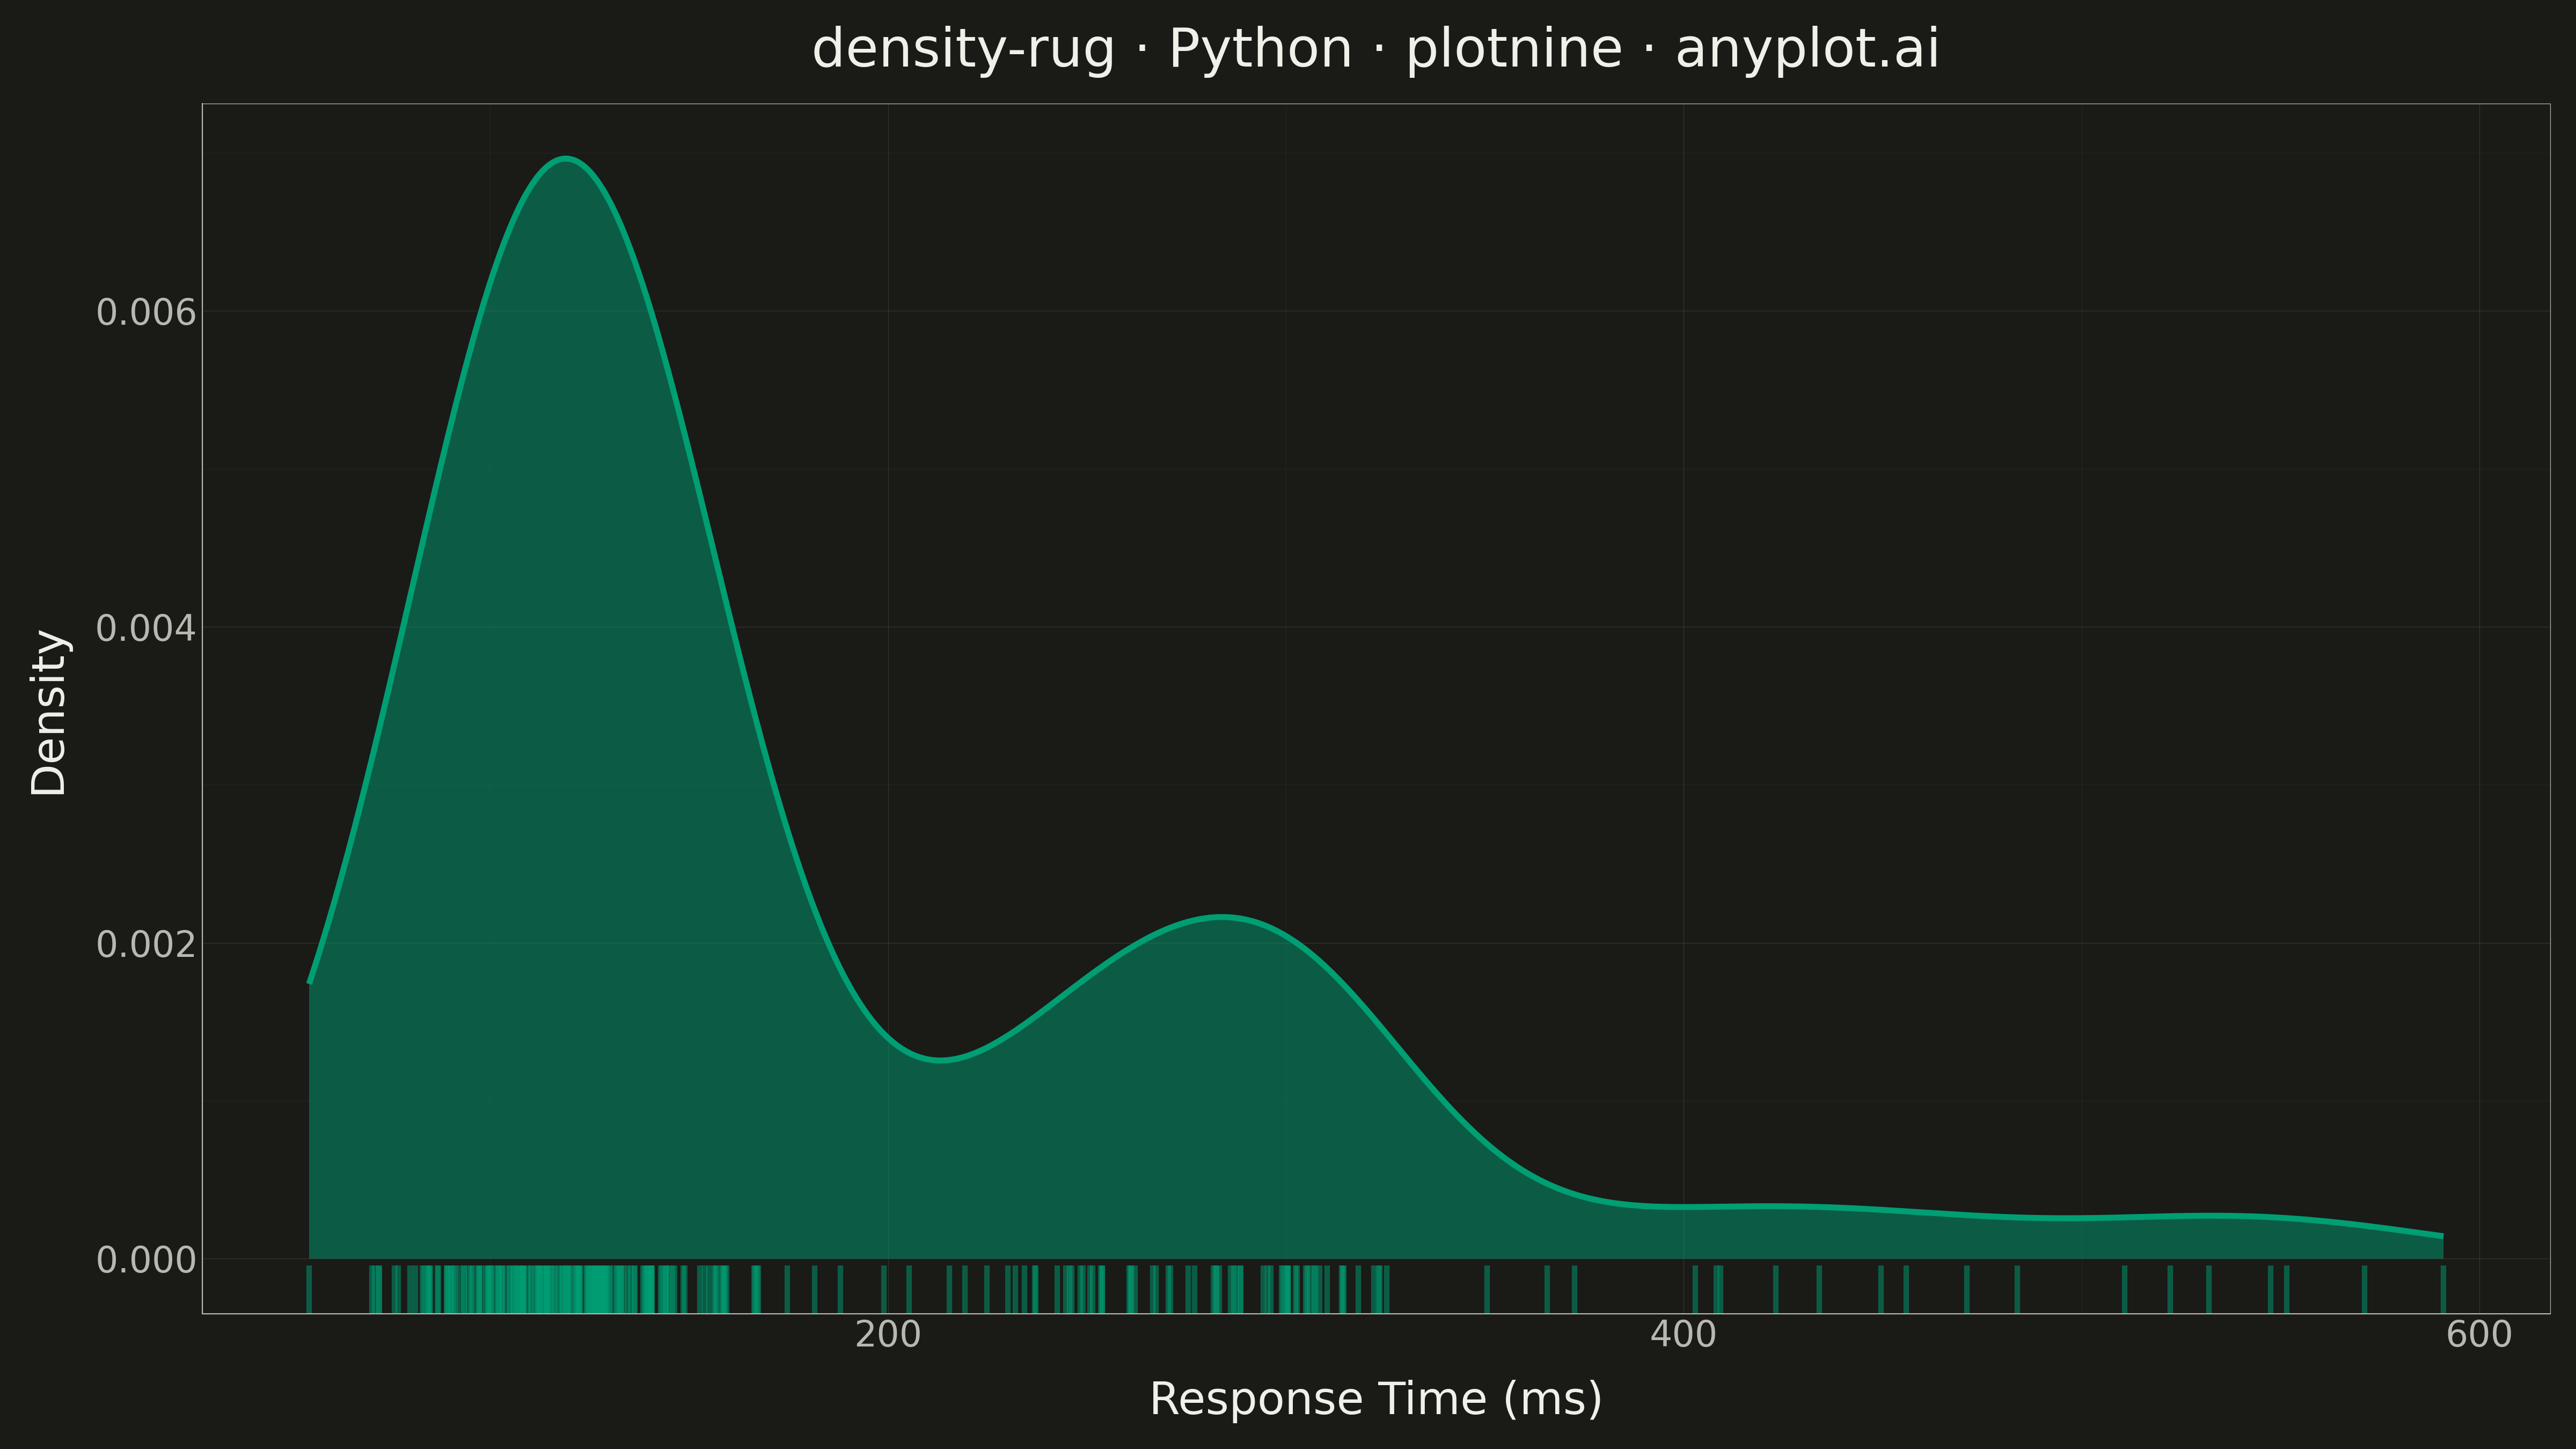
A kernel density estimation (KDE) plot combined with rug marks along the x-axis, showing both the smoothed probability distribution and the exact location of each individual data point. This combination provides the best of both worlds: the KDE reveals the overall shape, modality, and smoothed density of the distribution, while the rug marks preserve transparency about where actual observations fall, highlighting data density and potential gaps.
""" anyplot.ai
density-rug: Density Plot with Rug Marks
Library: plotnine 0.15.4 | Python 3.13.13
Quality: 93/100 | Updated: 2026-05-18
"""

import os

import numpy as np
import pandas as pd
from plotnine import (
    aes,
    element_line,
    element_rect,
    element_text,
    geom_density,
    geom_rug,
    ggplot,
    labs,
    theme,
    theme_minimal,
)


# Theme tokens
THEME = os.getenv("ANYPLOT_THEME", "light")
PAGE_BG = "#FAF8F1" if THEME == "light" else "#1A1A17"
ELEVATED_BG = "#FFFDF6" if THEME == "light" else "#242420"
INK = "#1A1A17" if THEME == "light" else "#F0EFE8"
INK_SOFT = "#4A4A44" if THEME == "light" else "#B8B7B0"
BRAND = "#009E73"  # Okabe-Ito position 1

# Data - Response times for a web API (bimodal distribution with outliers)
np.random.seed(42)
fast_responses = np.random.normal(loc=120, scale=25, size=180)
slow_responses = np.random.normal(loc=280, scale=40, size=70)
response_times = np.concatenate([fast_responses, slow_responses])
response_times = response_times[response_times > 0]
# Add more extreme outliers to showcase rug mark utility
outliers = np.random.uniform(400, 600, size=15)
response_times = np.concatenate([response_times, outliers])

df = pd.DataFrame({"response_time": response_times})

# Plot
plot = (
    ggplot(df, aes(x="response_time"))
    + geom_density(fill=BRAND, alpha=0.5, color=BRAND, size=1.5)
    + geom_rug(alpha=0.5, sides="b", size=1.4, color=BRAND, length=0.04)
    + labs(x="Response Time (ms)", y="Density", title="density-rug · Python · plotnine · anyplot.ai")
    + theme_minimal()
    + theme(
        figure_size=(16, 9),
        plot_background=element_rect(fill=PAGE_BG, color=PAGE_BG),
        panel_background=element_rect(fill=PAGE_BG),
        panel_grid_major=element_line(color=INK, size=0.3, alpha=0.12),
        panel_grid_minor=element_line(color=INK, size=0.2, alpha=0.06),
        panel_border=element_rect(color=INK_SOFT, fill=None, size=0.3),
        axis_title=element_text(size=20, color=INK),
        axis_text=element_text(size=16, color=INK_SOFT),
        axis_line=element_line(color=INK_SOFT, size=0.5),
        plot_title=element_text(size=24, color=INK),
    )
)

# Save
plot.save(f"plot-{THEME}.png", dpi=300, verbose=False)
Runnable source as JSON, for any HTTP client: https://api.anyplot.ai/specs/density-rug/plotnine/code. Any spec id and library id listed in llms-full.txt fit the same URL shape; every URL below is complete and callable.
{
  "spec_id": "density-rug",
  "language": "python",
  "library": "plotnine",
  "page": "https://anyplot.ai/density-rug/python/plotnine",
  "hub": "https://anyplot.ai/density-rug",
  "code_json": "https://api.anyplot.ai/specs/density-rug/plotnine/code",
  "spec_json": "https://api.anyplot.ai/specs/density-rug",
  "render_light_png": "https://storage.googleapis.com/anyplot-images/plots/density-rug/python/plotnine/plot-light.png",
  "render_dark_png": "https://storage.googleapis.com/anyplot-images/plots/density-rug/python/plotnine/plot-dark.png",
  "quality_score": 93.0,
  "license": "MIT",
  "guide": "https://anyplot.ai/llms.txt"
}
Part of Density Plot with Rug Marks on anyplot.ai.