The same plot in 14 other libraries — JavaScript: Chart.js, D3.js, Highcharts, MUI X Charts; Python: Altair, Bokeh, lets-plot, Matplotlib, Plotly, plotnine, Pygal, Seaborn; R: ggplot2; Julia: Makie.jl. Compare all 15 side by side: Density Plot with Rug Marks in Python, R, Julia and JavaScript.
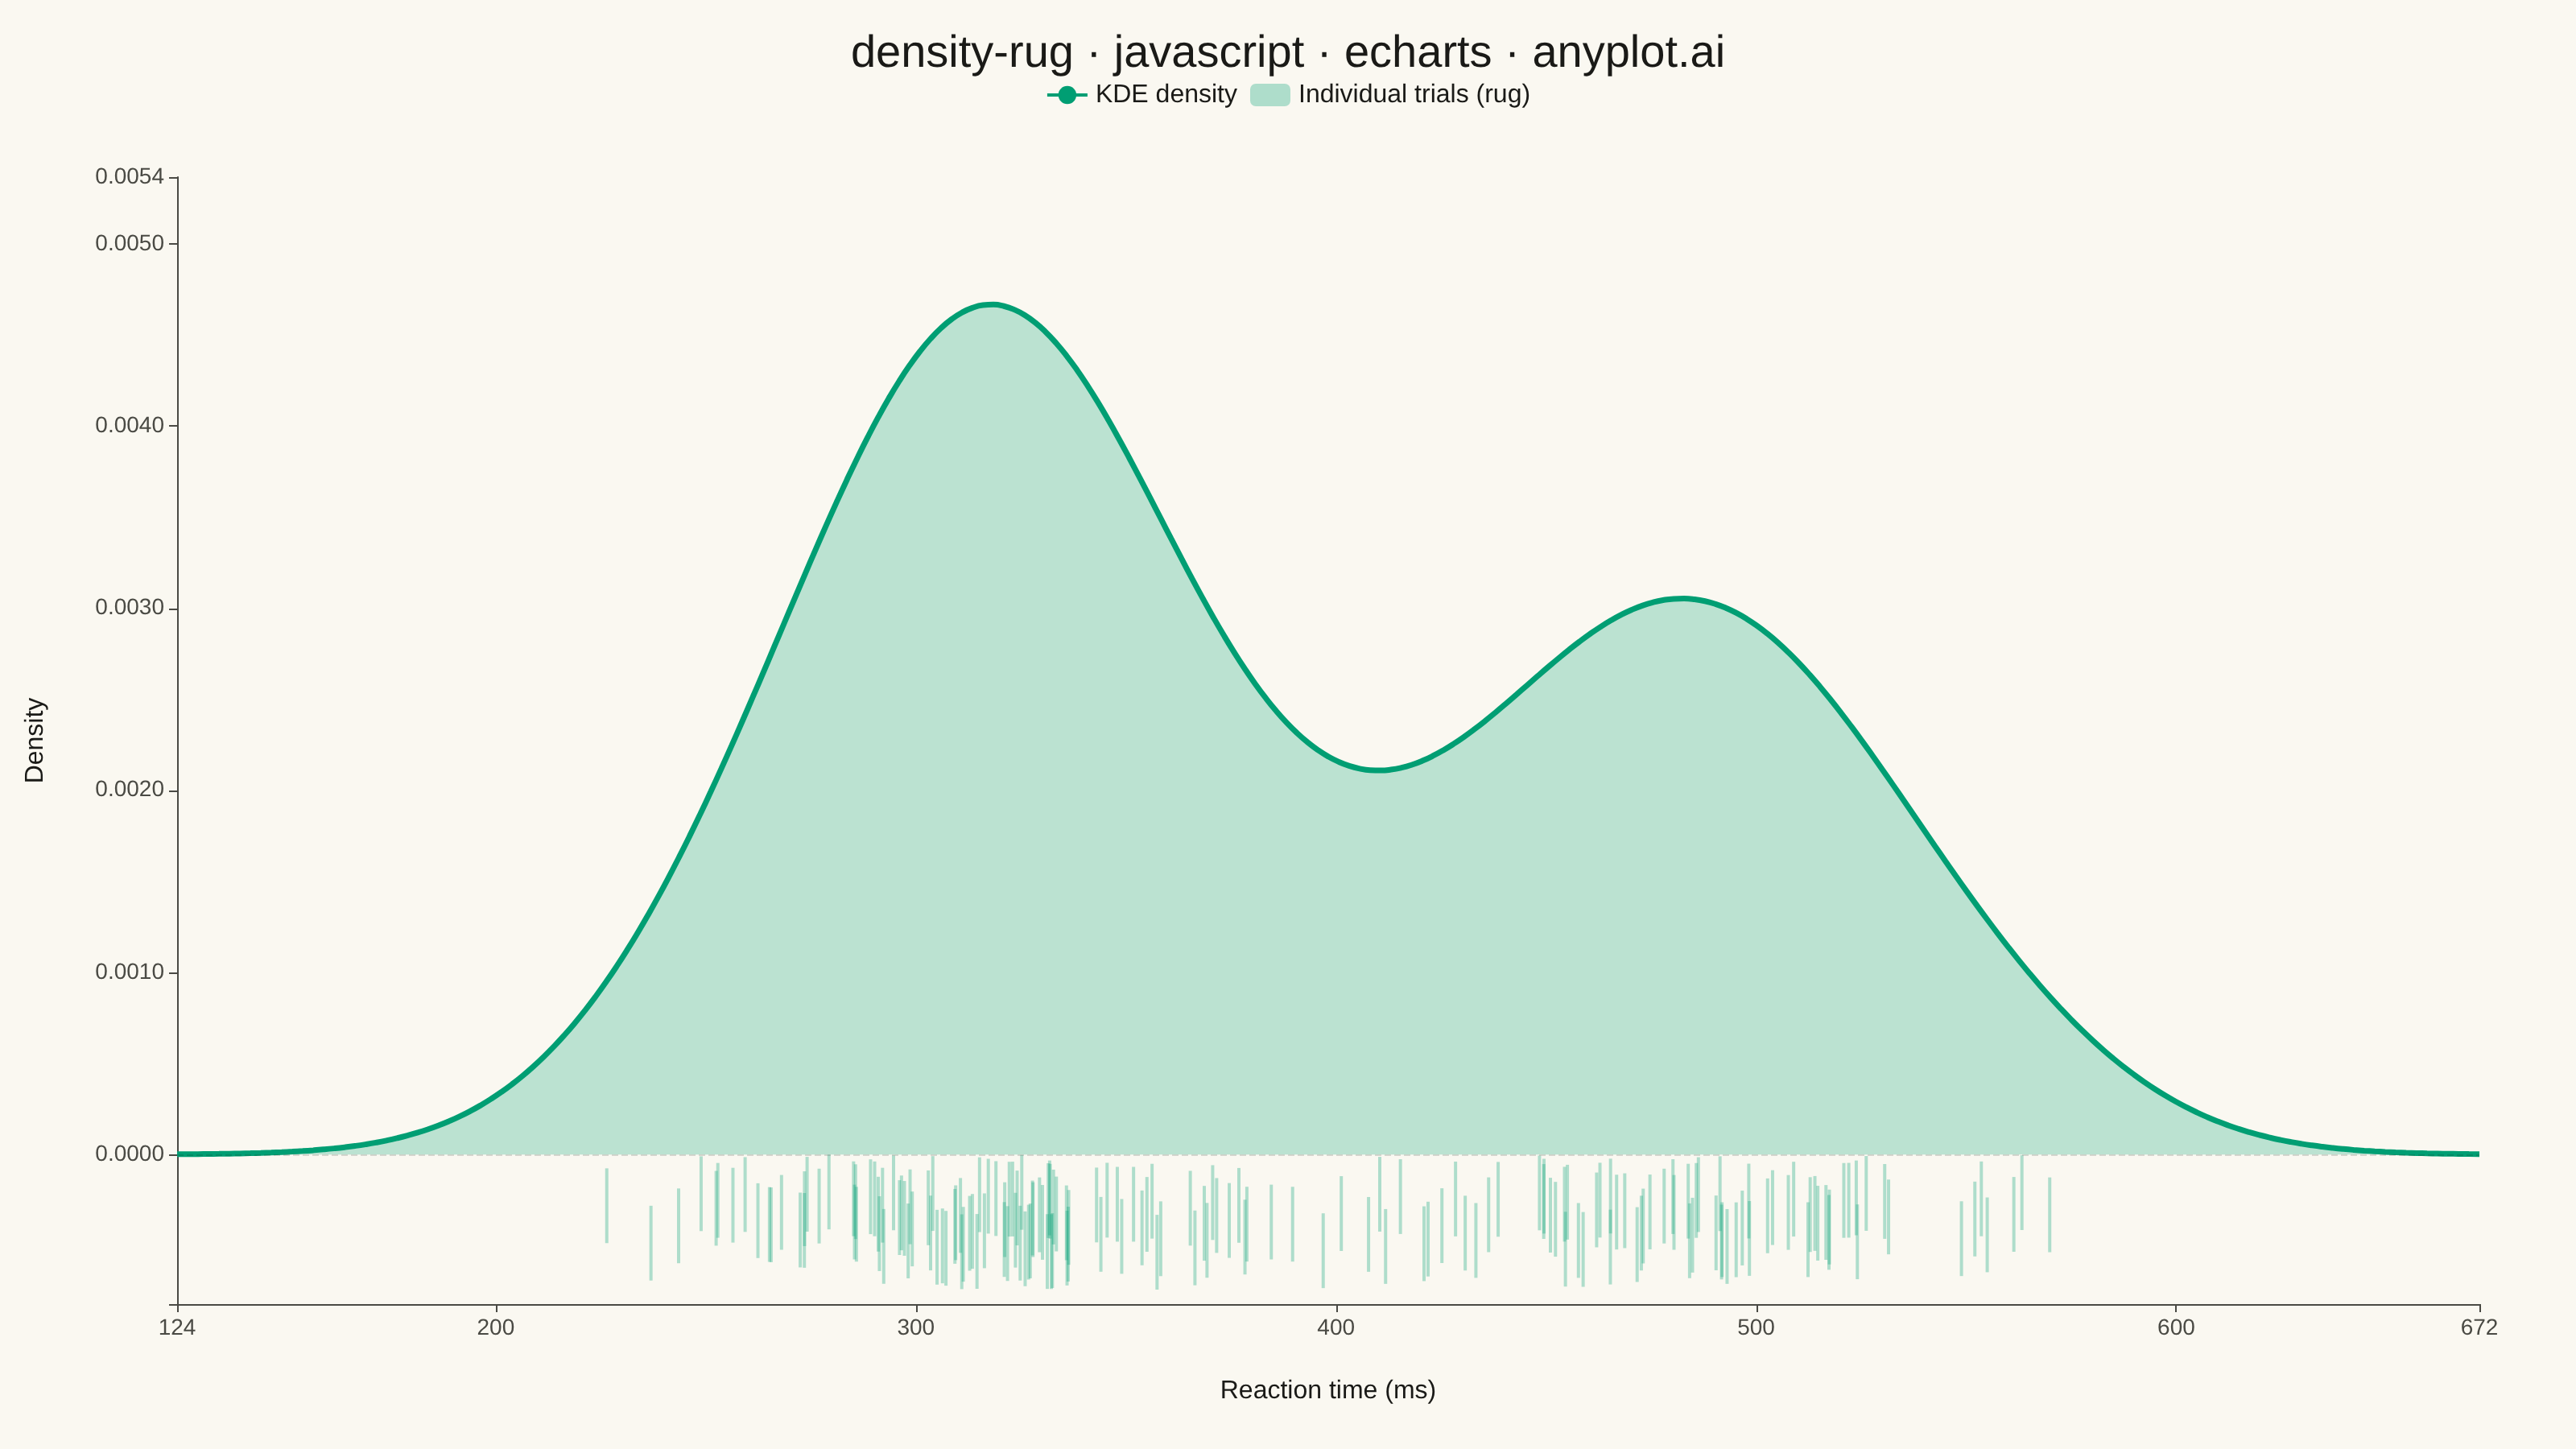
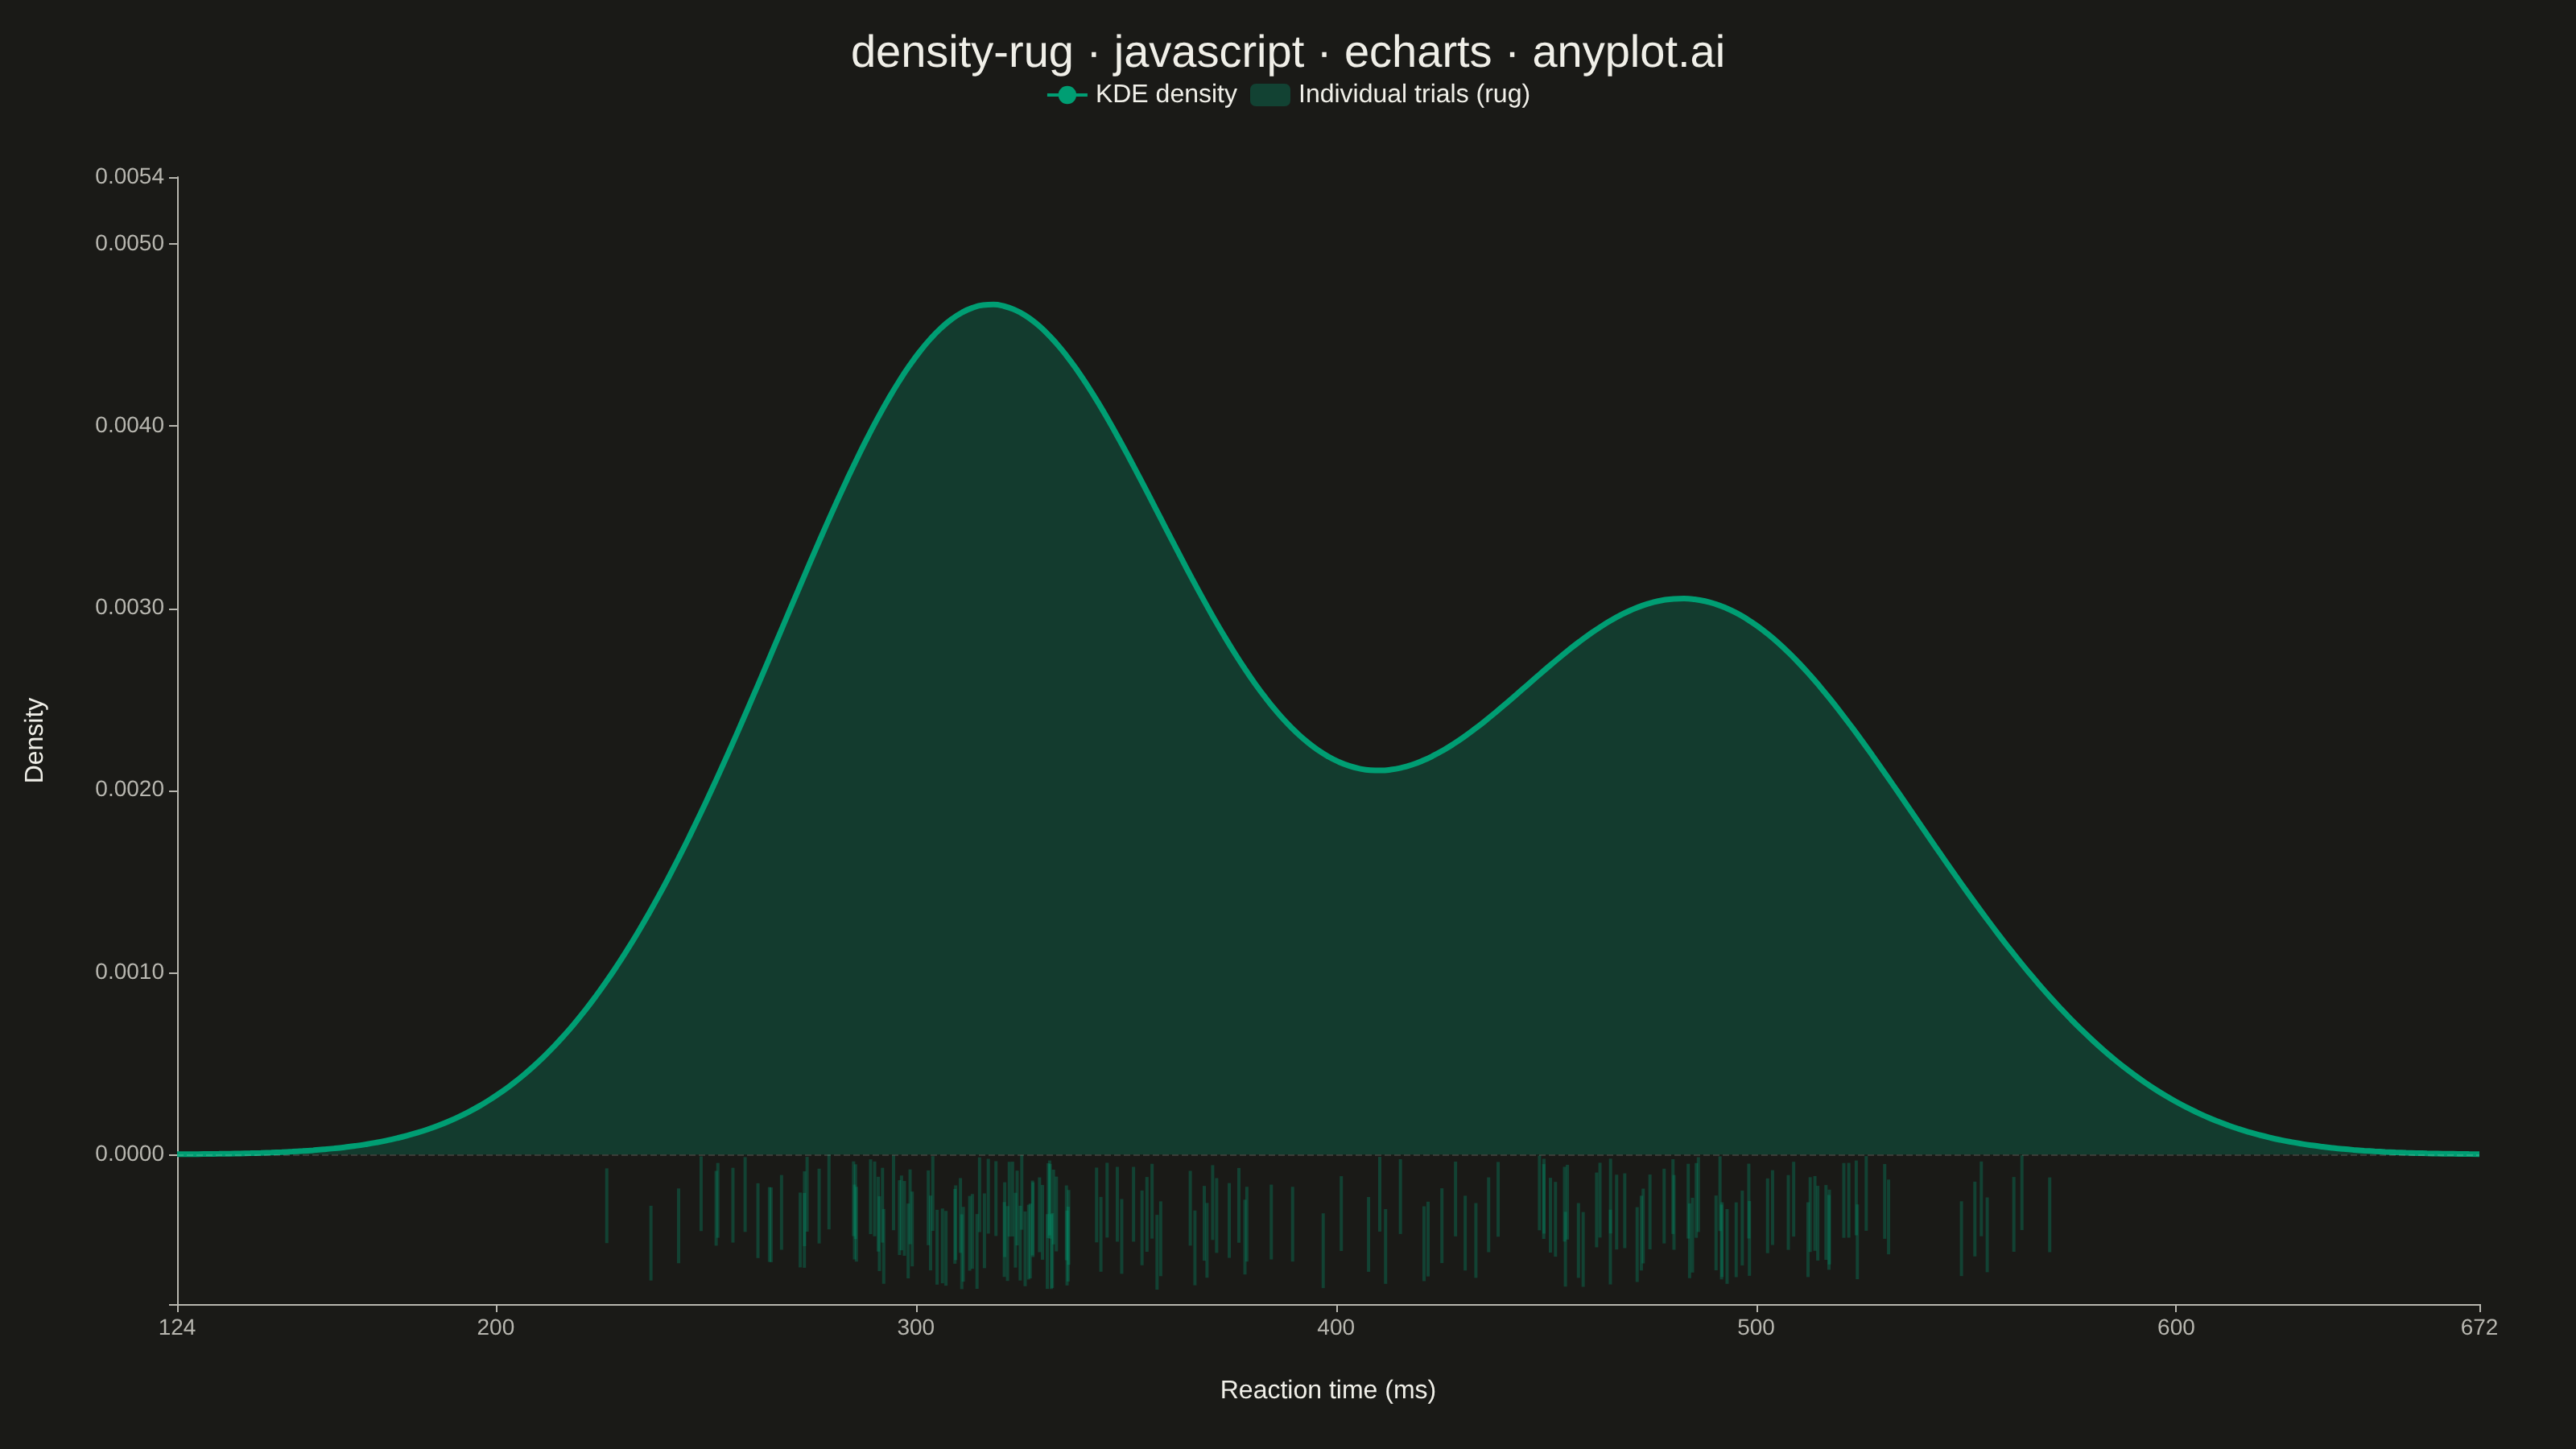
A kernel density estimation (KDE) plot combined with rug marks along the x-axis, showing both the smoothed probability distribution and the exact location of each individual data point. This combination provides the best of both worlds: the KDE reveals the overall shape, modality, and smoothed density of the distribution, while the rug marks preserve transparency about where actual observations fall, highlighting data density and potential gaps.
// anyplot.ai
// density-rug: Density Plot with Rug Marks
// Library: echarts 6.1.0 | JavaScript 22.23.2
// Quality: 91/100 | Created: 2026-09-02

const t = window.ANYPLOT_TOKENS;

// --- Data (in-memory, deterministic fixed-seed LCG) -------------------------
function makeLcg(seed) {
  let state = seed >>> 0;
  return () => {
    state = (1103515245 * state + 12345) >>> 0;
    return state / 4294967296;
  };
}
const rand = makeLcg(42);

function gaussianSample() {
  const u1 = Math.max(rand(), 1e-9);
  const u2 = rand();
  return Math.sqrt(-2 * Math.log(u1)) * Math.cos(2 * Math.PI * u2);
}

// Reaction times (ms) from a two-speed mixture of responders — a KDE reveals
// the bimodal shape that a plain histogram bin width could easily hide, and
// the rug preserves exactly which trials produced each reading.
const sampleSize = 180;
const reactionTimesMs = [];
for (let i = 0; i < sampleSize; i++) {
  const isQuickResponder = rand() < 0.55;
  const mean = isQuickResponder ? 320 : 480;
  const std = isQuickResponder ? 35 : 50;
  reactionTimesMs.push(mean + gaussianSample() * std);
}

// --- Kernel density estimate --------------------------------------------------
const n = reactionTimesMs.length;
const meanMs = reactionTimesMs.reduce((sum, v) => sum + v, 0) / n;
const variance =
  reactionTimesMs.reduce((sum, v) => sum + (v - meanMs) ** 2, 0) / (n - 1);
const stdMs = Math.sqrt(variance);
const bandwidth = 1.06 * stdMs * Math.pow(n, -1 / 5); // Silverman's rule of thumb

function densityAt(x) {
  const sum = reactionTimesMs.reduce((acc, xi) => {
    const u = (x - xi) / bandwidth;
    return acc + Math.exp(-0.5 * u * u) / Math.sqrt(2 * Math.PI);
  }, 0);
  return sum / (n * bandwidth);
}

const minObs = Math.min(...reactionTimesMs);
const maxObs = Math.max(...reactionTimesMs);
const gridStart = minObs - 3 * bandwidth;
const gridEnd = maxObs + 3 * bandwidth;
const gridSteps = 220;
const densityPoints = [];
for (let i = 0; i <= gridSteps; i++) {
  const x = gridStart + ((gridEnd - gridStart) * i) / gridSteps;
  densityPoints.push([x, densityAt(x)]);
}
const maxDensity = Math.max(...densityPoints.map((p) => p[1]));

// Reserve a band below zero (never rendered as a labelled tick) for the rug.
// Ticks are shorter than the band and jittered vertically within it so a
// dense cluster of nearby x-values scatters into visible texture instead of
// merging into a solid block.
const rugBandTop = 0;
const rugBandBottom = -maxDensity * 0.16;
const yAxisMin = rugBandBottom * 1.1;
const yAxisMax = maxDensity * 1.15;

const rugTickHeight = (rugBandTop - rugBandBottom) * 0.55;
const rugJitterRange = rugBandTop - rugBandBottom - rugTickHeight;
const jitterRand = makeLcg(7);
const rugTickTops = reactionTimesMs.map(() => -jitterRand() * rugJitterRange);

// --- Init ---------------------------------------------------------------------
const chart = echarts.init(document.getElementById("container"));

// --- Option ---------------------------------------------------------------------
chart.setOption({
  animation: false,
  color: t.palette,
  backgroundColor: "transparent",
  title: {
    text: "density-rug · javascript · echarts · anyplot.ai",
    left: "center",
    textStyle: { color: t.ink, fontSize: 28, fontWeight: 500 },
  },
  legend: {
    top: 46,
    data: ["KDE density", "Individual trials (rug)"],
    textStyle: { color: t.ink, fontSize: 16 },
  },
  grid: { left: 110, right: 60, top: 110, bottom: 90 },
  tooltip: {
    trigger: "item",
    backgroundColor: t.elevatedBg,
    borderColor: t.grid,
    textStyle: { color: t.ink },
  },
  xAxis: {
    type: "value",
    name: "Reaction time (ms)",
    nameLocation: "middle",
    nameGap: 46,
    nameTextStyle: { color: t.ink, fontSize: 16 },
    min: gridStart,
    max: gridEnd,
    axisLine: { onZero: false, lineStyle: { color: t.inkSoft } },
    axisLabel: {
      color: t.inkSoft,
      fontSize: 14,
      formatter: (value) => Math.round(value).toString(),
    },
    splitLine: { show: false },
  },
  yAxis: {
    type: "value",
    name: "Density",
    nameLocation: "middle",
    nameGap: 80,
    nameTextStyle: { color: t.ink, fontSize: 16 },
    min: yAxisMin,
    max: yAxisMax,
    axisLine: { lineStyle: { color: t.inkSoft } },
    axisLabel: {
      color: t.inkSoft,
      fontSize: 14,
      formatter: (value) => (value < 0 ? "" : value.toFixed(4)),
    },
    splitLine: { show: false },
  },
  series: [
    {
      name: "KDE density",
      type: "line",
      data: densityPoints,
      smooth: true,
      symbol: "none",
      lineStyle: { color: t.palette[0], width: 3.5 },
      areaStyle: { color: t.palette[0], opacity: 0.25 },
      z: 2,
      markLine: {
        silent: true,
        symbol: "none",
        animation: false,
        lineStyle: { color: t.grid, width: 1 },
        label: { show: false },
        data: [{ yAxis: 0 }],
      },
    },
    {
      name: "Individual trials (rug)",
      type: "custom",
      coordinateSystem: "cartesian2d",
      data: reactionTimesMs,
      itemStyle: { color: t.palette[0], opacity: 0.3 },
      z: 3,
      renderItem: (params, api) => {
        const value = api.value(0);
        const top = rugTickTops[params.dataIndex];
        const bottom = top - rugTickHeight;
        const topPx = api.coord([value, top]);
        const bottomPx = api.coord([value, bottom]);
        return {
          type: "line",
          shape: {
            x1: topPx[0],
            y1: topPx[1],
            x2: bottomPx[0],
            y2: bottomPx[1],
          },
          style: {
            stroke: t.palette[0],
            lineWidth: 2,
            opacity: 0.3,
          },
        };
      },
    },
  ],
});
Runnable source as JSON, for any HTTP client: https://api.anyplot.ai/specs/density-rug/echarts/code. Any spec id and library id listed in llms-full.txt fit the same URL shape; every URL below is complete and callable.
{
  "spec_id": "density-rug",
  "language": "javascript",
  "library": "echarts",
  "page": "https://anyplot.ai/density-rug/javascript/echarts",
  "hub": "https://anyplot.ai/density-rug",
  "code_json": "https://api.anyplot.ai/specs/density-rug/echarts/code",
  "spec_json": "https://api.anyplot.ai/specs/density-rug",
  "render_light_png": "https://storage.googleapis.com/anyplot-images/plots/density-rug/javascript/echarts/plot-light.png",
  "render_dark_png": "https://storage.googleapis.com/anyplot-images/plots/density-rug/javascript/echarts/plot-dark.png",
  "interactive_light_html": "https://storage.googleapis.com/anyplot-images/plots/density-rug/javascript/echarts/plot-light.html",
  "interactive_dark_html": "https://storage.googleapis.com/anyplot-images/plots/density-rug/javascript/echarts/plot-dark.html",
  "quality_score": 91.0,
  "license": "MIT",
  "guide": "https://anyplot.ai/llms.txt"
}
Part of Density Plot with Rug Marks on anyplot.ai.