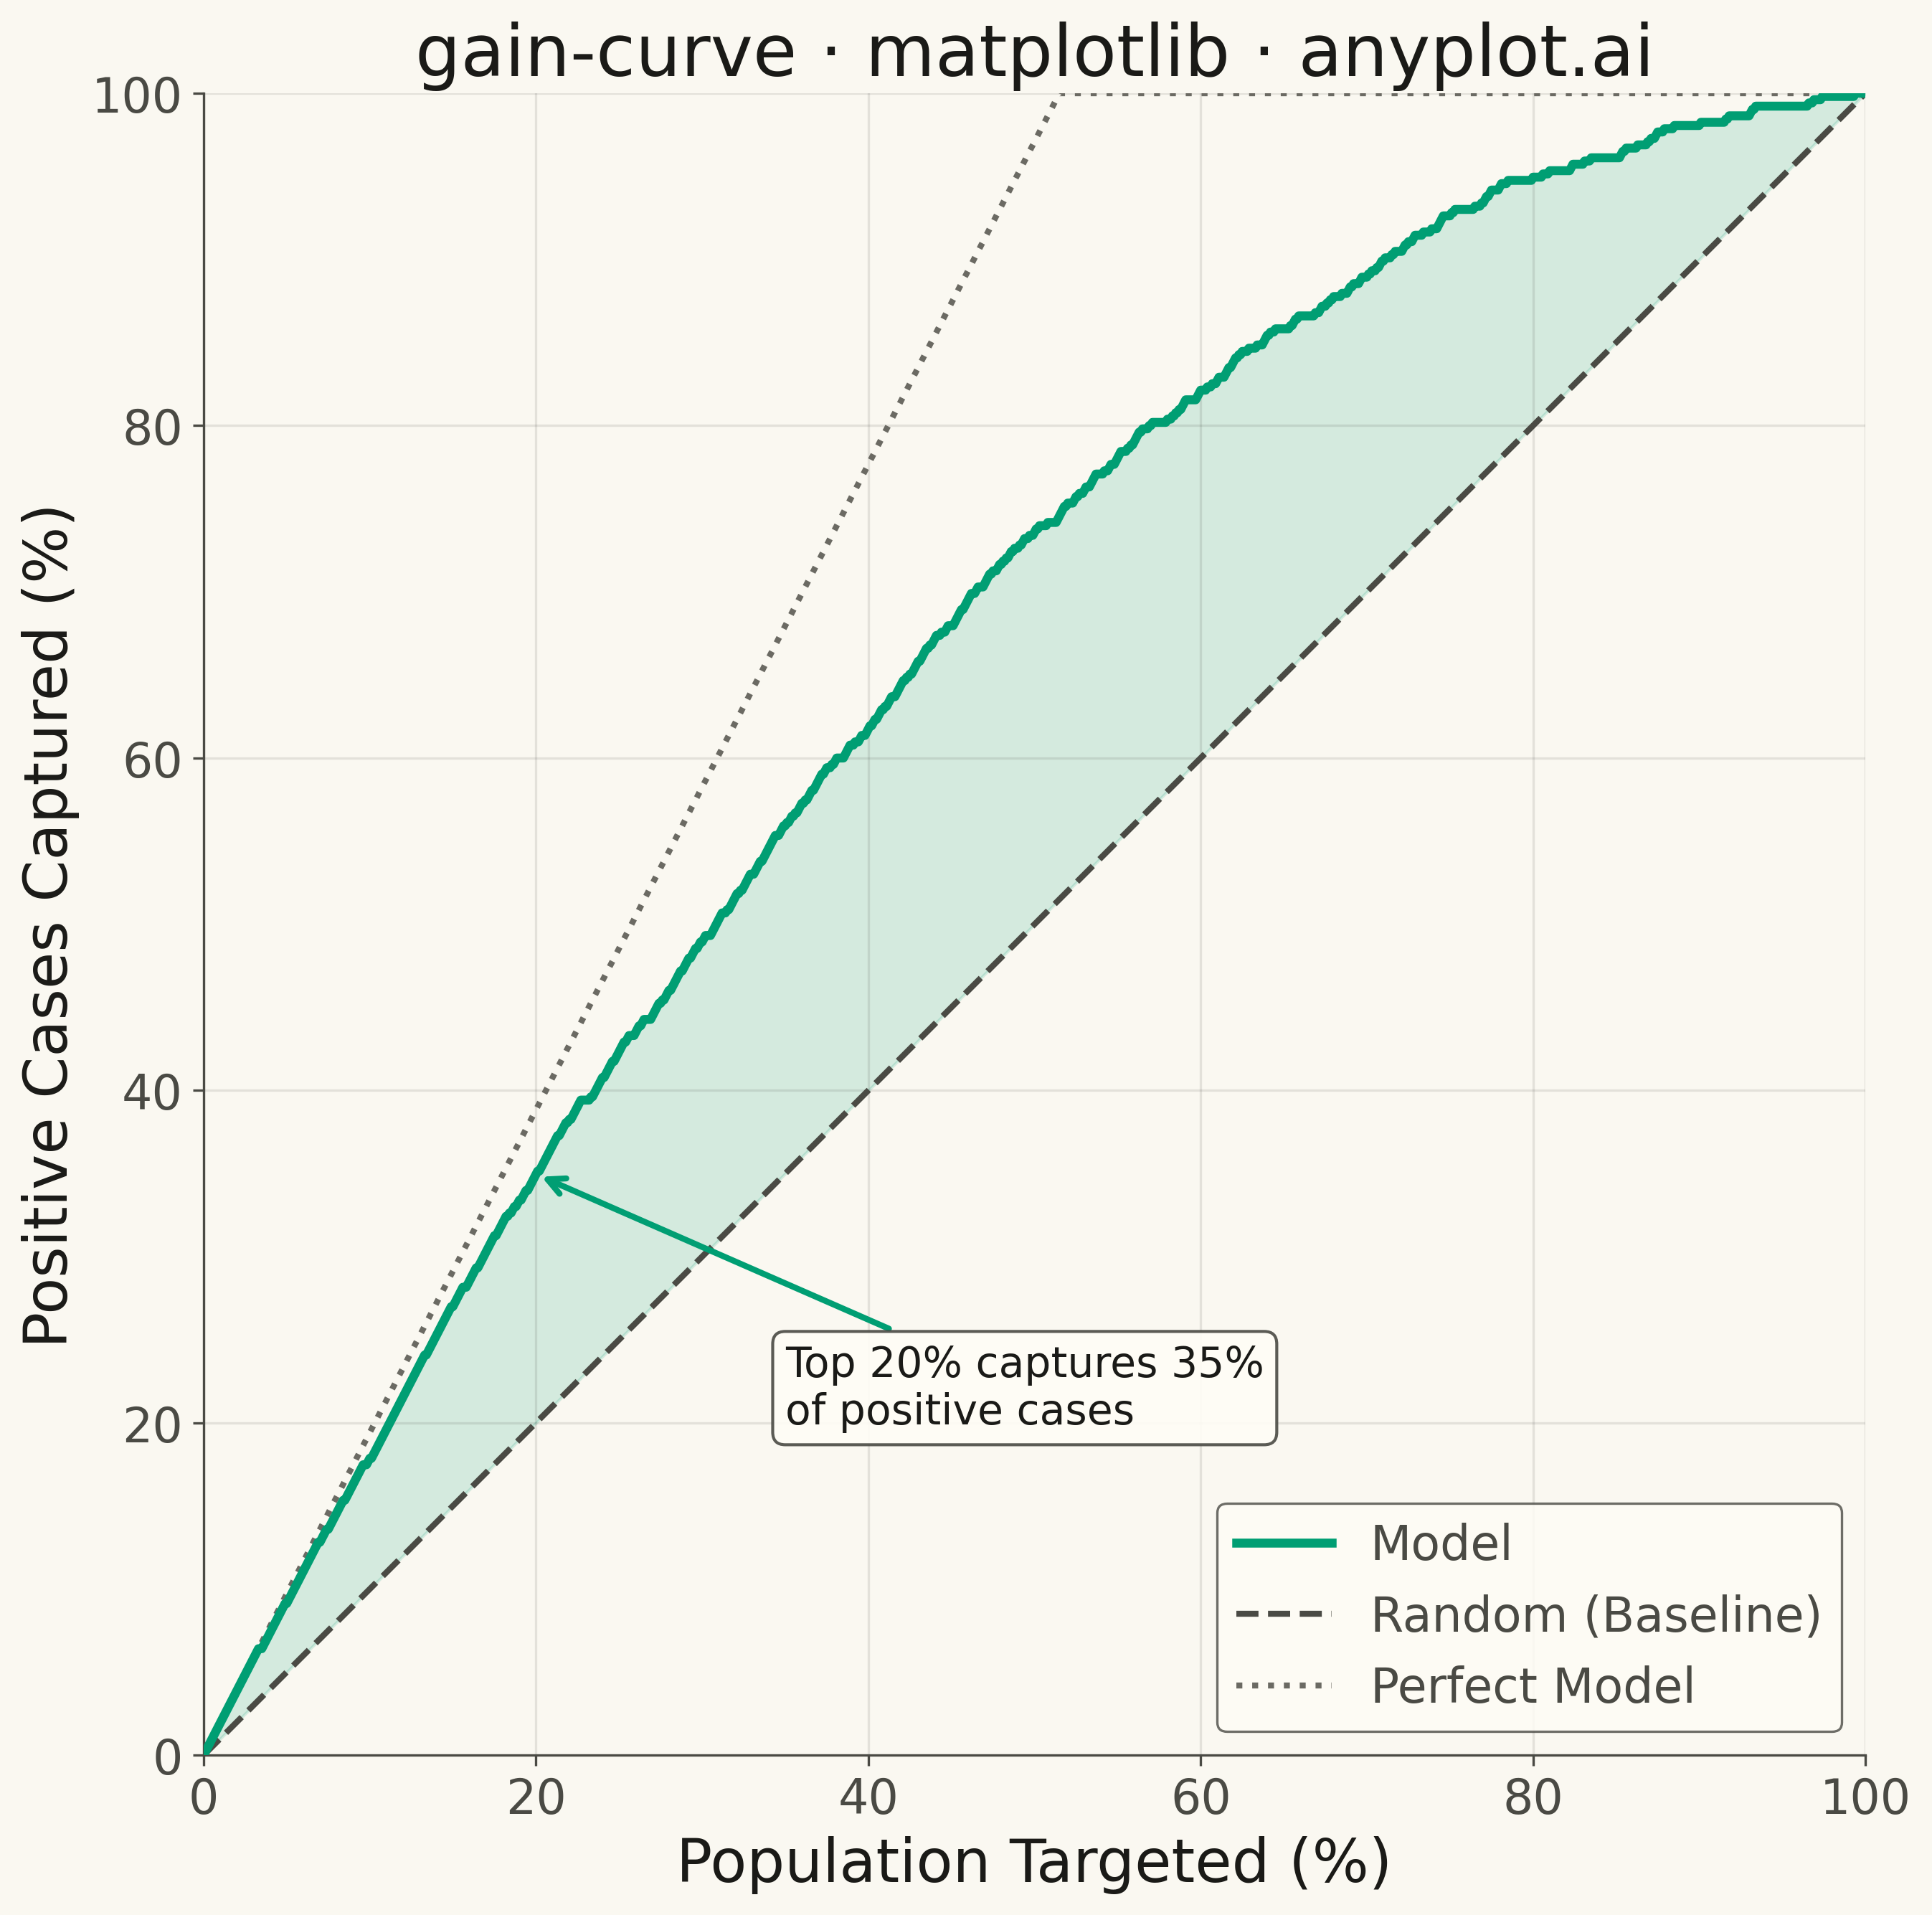
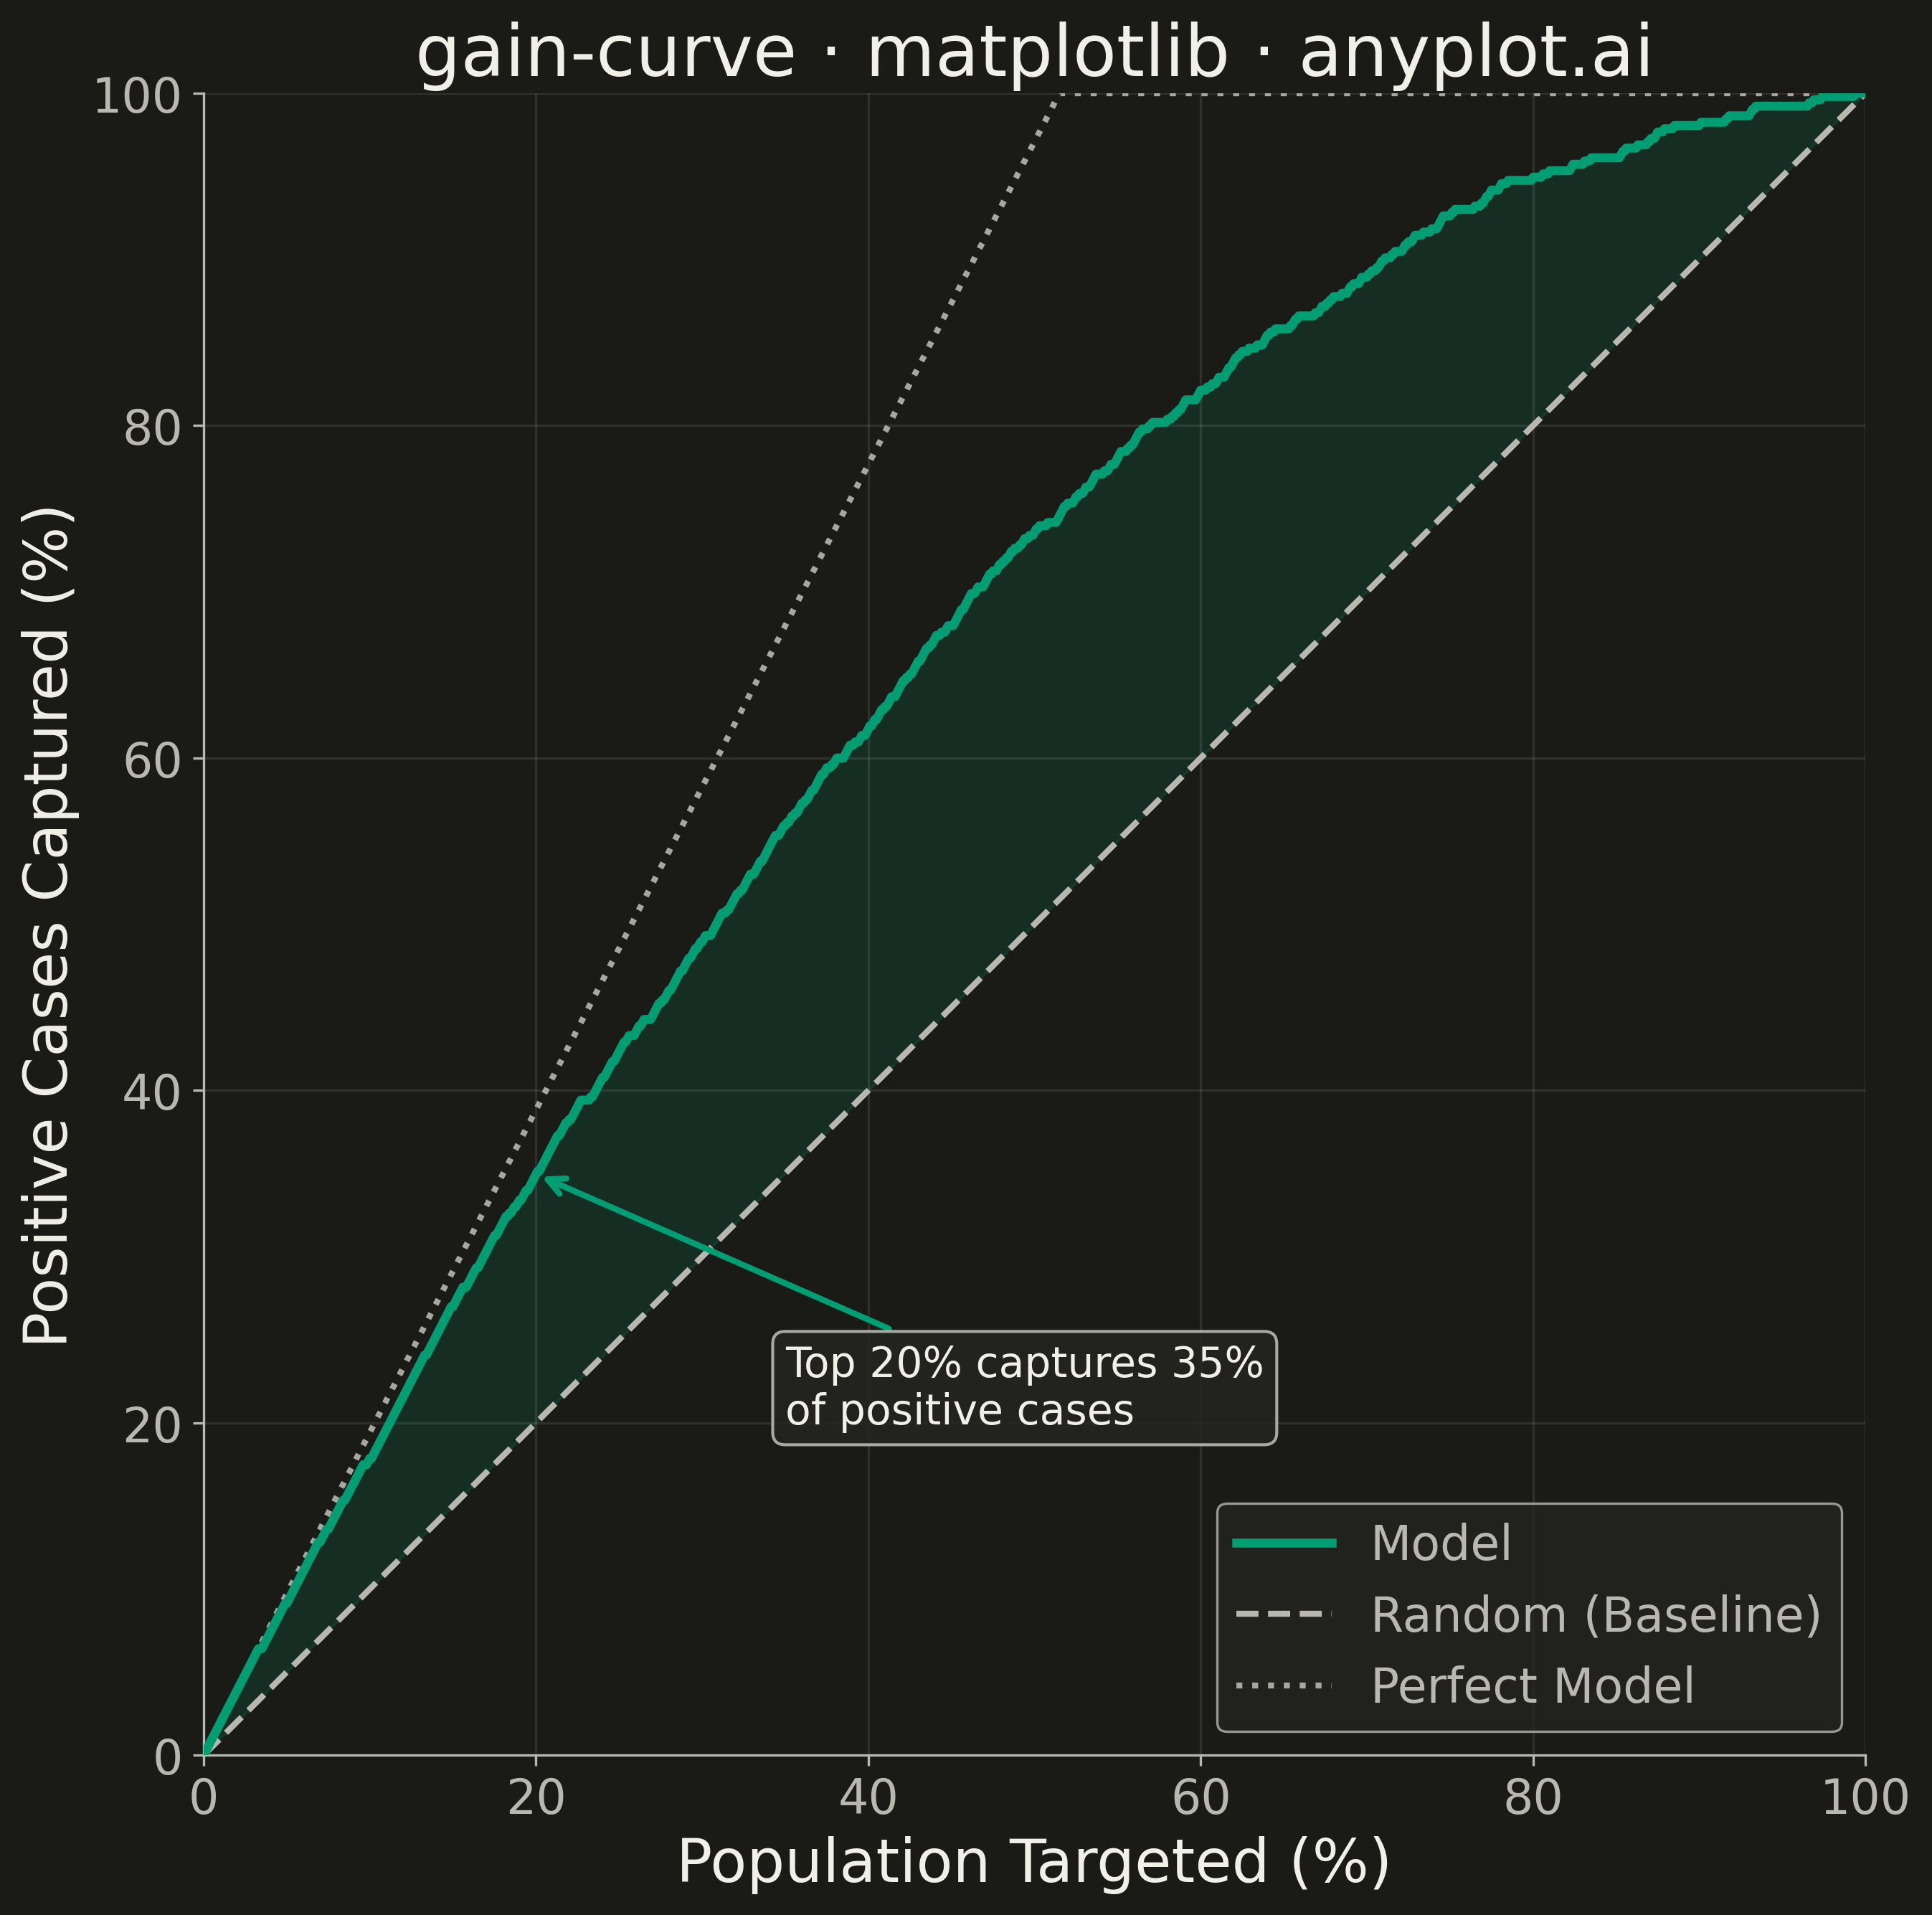
A cumulative gains chart visualizes the effectiveness of a classification model by showing what percentage of positive cases is captured when targeting increasing percentages of the population, ranked by predicted probability. It answers the question: "If I target the top X% of my predictions, what percentage of all actual positives will I capture?" This plot is essential for evaluating targeting strategies in marketing, risk assessment, and resource allocation scenarios.
Preview render from the Matplotlib implementation.