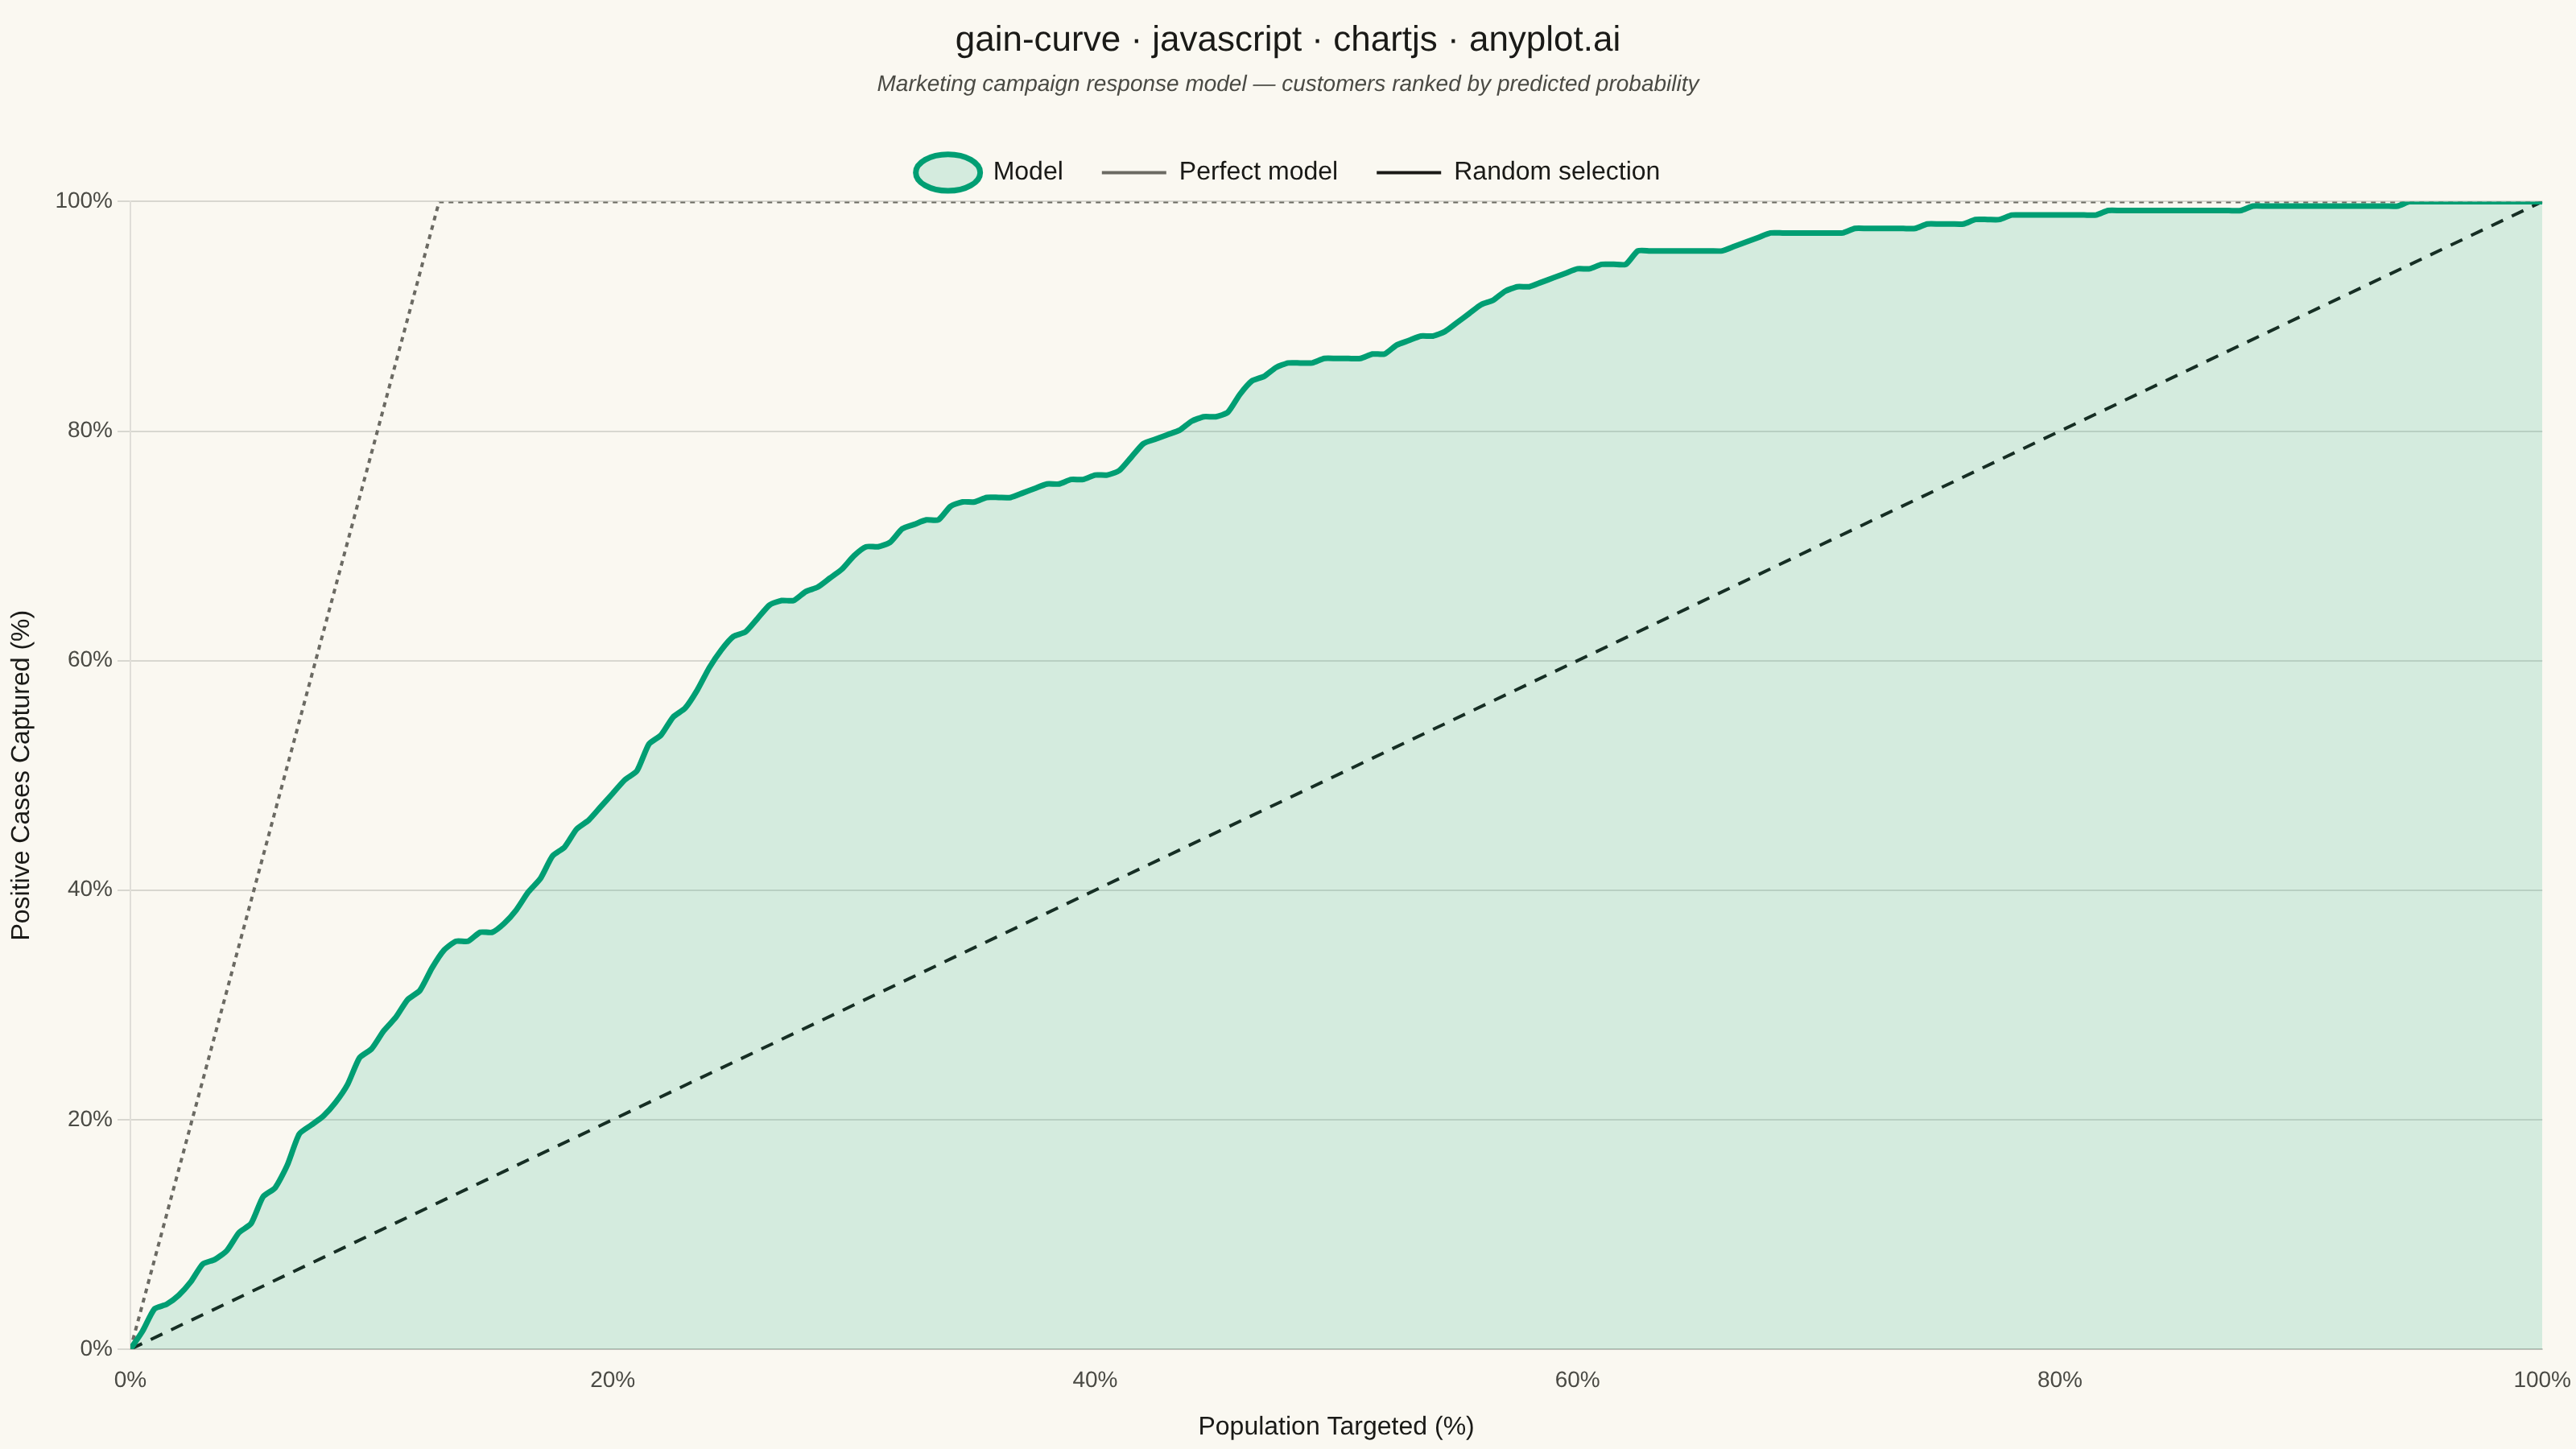
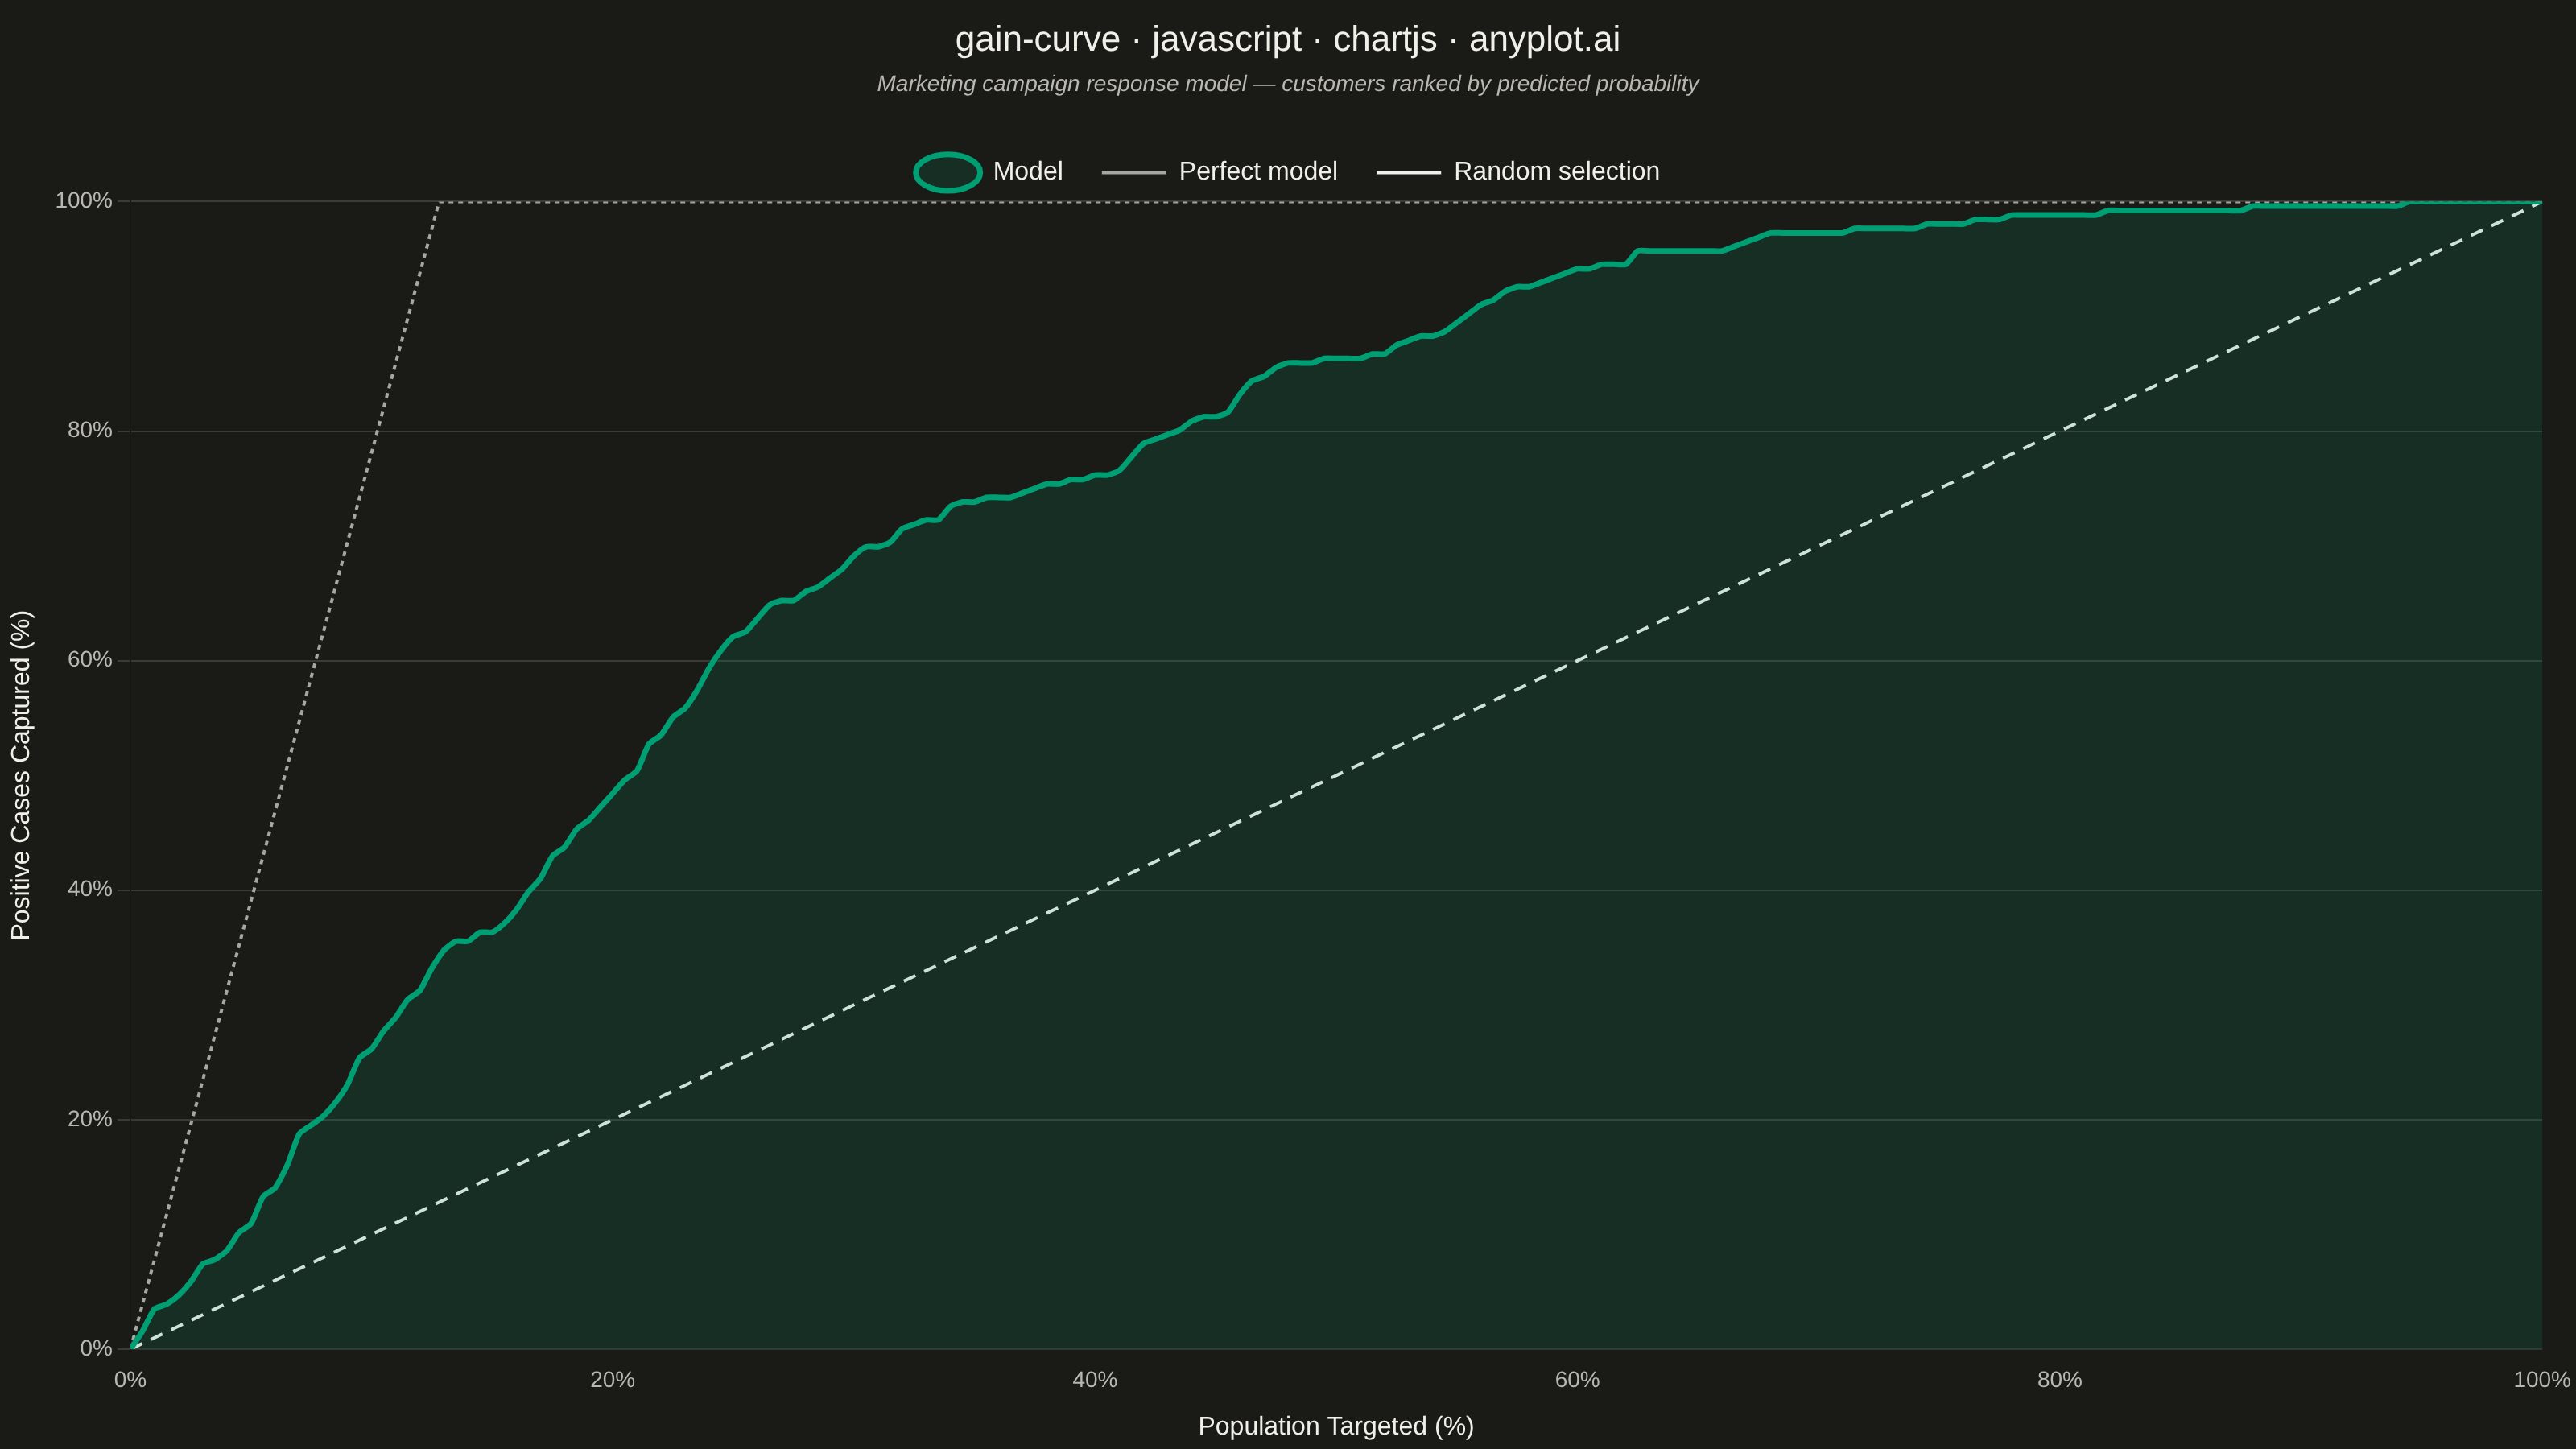
The same plot in 14 other libraries — JavaScript: D3.js, Apache ECharts, Highcharts, MUI X Charts; Python: Altair, Bokeh, lets-plot, Matplotlib, Plotly, plotnine, Pygal, Seaborn; R: ggplot2; Julia: Makie.jl. Compare all 15 side by side: Cumulative Gains Chart in Python, R, Julia and JavaScript.
A cumulative gains chart visualizes the effectiveness of a classification model by showing what percentage of positive cases is captured when targeting increasing percentages of the population, ranked by predicted probability. It answers the question: "If I target the top X% of my predictions, what percentage of all actual positives will I capture?" This plot is essential for evaluating targeting strategies in marketing, risk assessment, and resource allocation scenarios.
// anyplot.ai
// gain-curve: Cumulative Gains Chart
// Library: chartjs 4.4.7 | JavaScript 22.23.2
// Quality: 90/100 | Created: 2026-09-05

//# anyplot-orientation: landscape

const t = window.ANYPLOT_TOKENS;
const INK_MUTED = t.theme === "light" ? "#6B6A63" : "#A8A79F";

function hexToRgba(hex, alpha) {
  const r = parseInt(hex.slice(1, 3), 16);
  const g = parseInt(hex.slice(3, 5), 16);
  const b = parseInt(hex.slice(5, 7), 16);
  return `rgba(${r}, ${g}, ${b}, ${alpha})`;
}

// --- Data: simulated marketing-campaign response model --------------------
// Fixed-seed LCG (no seeded Math.random in the browser)
let seed = 42;
const rand = () => {
  seed = (seed * 1664525 + 1013904223) % 4294967296;
  return seed / 4294967296;
};

const nCustomers = 2000;
const customers = [];
for (let i = 0; i < nCustomers; i++) {
  const affinity = rand(); // latent propensity to respond, uniform 0..1
  const responded = rand() < affinity * affinity * 0.4 ? 1 : 0; // ~13% base rate, concentrated at high affinity
  const score = Math.max(0, Math.min(1, affinity + (rand() - 0.5) * 0.35)); // noisy model prediction of affinity
  customers.push({ responded, score });
}

// Rank by predicted probability, descending — the gains-chart targeting order
customers.sort((a, b) => b.score - a.score);
const totalPositives = customers.reduce((sum, c) => sum + c.responded, 0);
const positiveRatePct = (totalPositives / nCustomers) * 100;

// Model curve: cumulative % of positives captured vs. % of population targeted
const modelCurve = [{ x: 0, y: 0 }];
const stride = Math.ceil(nCustomers / 200); // finer stride than population/100 keeps the curve smooth, not stair-stepped
let cumulativePositives = 0;
for (let i = 0; i < nCustomers; i++) {
  cumulativePositives += customers[i].responded;
  if ((i + 1) % stride === 0 || i === nCustomers - 1) {
    modelCurve.push({
      x: ((i + 1) / nCustomers) * 100,
      y: (cumulativePositives / totalPositives) * 100,
    });
  }
}

// Reference curves
const randomBaseline = [
  { x: 0, y: 0 },
  { x: 100, y: 100 },
];
const perfectModel = [
  { x: 0, y: 0 },
  { x: positiveRatePct, y: 100 },
  { x: 100, y: 100 },
];

// --- Mount ------------------------------------------------------------------
const canvas = document.createElement("canvas");
document.getElementById("container").appendChild(canvas);

// --- Chart -------------------------------------------------------------------
new Chart(canvas, {
  type: "line",
  data: {
    datasets: [
      {
        label: "Model",
        data: modelCurve,
        borderColor: t.palette[0], // Imprint pos 1 — brand green
        backgroundColor: hexToRgba(t.palette[0], 0.15), // low-alpha fill reinforces the "gain" area under the curve
        borderWidth: 3.5,
        pointRadius: 0,
        tension: 0.2,
        fill: "origin",
      },
      {
        label: "Perfect model",
        data: perfectModel,
        borderColor: INK_MUTED,
        backgroundColor: INK_MUTED, // legend swatch fill; line itself has no area fill
        borderWidth: 2,
        borderDash: [3, 3],
        pointRadius: 0,
        pointStyle: "line", // legend swatch reads as a dashed line, matching the on-chart style
        tension: 0,
        fill: false,
      },
      {
        label: "Random selection",
        data: randomBaseline,
        borderColor: t.ink,
        backgroundColor: t.ink, // legend swatch fill; line itself has no area fill
        borderWidth: 2,
        borderDash: [8, 6],
        pointRadius: 0,
        pointStyle: "line", // legend swatch reads as a dashed line, matching the on-chart style
        tension: 0,
        fill: false,
      },
    ],
  },
  options: {
    responsive: true,
    maintainAspectRatio: false,
    animation: false,
    plugins: {
      title: {
        display: true,
        text: "gain-curve · javascript · chartjs · anyplot.ai",
        color: t.ink,
        font: { size: 22, weight: "500" },
        padding: { top: 12, bottom: 6 },
      },
      subtitle: {
        display: true,
        text: "Marketing campaign response model — customers ranked by predicted probability",
        color: t.inkSoft,
        font: { size: 14, style: "italic" },
        padding: { bottom: 14 },
      },
      legend: {
        position: "top",
        labels: {
          color: t.ink,
          font: { size: 16 },
          padding: 24,
          usePointStyle: true,
          pointStyleWidth: 40,
        },
      },
    },
    scales: {
      x: {
        type: "linear",
        min: 0,
        max: 100,
        title: {
          display: true,
          text: "Population Targeted (%)",
          color: t.ink,
          font: { size: 16, weight: "500" },
          padding: { top: 8 },
        },
        ticks: {
          color: t.inkSoft,
          font: { size: 14 },
          stepSize: 20,
          callback: (val) => val + "%",
        },
        grid: { display: false },
      },
      y: {
        type: "linear",
        min: 0,
        max: 100,
        title: {
          display: true,
          text: "Positive Cases Captured (%)",
          color: t.ink,
          font: { size: 16, weight: "500" },
          padding: { bottom: 8 },
        },
        ticks: {
          color: t.inkSoft,
          font: { size: 14 },
          stepSize: 20,
          callback: (val) => val + "%",
        },
        grid: { color: t.grid },
      },
    },
  },
});
Runnable source as JSON, for any HTTP client: https://api.anyplot.ai/specs/gain-curve/chartjs/code. Any spec id and library id listed in llms-full.txt fit the same URL shape; every URL below is complete and callable.
{
  "spec_id": "gain-curve",
  "language": "javascript",
  "library": "chartjs",
  "page": "https://anyplot.ai/gain-curve/javascript/chartjs",
  "hub": "https://anyplot.ai/gain-curve",
  "code_json": "https://api.anyplot.ai/specs/gain-curve/chartjs/code",
  "spec_json": "https://api.anyplot.ai/specs/gain-curve",
  "render_light_png": "https://storage.googleapis.com/anyplot-images/plots/gain-curve/javascript/chartjs/plot-light.png",
  "render_dark_png": "https://storage.googleapis.com/anyplot-images/plots/gain-curve/javascript/chartjs/plot-dark.png",
  "interactive_light_html": "https://storage.googleapis.com/anyplot-images/plots/gain-curve/javascript/chartjs/plot-light.html",
  "interactive_dark_html": "https://storage.googleapis.com/anyplot-images/plots/gain-curve/javascript/chartjs/plot-dark.html",
  "quality_score": 90.0,
  "license": "MIT",
  "guide": "https://anyplot.ai/llms.txt"
}
Part of Cumulative Gains Chart on anyplot.ai.