The same plot in 14 other libraries — JavaScript: Chart.js, D3.js, Apache ECharts, Highcharts; Python: Altair, Bokeh, lets-plot, Matplotlib, Plotly, plotnine, Pygal, Seaborn; R: ggplot2; Julia: Makie.jl. Compare all 15 side by side: Cumulative Gains Chart in Python, R, Julia and JavaScript.
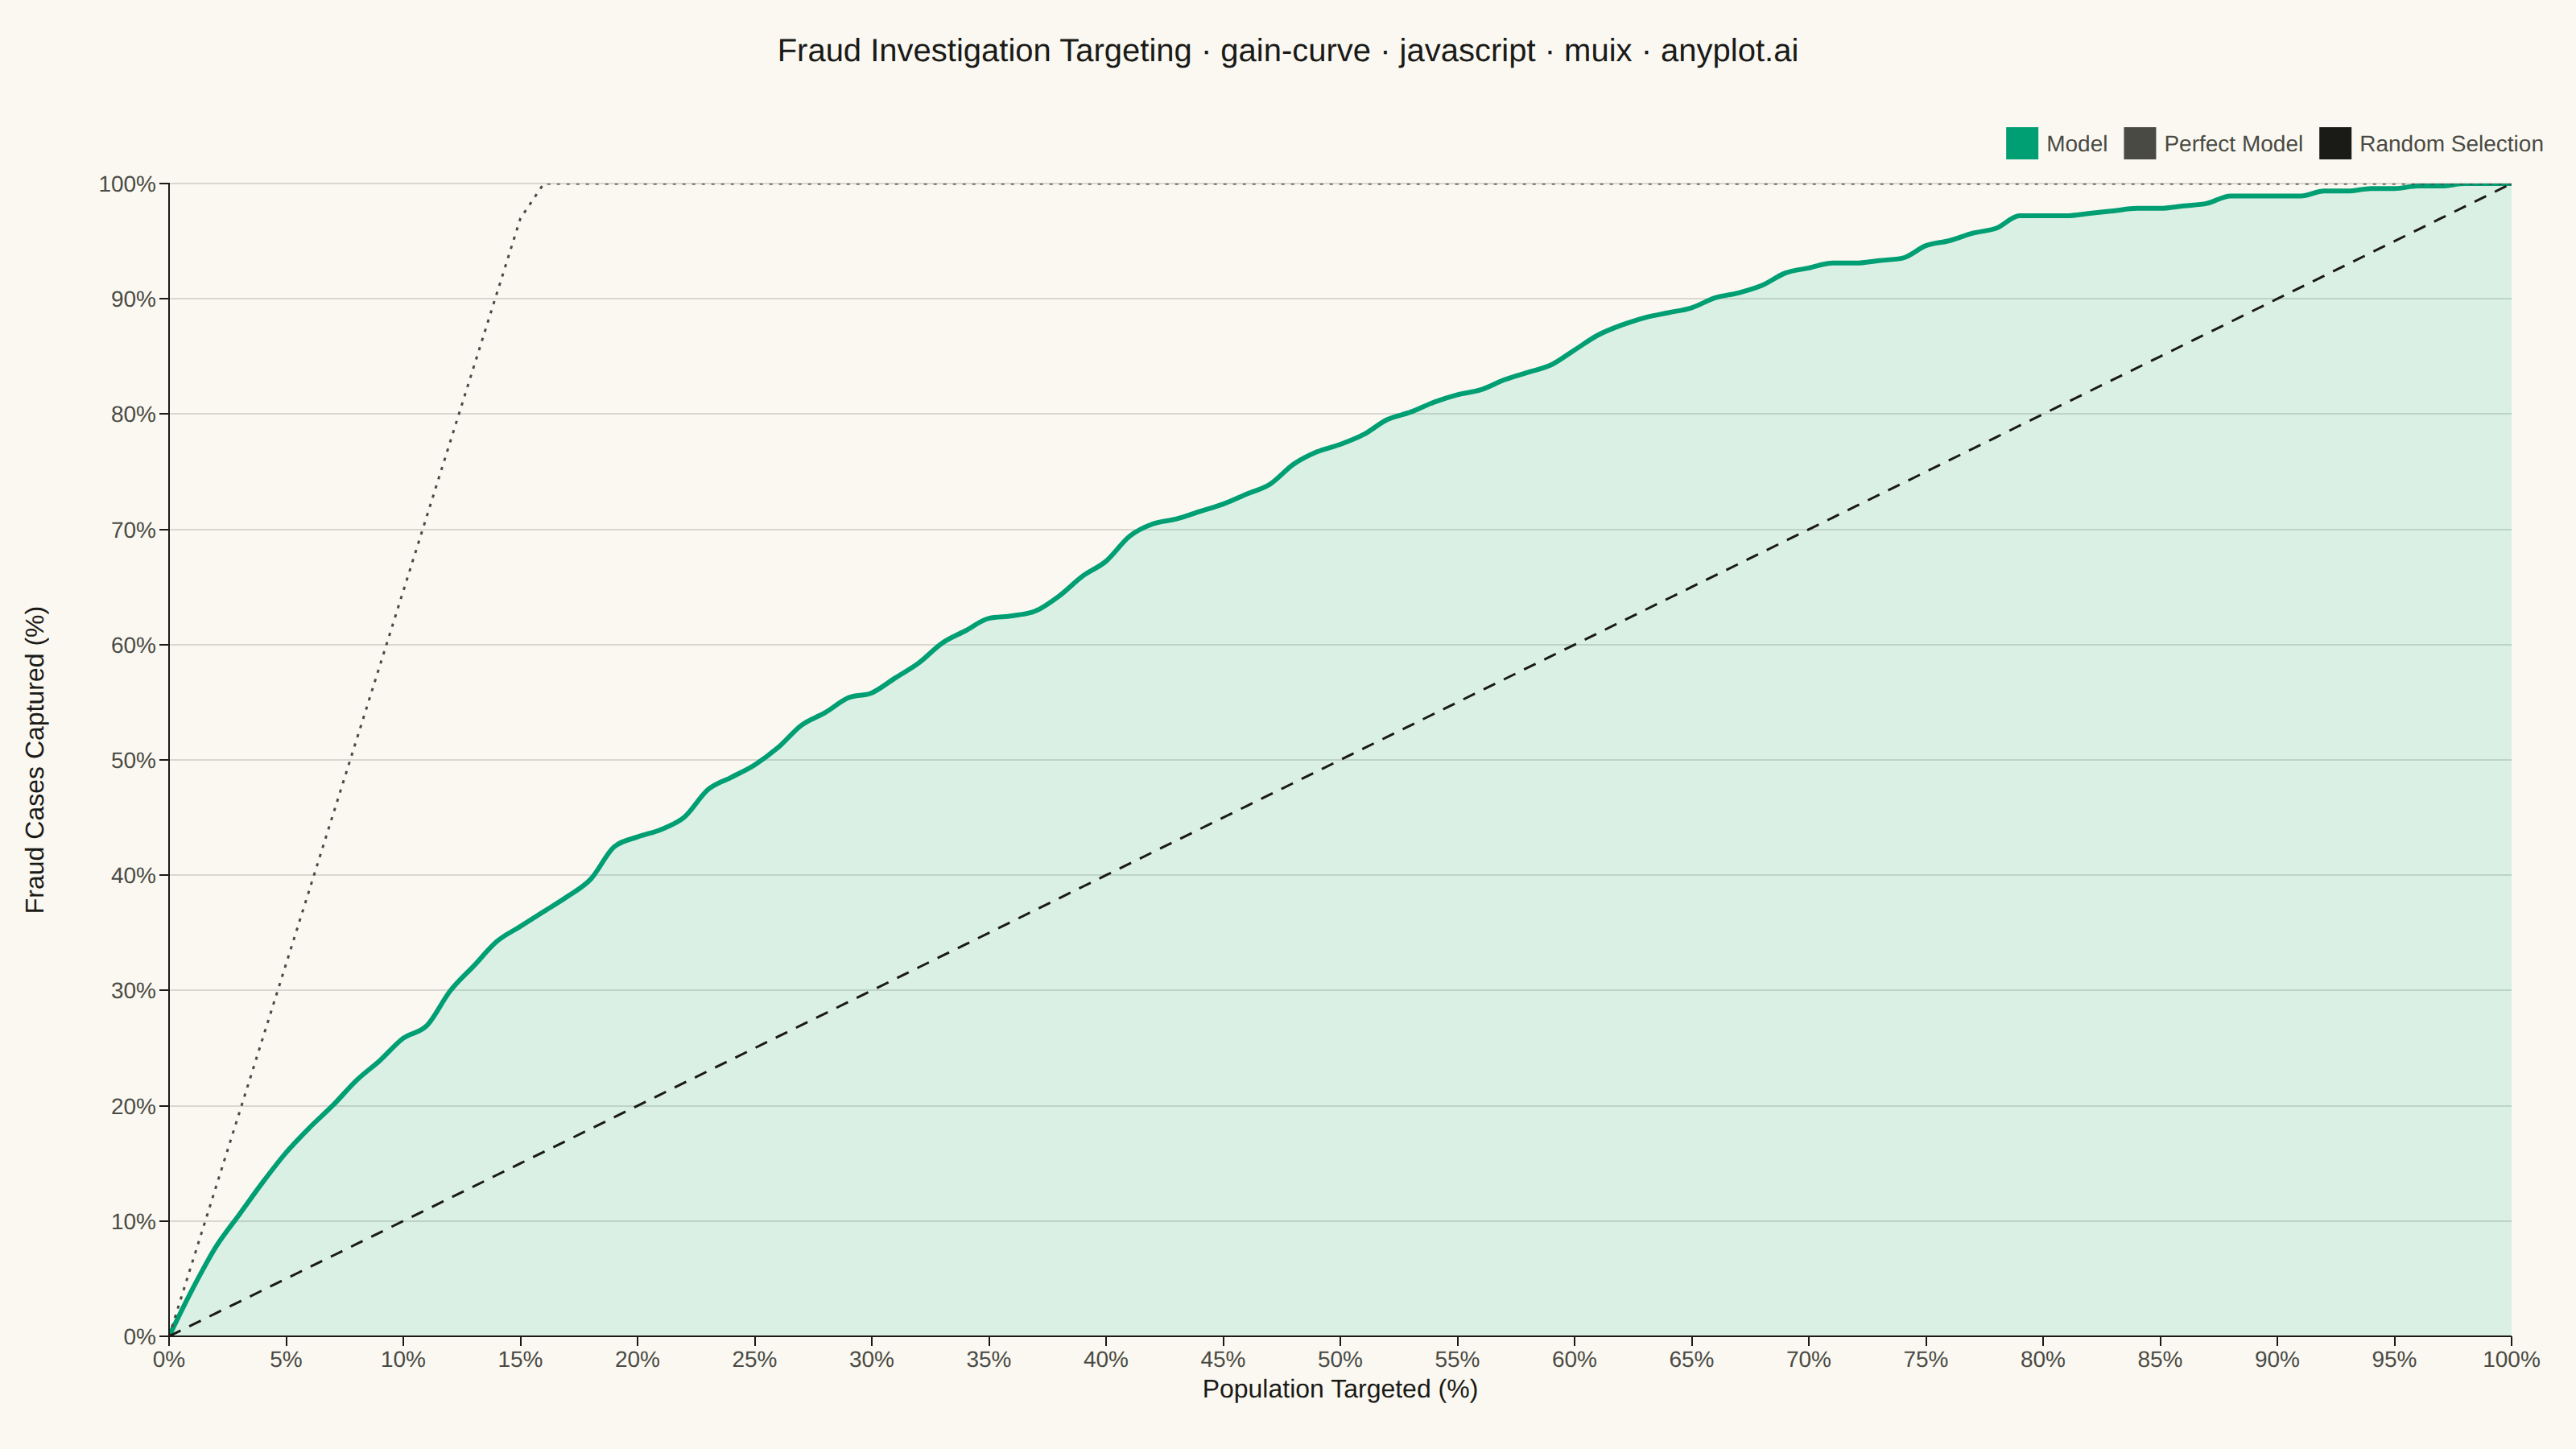
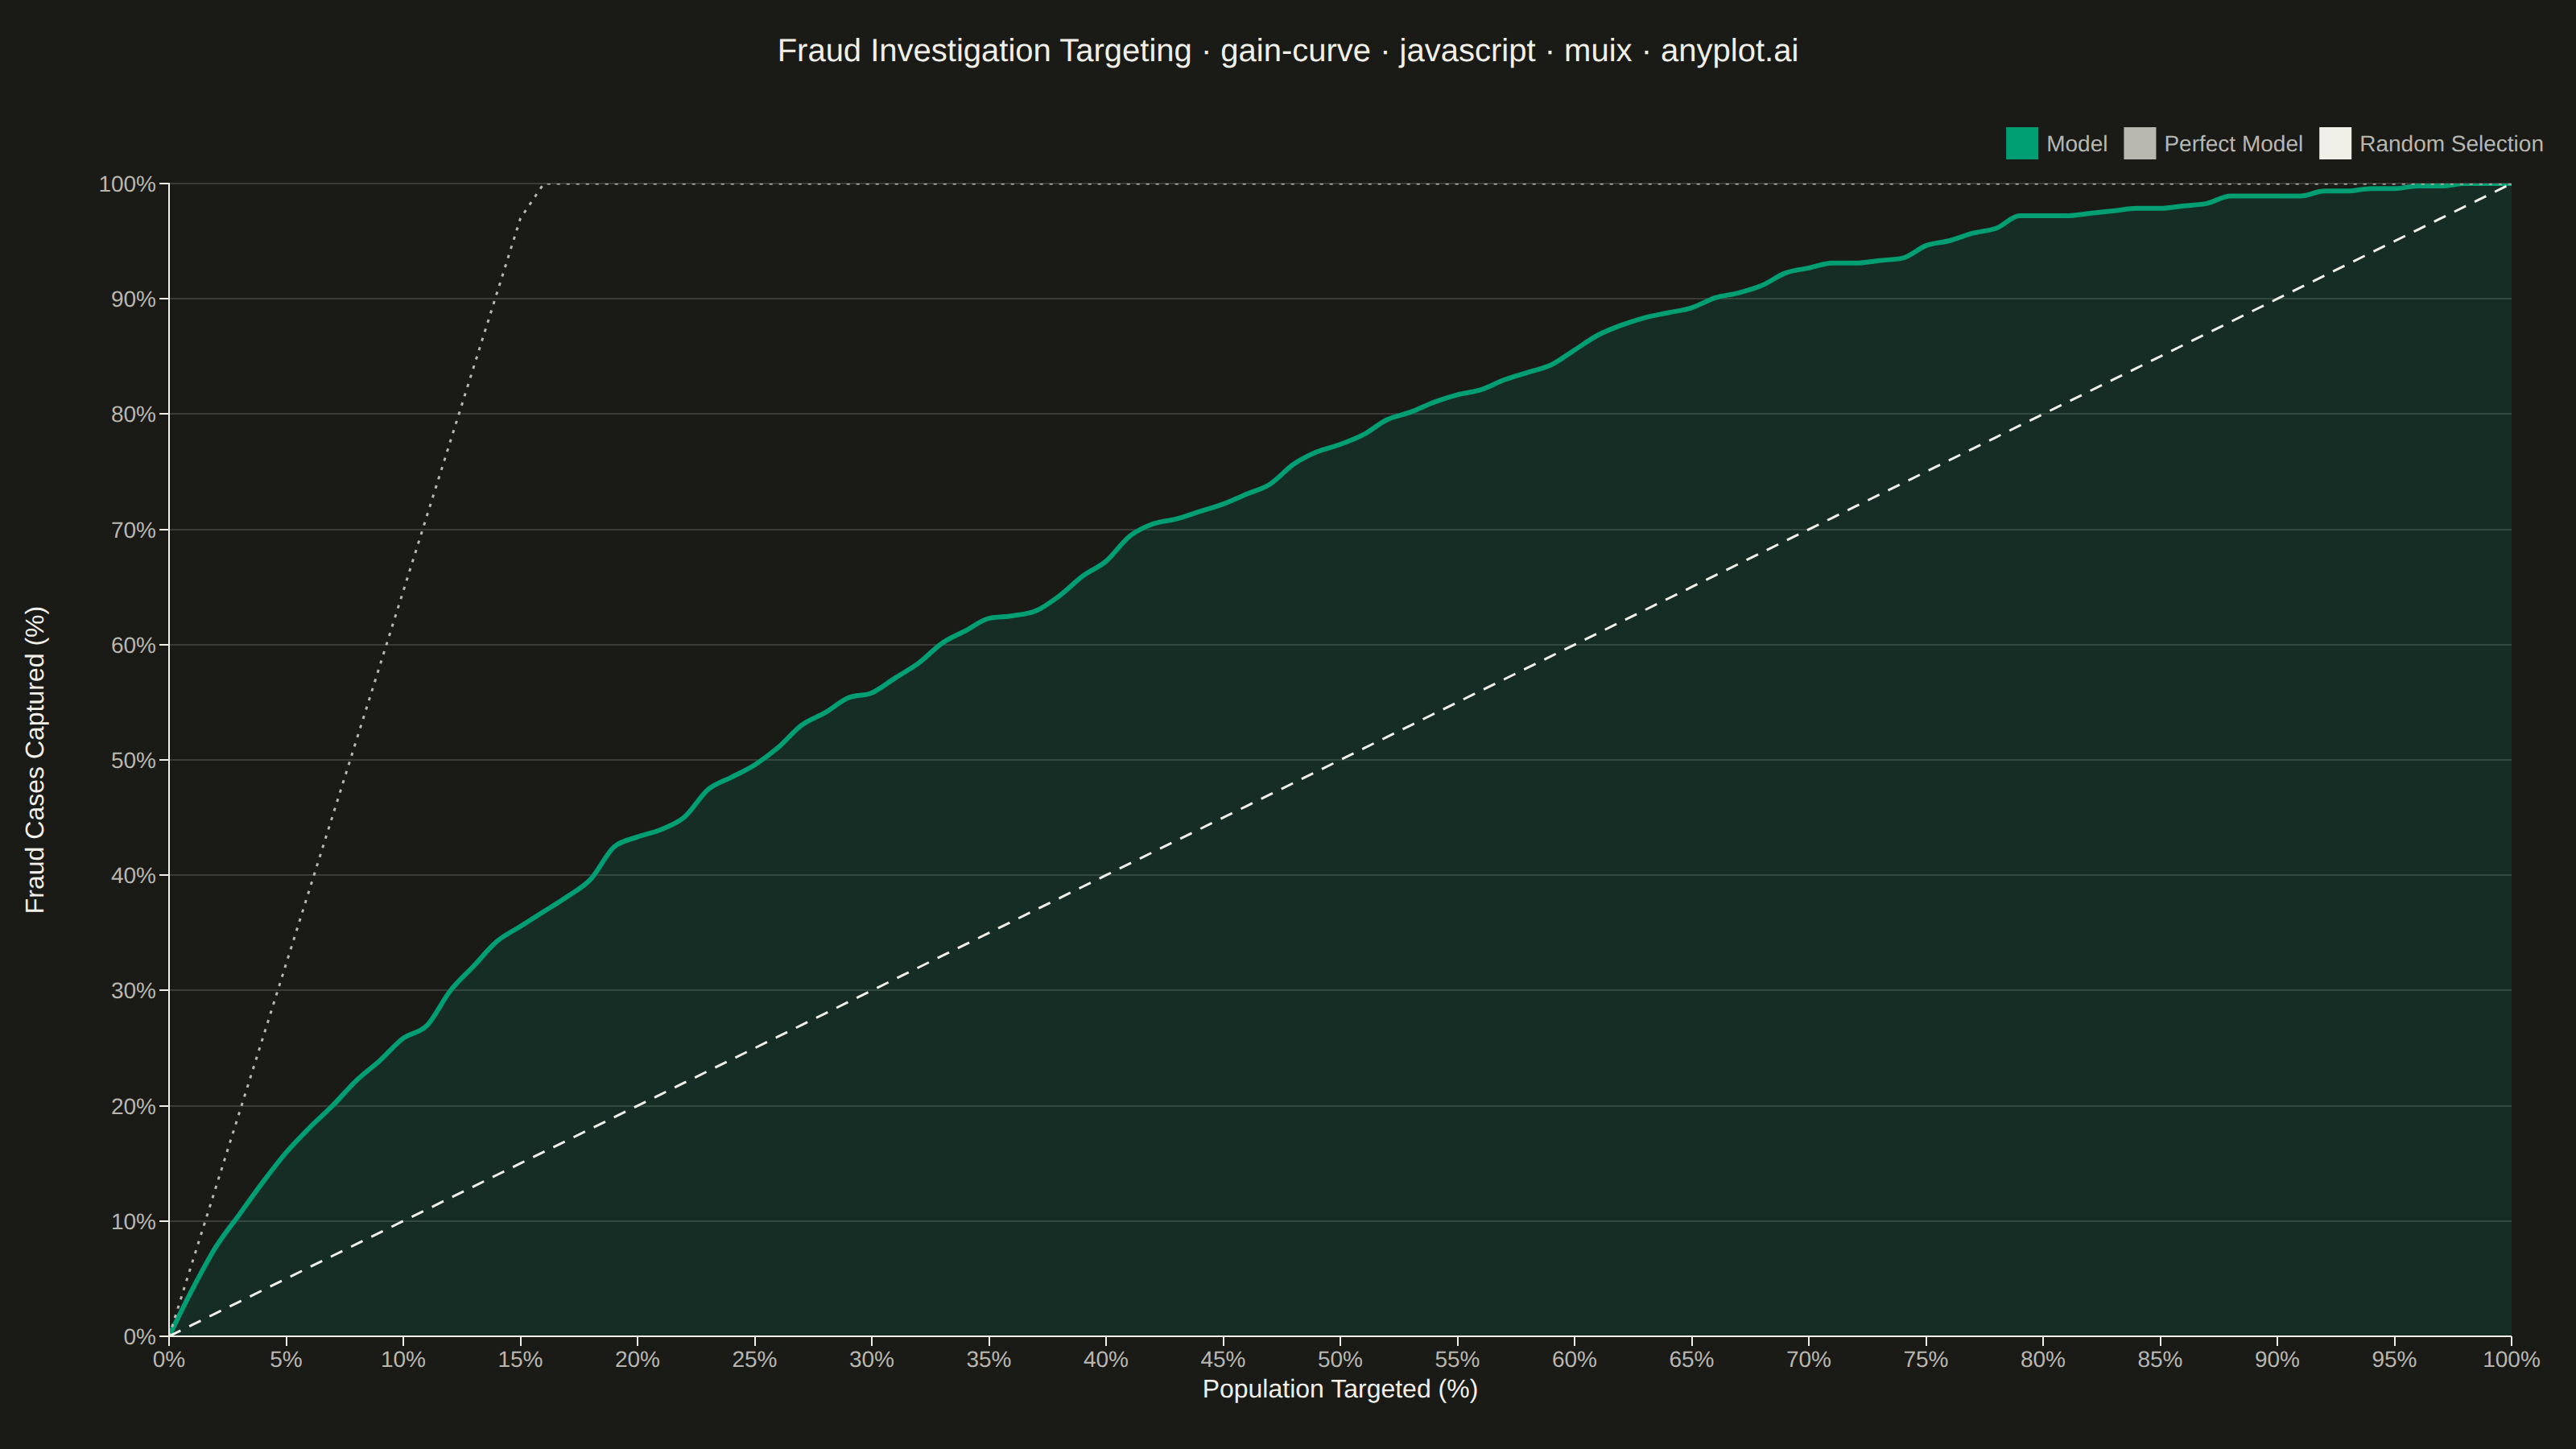
A cumulative gains chart visualizes the effectiveness of a classification model by showing what percentage of positive cases is captured when targeting increasing percentages of the population, ranked by predicted probability. It answers the question: "If I target the top X% of my predictions, what percentage of all actual positives will I capture?" This plot is essential for evaluating targeting strategies in marketing, risk assessment, and resource allocation scenarios.
// anyplot.ai
// gain-curve: Cumulative Gains Chart
// Library: muix 7.29.1 | JavaScript 22.23.2
// Quality: 90/100 | Created: 2026-09-05
//# anyplot-orientation: landscape
// anyplot.ai
// gain-curve: Cumulative Gains Chart
// Library: MUI X Charts | React | Node 22
// License: @mui/x-charts — MIT (community). Pro/Premium are out of scope.
// Quality: pending | Created: 2026-09-05

import { LineChart } from "@mui/x-charts/LineChart";
import Box from "@mui/material/Box";
import Typography from "@mui/material/Typography";

const t = window.ANYPLOT_TOKENS;

// --- Data: fraud-investigation scoring model (in-memory, deterministic) -----
// LCG PRNG — the browser has no seeded RNG.
let seed = 42;
function nextRandom() {
  seed = (1664525 * seed + 1013904223) % 4294967296;
  return seed / 4294967296;
}
function nextGaussian() {
  const u1 = Math.max(nextRandom(), 1e-12);
  const u2 = nextRandom();
  return Math.sqrt(-2 * Math.log(u1)) * Math.cos(2 * Math.PI * u2);
}
function sigmoid(x) {
  return 1 / (1 + Math.exp(-x));
}

const TRANSACTIONS = 3000;
const yTrue = [];
const yScore = [];
for (let i = 0; i < TRANSACTIONS; i++) {
  const risk = nextGaussian();
  const fraudProbability = sigmoid(1.4 * risk - 2.3); // ~9% base fraud rate
  yTrue.push(nextRandom() < fraudProbability ? 1 : 0);
  yScore.push(risk + nextGaussian() * 0.9); // model score: imperfect proxy for true risk
}

// Rank by predicted score (descending) and accumulate captured fraud cases.
const order = yTrue.map((_, i) => i).sort((a, b) => yScore[b] - yScore[a]);
const totalFraud = yTrue.reduce((sum, v) => sum + v, 0);
const fraudRate = totalFraud / TRANSACTIONS;

const cumulativeGainAt = new Array(TRANSACTIONS);
let cumulativeFraud = 0;
for (let i = 0; i < TRANSACTIONS; i++) {
  cumulativeFraud += yTrue[order[i]];
  cumulativeGainAt[i] = (cumulativeFraud / totalFraud) * 100;
}

// Sample at every integer percent of population targeted.
const PERCENTAGES = Array.from({ length: 101 }, (_, i) => i);
const modelGain = PERCENTAGES.map((pct) => {
  if (pct === 0) return 0;
  const idx = Math.min(Math.round((pct / 100) * TRANSACTIONS), TRANSACTIONS) - 1;
  return cumulativeGainAt[idx];
});
const randomGain = PERCENTAGES.map((pct) => pct);
const perfectCapPct = fraudRate * 100;
const perfectGain = PERCENTAGES.map((pct) => (pct <= perfectCapPct ? pct / fraudRate : 100));

// --- Chart -------------------------------------------------------------------
const TITLE = "Fraud Investigation Targeting · gain-curve · javascript · muix · anyplot.ai";
const TITLE_FONT_SIZE = Math.round(22 * Math.min(1, 67 / TITLE.length));
const TITLE_HEIGHT = 64;

export default function Chart() {
  const chartWidth = window.ANYPLOT_SIZE.width;
  const chartHeight = window.ANYPLOT_SIZE.height - TITLE_HEIGHT;

  return (
    <Box sx={{ width: chartWidth, height: window.ANYPLOT_SIZE.height, display: "flex", flexDirection: "column" }}>
      <Box sx={{ height: TITLE_HEIGHT, display: "flex", alignItems: "center", justifyContent: "center", flexShrink: 0 }}>
        <Typography sx={{ color: t.ink, fontSize: TITLE_FONT_SIZE, fontWeight: 500 }}>{TITLE}</Typography>
      </Box>
      <LineChart
        skipAnimation
        width={chartWidth}
        height={chartHeight}
        margin={{ top: 50, right: 40, bottom: 70, left: 105 }}
        grid={{ horizontal: true }}
        xAxis={[
          {
            data: PERCENTAGES,
            scaleType: "linear",
            min: 0,
            max: 100,
            label: "Population Targeted (%)",
            labelStyle: { fontSize: 16, fill: t.ink },
            tickLabelStyle: { fontSize: 14, fill: t.inkSoft },
            valueFormatter: (v) => `${v}%`,
          },
        ]}
        yAxis={[
          {
            min: 0,
            max: 100,
            label: "Fraud Cases Captured (%)",
            labelStyle: { fontSize: 16, fill: t.ink },
            tickLabelStyle: { fontSize: 14, fill: t.inkSoft },
            valueFormatter: (v) => `${v}%`,
          },
        ]}
        // Push the rotated y-axis title clear of the "100%"-wide tick labels —
        // MUI X's default label offset assumes narrower numeric ticks. Set via
        // `leftAxis` (not the yAxis config) so only the left axis is affected.
        leftAxis={{ slotProps: { axisLabel: { x: -78 } } }}
        series={[
          {
            id: "model",
            data: modelGain,
            label: "Model",
            color: t.palette[0],
            curve: "monotoneX",
            area: true,
            showMark: false,
          },
          {
            id: "perfect",
            data: perfectGain,
            label: "Perfect Model",
            color: t.inkSoft,
            curve: "linear",
            showMark: false,
          },
          {
            id: "random",
            data: randomGain,
            label: "Random Selection",
            color: t.ink,
            curve: "linear",
            showMark: false,
          },
        ]}
        slotProps={{
          legend: {
            direction: "row",
            position: { vertical: "top", horizontal: "right" },
            labelStyle: { fontSize: 14, fill: t.inkSoft },
          },
        }}
        sx={{
          "& .MuiChartsAxis-line, & .MuiChartsAxis-tick": { stroke: t.inkSoft },
          "& .MuiChartsGrid-line": { stroke: t.grid },
          "& .MuiLineElement-series-model": { strokeWidth: 3 },
          "& .MuiLineElement-series-perfect": { strokeWidth: 1.5, strokeDasharray: "2 4" },
          "& .MuiLineElement-series-random": { strokeWidth: 1.5, strokeDasharray: "8 6" },
          "& .MuiAreaElement-series-model": { fillOpacity: 0.12 },
        }}
      />
    </Box>
  );
}
Runnable source as JSON, for any HTTP client: https://api.anyplot.ai/specs/gain-curve/muix/code. Any spec id and library id listed in llms-full.txt fit the same URL shape; every URL below is complete and callable.
{
  "spec_id": "gain-curve",
  "language": "javascript",
  "library": "muix",
  "page": "https://anyplot.ai/gain-curve/javascript/muix",
  "hub": "https://anyplot.ai/gain-curve",
  "code_json": "https://api.anyplot.ai/specs/gain-curve/muix/code",
  "spec_json": "https://api.anyplot.ai/specs/gain-curve",
  "render_light_png": "https://storage.googleapis.com/anyplot-images/plots/gain-curve/javascript/muix/plot-light.png",
  "render_dark_png": "https://storage.googleapis.com/anyplot-images/plots/gain-curve/javascript/muix/plot-dark.png",
  "interactive_light_html": "https://storage.googleapis.com/anyplot-images/plots/gain-curve/javascript/muix/plot-light.html",
  "interactive_dark_html": "https://storage.googleapis.com/anyplot-images/plots/gain-curve/javascript/muix/plot-dark.html",
  "quality_score": 90.0,
  "license": "MIT",
  "guide": "https://anyplot.ai/llms.txt"
}
Part of Cumulative Gains Chart on anyplot.ai.