The same plot in 14 other libraries — Python: Altair, Bokeh, lets-plot, Matplotlib, Plotly, plotnine, Pygal, Seaborn; R: ggplot2; JavaScript: Chart.js, D3.js, Apache ECharts, Highcharts, MUI X Charts. Compare all 15 side by side: Cumulative Gains Chart in Python, R, Julia and JavaScript.
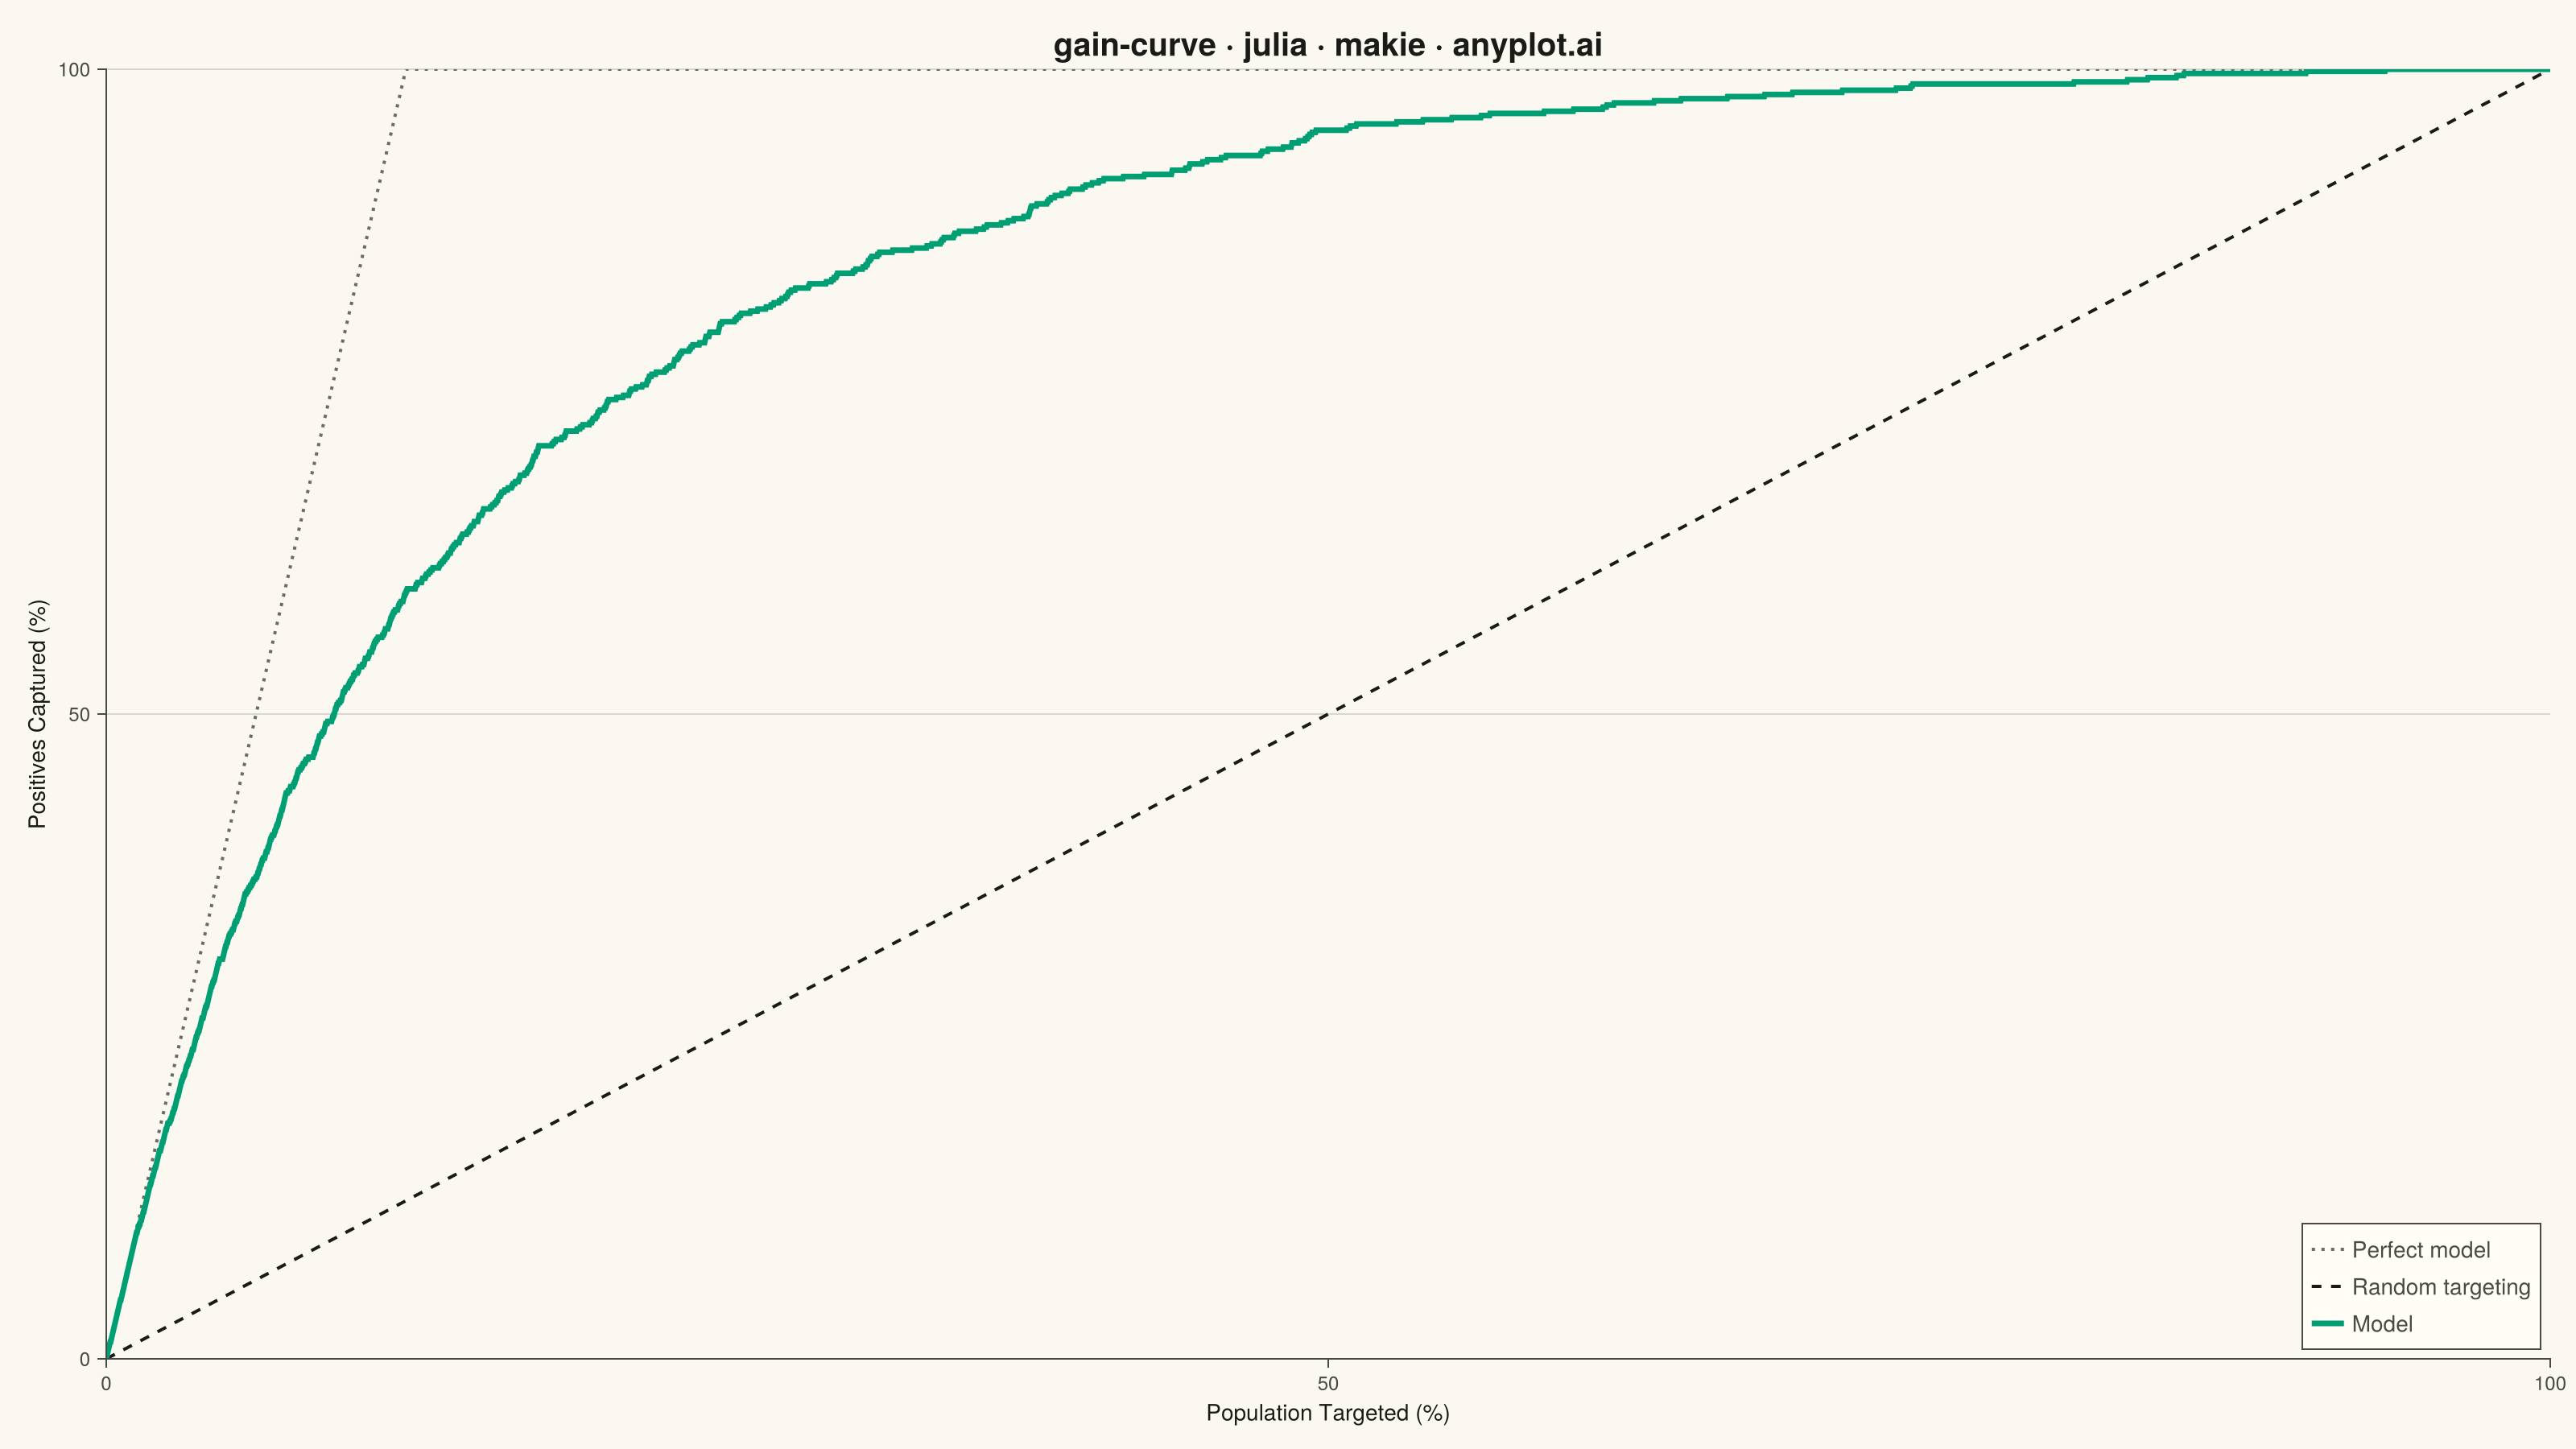
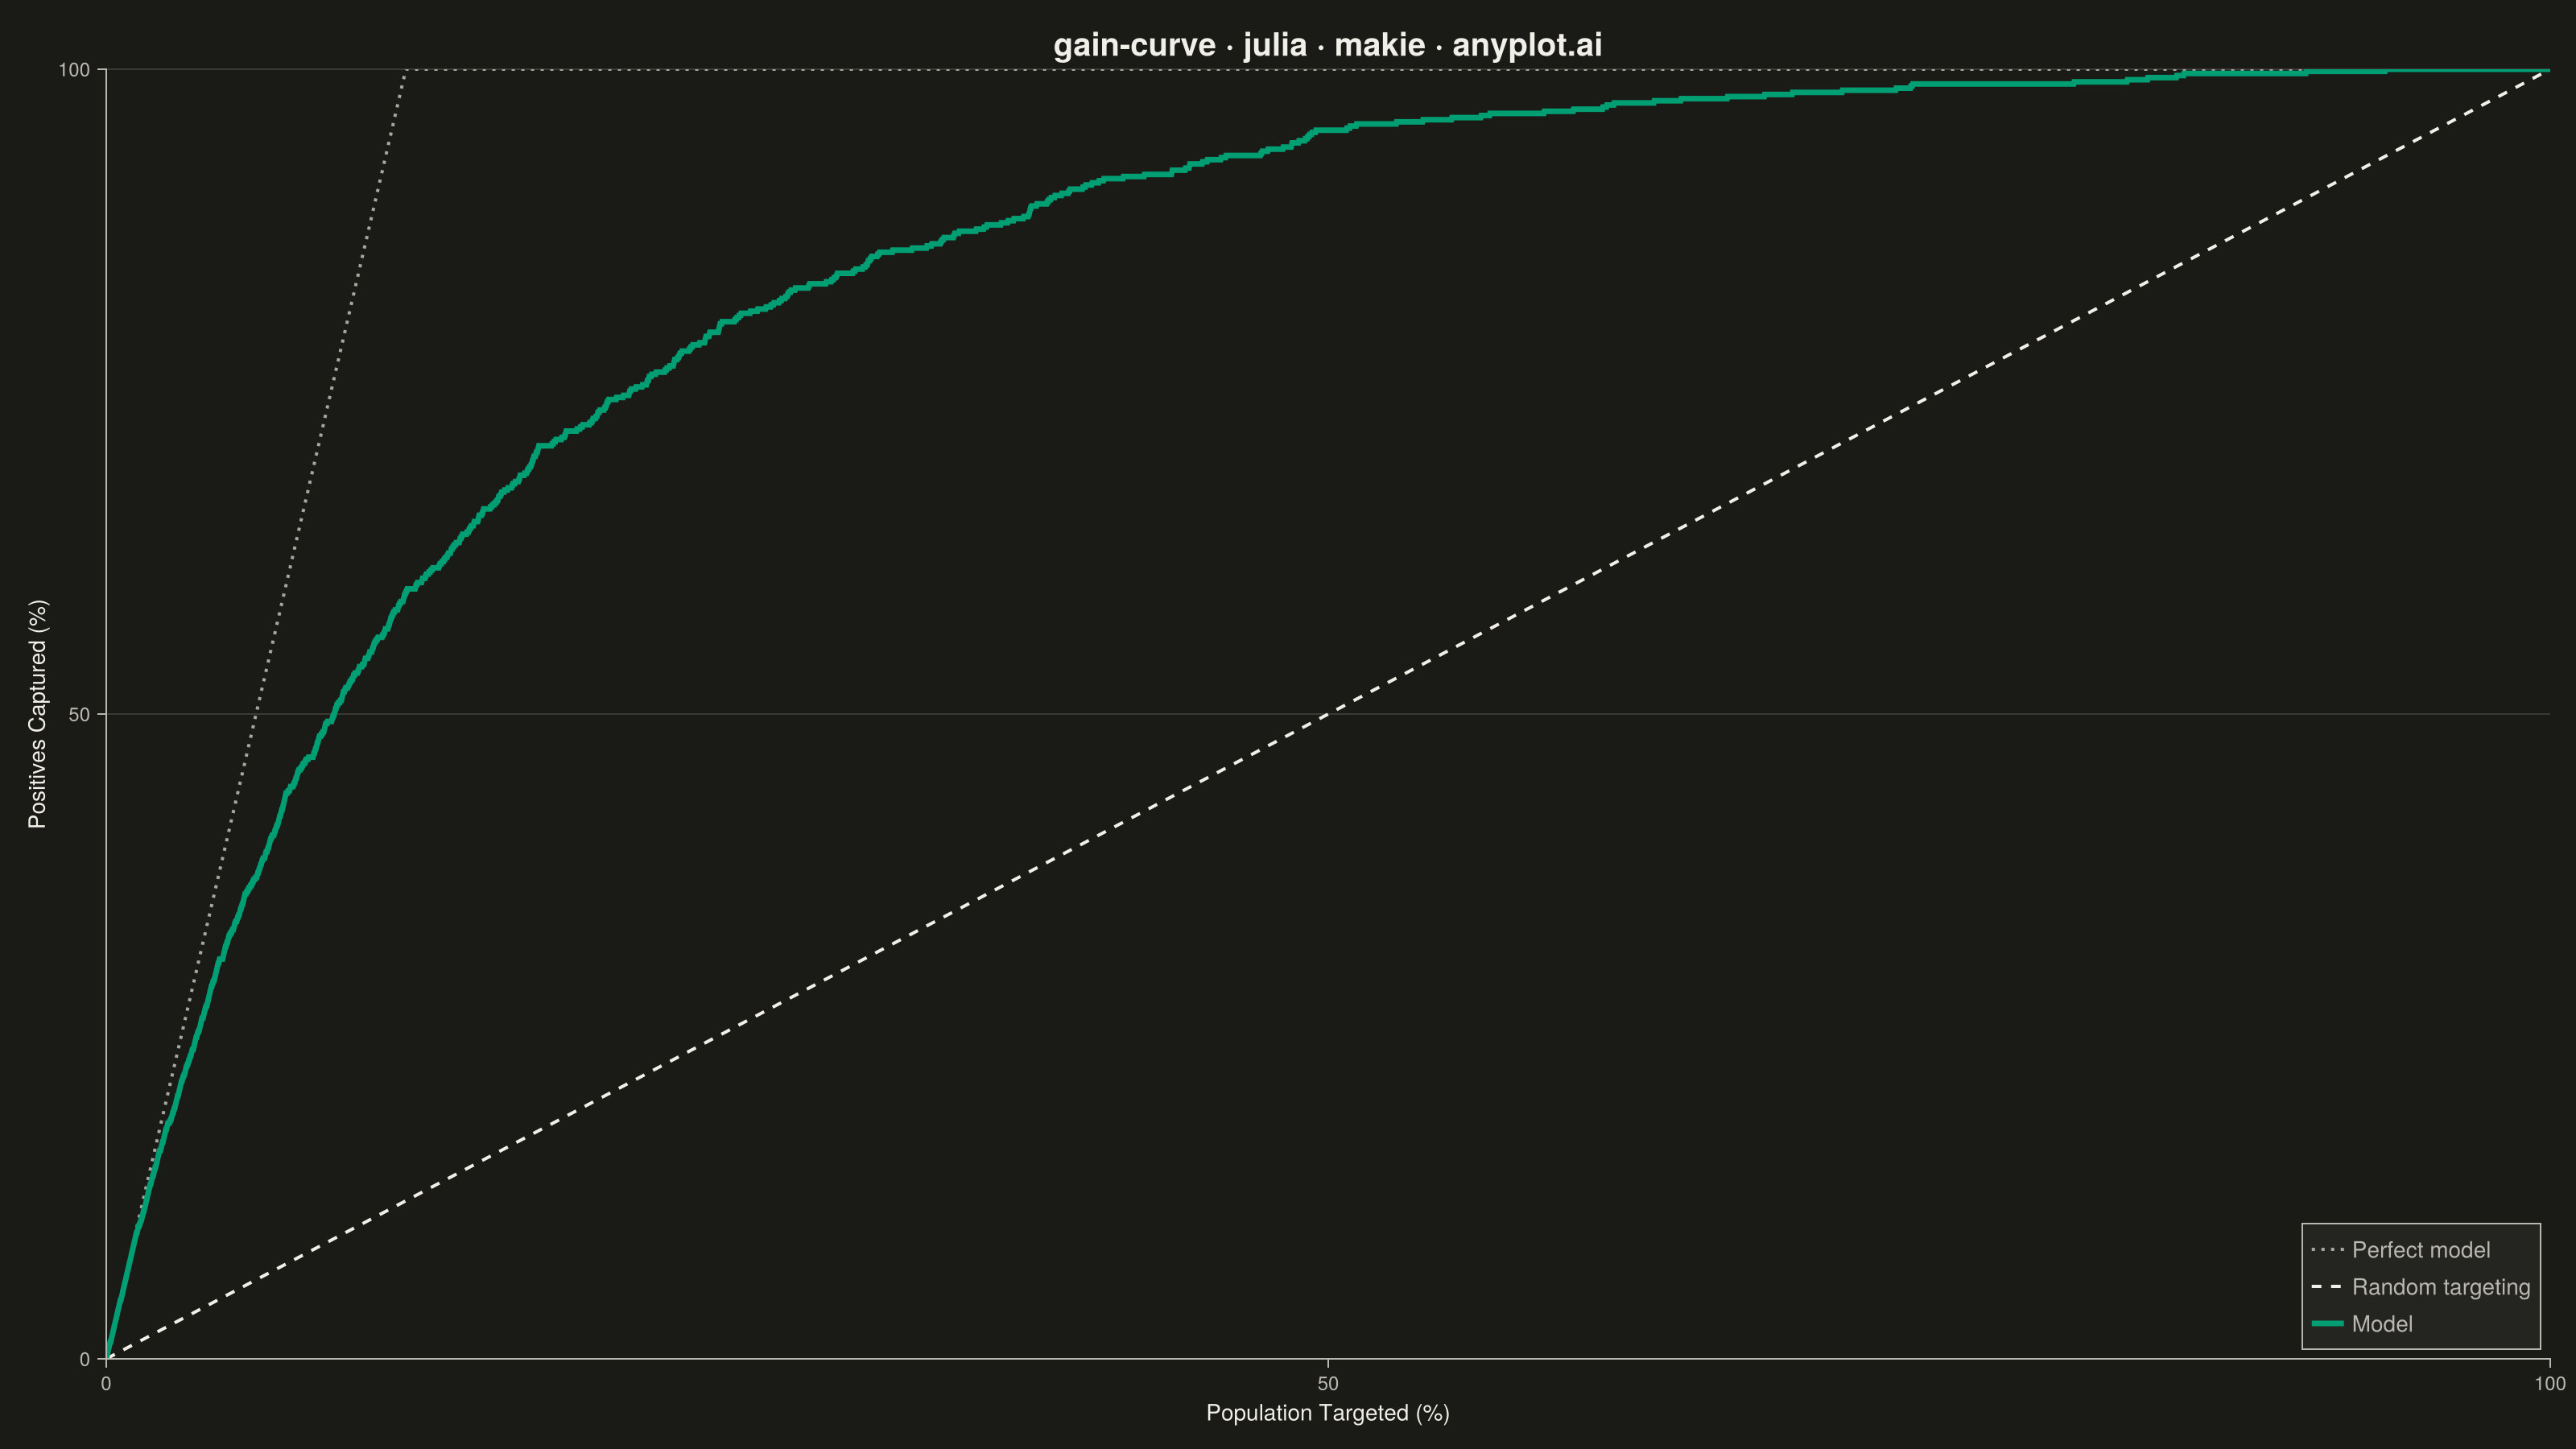
A cumulative gains chart visualizes the effectiveness of a classification model by showing what percentage of positive cases is captured when targeting increasing percentages of the population, ranked by predicted probability. It answers the question: "If I target the top X% of my predictions, what percentage of all actual positives will I capture?" This plot is essential for evaluating targeting strategies in marketing, risk assessment, and resource allocation scenarios.
# anyplot.ai
# gain-curve: Cumulative Gains Chart
# Library: makie 0.21.9 | Julia 1.11.9
# Quality: 93/100 | Created: 2026-09-05

using CairoMakie
using Colors
using Random

Random.seed!(42)

# --- Theme tokens -------------------------------------------------------
THEME    = get(ENV, "ANYPLOT_THEME", "light")
PAGE_BG  = THEME == "light" ? colorant"#FAF8F1" : colorant"#1A1A17"
INK      = THEME == "light" ? colorant"#1A1A17" : colorant"#F0EFE8"
INK_SOFT = THEME == "light" ? colorant"#4A4A44" : colorant"#B8B7B0"
INK_MUTED = THEME == "light" ? colorant"#6B6A63" : colorant"#A8A79F"
ELEVATED_BG = THEME == "light" ? colorant"#FFFDF6" : colorant"#242420"
BRAND    = colorant"#009E73"  # Imprint palette position 1 — model curve

# --- Data: credit scoring model for loan default detection ---------------
n_applicants = 5000
default_rate = 0.12
y_true = rand(n_applicants) .< default_rate

# Risk score correlates with the true default label but is imperfect,
# mirroring a realistic model (AUC well above random, short of perfect).
latent = ifelse.(y_true, randn(n_applicants) .+ 1.8, randn(n_applicants))
y_score = 1 ./ (1 .+ exp.(-latent))

order = sortperm(y_score; rev = true)
y_true_sorted = y_true[order]

total_positives = sum(y_true_sorted)
pct_population = vcat(0.0, (1:n_applicants) ./ n_applicants .* 100)
pct_captured = vcat(0.0, cumsum(y_true_sorted) ./ total_positives .* 100)

positive_rate_pct = total_positives / n_applicants * 100
perfect_x = [0.0, positive_rate_pct, 100.0]
perfect_y = [0.0, 100.0, 100.0]

# --- Plot -----------------------------------------------------------------
fig = Figure(
    resolution = (1600, 900),
    fontsize = 14,
    backgroundcolor = PAGE_BG,
)

ax = Axis(
    fig[1, 1];
    title = "gain-curve · julia · makie · anyplot.ai",
    titlesize = 20,
    titlecolor = INK,
    xlabel = "Population Targeted (%)",
    ylabel = "Positives Captured (%)",
    xlabelsize = 14,
    ylabelsize = 14,
    xlabelcolor = INK,
    ylabelcolor = INK,
    xticklabelsize = 12,
    yticklabelsize = 12,
    xticklabelcolor = INK_SOFT,
    yticklabelcolor = INK_SOFT,
    xtickcolor = INK_SOFT,
    ytickcolor = INK_SOFT,
    backgroundcolor = PAGE_BG,
    topspinevisible = false,
    rightspinevisible = false,
    leftspinecolor = INK_SOFT,
    bottomspinecolor = INK_SOFT,
    xgridvisible = false,
    ygridcolor = RGBAf(INK.r, INK.g, INK.b, 0.15),
    yminorgridvisible = false,
    limits = (0, 100, 0, 100),
)

lines!(ax, perfect_x, perfect_y;
    color = INK_MUTED, linewidth = 2, linestyle = :dot, label = "Perfect model")
lines!(ax, [0, 100], [0, 100];
    color = INK, linewidth = 2, linestyle = :dash, label = "Random targeting")
lines!(ax, pct_population, pct_captured;
    color = BRAND, linewidth = 3.5, label = "Model")

axislegend(ax;
    position = :rb,
    labelcolor = INK_SOFT,
    backgroundcolor = ELEVATED_BG,
    framecolor = INK_SOFT,
    framevisible = true,
)

# --- Save -------------------------------------------------------------------
save("plot-$(THEME).png", fig; px_per_unit = 2)
Runnable source as JSON, for any HTTP client: https://api.anyplot.ai/specs/gain-curve/makie/code. Any spec id and library id listed in llms-full.txt fit the same URL shape; every URL below is complete and callable.
{
  "spec_id": "gain-curve",
  "language": "julia",
  "library": "makie",
  "page": "https://anyplot.ai/gain-curve/julia/makie",
  "hub": "https://anyplot.ai/gain-curve",
  "code_json": "https://api.anyplot.ai/specs/gain-curve/makie/code",
  "spec_json": "https://api.anyplot.ai/specs/gain-curve",
  "render_light_png": "https://storage.googleapis.com/anyplot-images/plots/gain-curve/julia/makie/plot-light.png",
  "render_dark_png": "https://storage.googleapis.com/anyplot-images/plots/gain-curve/julia/makie/plot-dark.png",
  "quality_score": 93.0,
  "license": "MIT",
  "guide": "https://anyplot.ai/llms.txt"
}
Part of Cumulative Gains Chart on anyplot.ai.