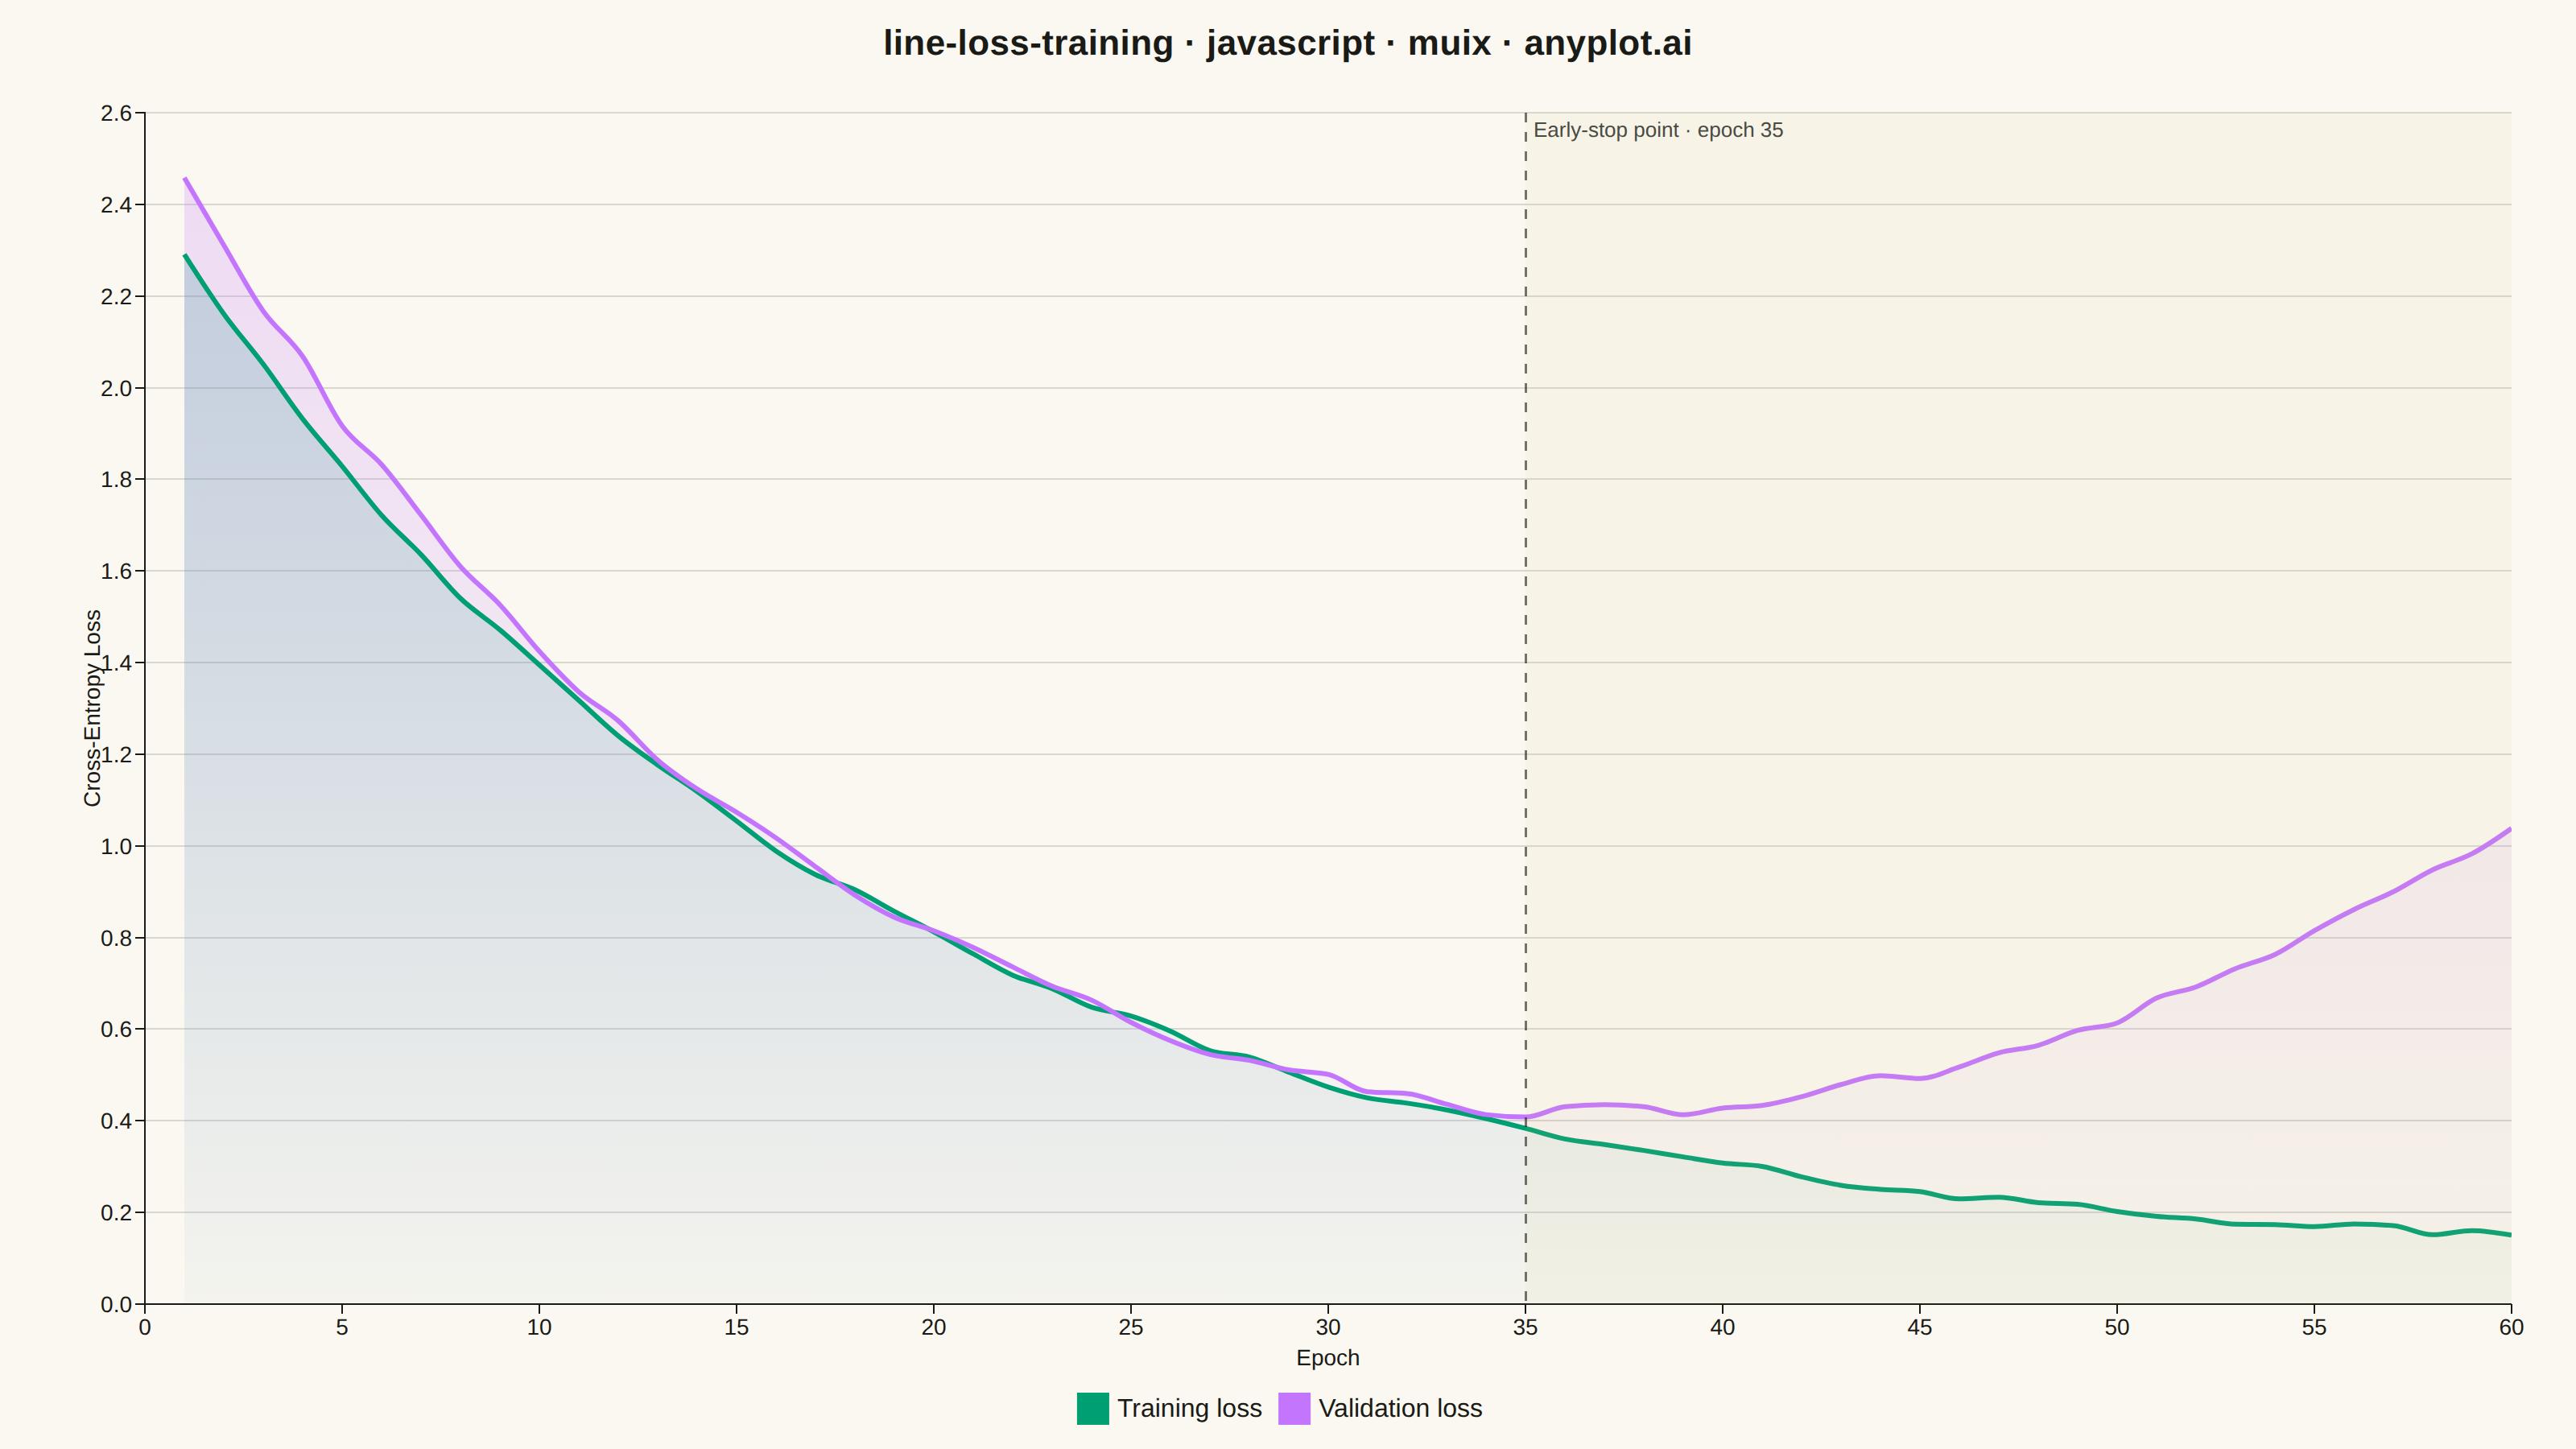
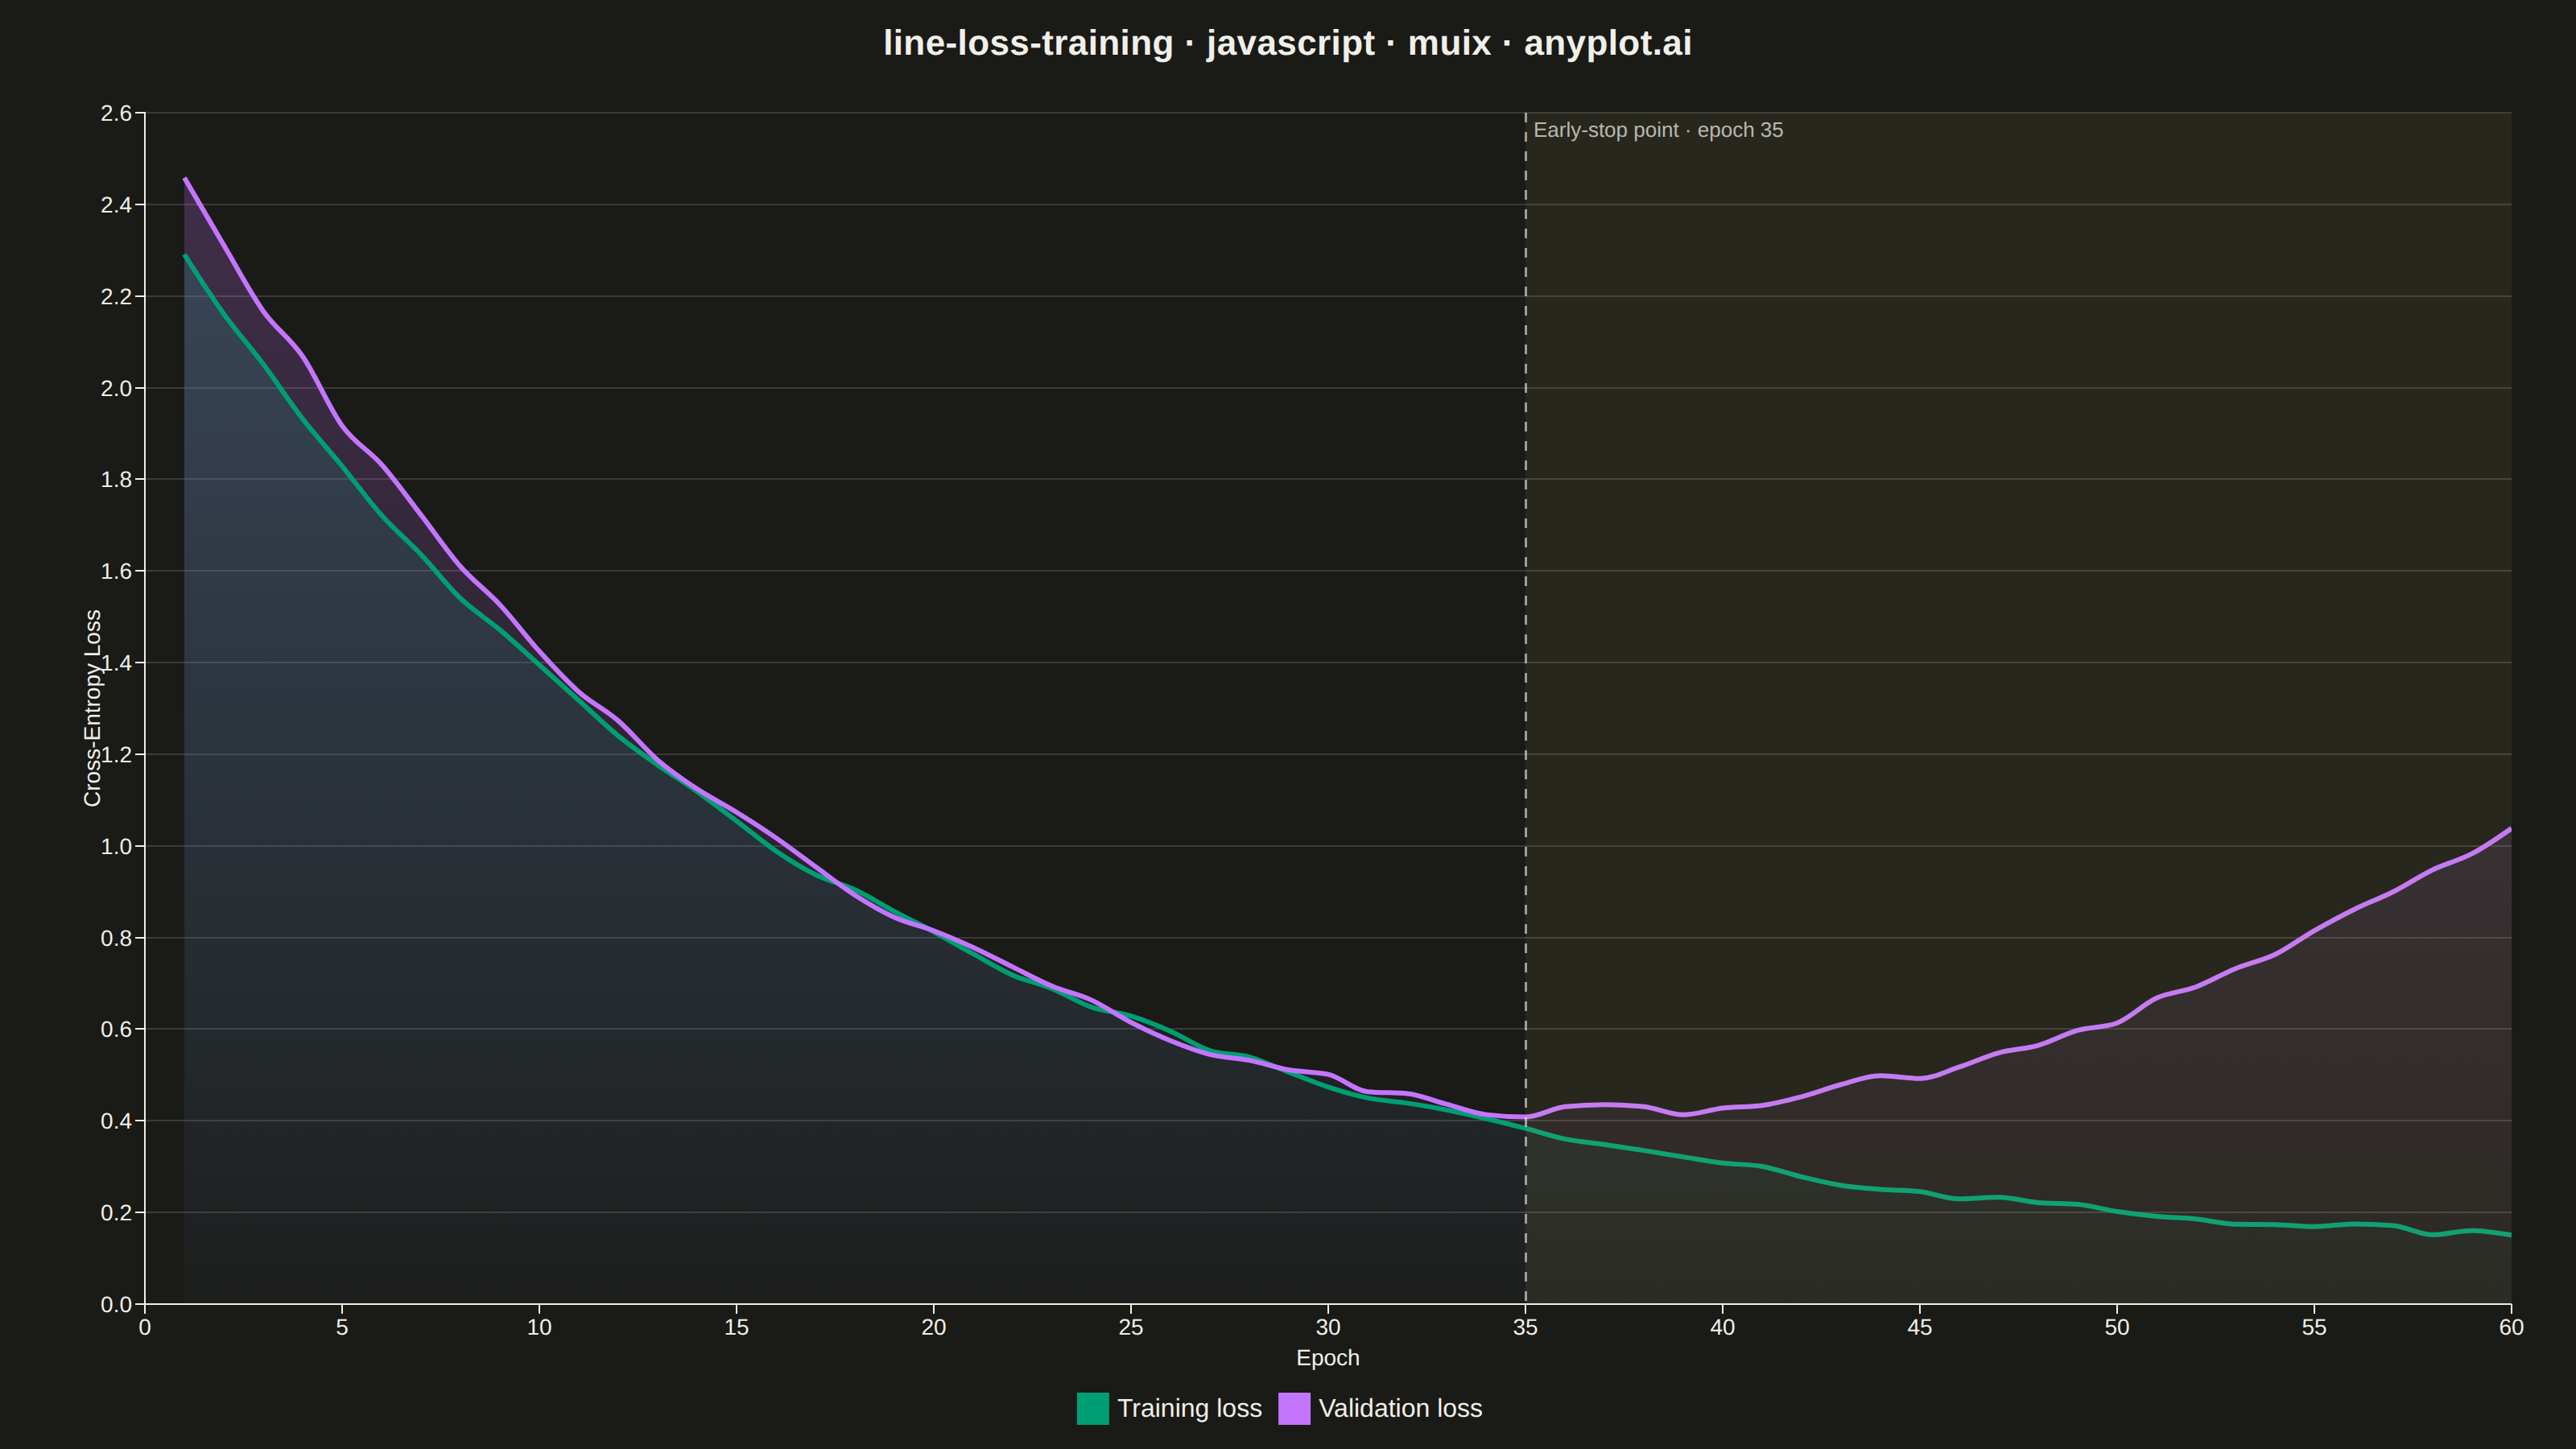
The same plot in 14 other libraries — JavaScript: Chart.js, D3.js, Apache ECharts, Highcharts; Python: Altair, Bokeh, lets-plot, Matplotlib, Plotly, plotnine, Pygal, Seaborn; R: ggplot2; Julia: Makie.jl. Compare all 15 side by side: Training Loss Curve in Python, R, Julia and JavaScript.
A line plot showing training and validation loss curves over epochs during neural network training. This visualization is essential for monitoring model training, detecting overfitting (when validation loss diverges from training loss), and determining optimal early stopping points. The dual-curve display reveals the gap between training and generalization performance.
// anyplot.ai
// line-loss-training: Training Loss Curve
// Library: muix 7.29.1 | JavaScript 22.23.2
// Quality: 97/100 | Created: 2026-09-05

import { LineChart } from "@mui/x-charts/LineChart";
import { ChartsReferenceLine } from "@mui/x-charts/ChartsReferenceLine";
import { useXScale, useDrawingArea } from "@mui/x-charts/hooks";

const t = window.ANYPLOT_TOKENS;
const TRAIN_GRADIENT_ID = "lineLossTrainingTrainFill";
const VAL_GRADIENT_ID = "lineLossTrainingValFill";

// --- Data (in-memory, deterministic LCG for reproducible noise) -------------
function lcg(seed) {
  let state = seed;
  return () => {
    state = (state * 1664525 + 1013904223) % 4294967296;
    return state / 4294967296;
  };
}
const rand = lcg(42);

const EPOCHS = 60;
const epoch = Array.from({ length: EPOCHS }, (_, i) => i + 1);

// Training loss keeps decaying smoothly for the full run.
const trainLoss = epoch.map(
  (e) => 2.35 * Math.exp(-e / 17) + 0.08 + (rand() - 0.5) * 0.02,
);

// Validation loss tracks training loss early on, then diverges upward past
// epoch ~28 — the classic overfitting signature this spec is about.
const valLoss = epoch.map((e) => {
  const overfitPenalty = Math.max(0, e - 28) ** 2 * 0.00085;
  return 2.5 * Math.exp(-e / 15.5) + 0.12 + overfitPenalty + (rand() - 0.5) * 0.035;
});

let bestEpoch = epoch[0];
let bestValLoss = valLoss[0];
valLoss.forEach((v, i) => {
  if (v < bestValLoss) {
    bestValLoss = v;
    bestEpoch = epoch[i];
  }
});

// Highlights the post-early-stop overfitting window (bestEpoch → last epoch)
// as a soft background band. MUI X community has no band-annotation
// primitive, so this reads the shared x-scale/drawing-area straight out of
// the chart's own render context — the documented composition pattern for
// marks outside the community surface.
function DivergenceZone() {
  const xScale = useXScale() as any;
  const drawingArea = useDrawingArea();
  if (!xScale) return null;
  const xStart = xScale(bestEpoch);
  const xEnd = xScale(EPOCHS);
  return (
    <rect
      x={xStart}
      y={drawingArea.top}
      width={Math.max(0, xEnd - xStart)}
      height={drawingArea.height}
      fill={t.amber}
      fillOpacity={0.08}
    />
  );
}

// --- Chart (default-exported component — the harness mounts it) -------------
export default function Chart() {
  return (
    <div style={{ width: "100%", height: "100%", position: "relative" }}>
      {/* Title rendered in the chart's top margin space */}
      <div
        style={{
          position: "absolute",
          top: 14,
          left: 0,
          right: 0,
          textAlign: "center",
          zIndex: 1,
          fontSize: 22,
          fontWeight: 600,
          letterSpacing: "0.2px",
          color: t.ink,
          pointerEvents: "none",
          fontFamily: "'Roboto', 'Helvetica', 'Arial', sans-serif",
        }}
      >
        line-loss-training · javascript · muix · anyplot.ai
      </div>

      <LineChart
        width={window.ANYPLOT_SIZE.width}
        height={window.ANYPLOT_SIZE.height}
        skipAnimation
        series={[
          {
            id: "train",
            data: trainLoss,
            label: "Training loss",
            color: t.palette[0],
            showMark: false,
            curve: "monotoneX",
            area: true,
            baseline: 0,
          },
          {
            id: "val",
            data: valLoss,
            label: "Validation loss",
            color: t.palette[1],
            showMark: false,
            curve: "monotoneX",
            area: true,
            baseline: 0,
          },
        ]}
        xAxis={[
          {
            data: epoch,
            scaleType: "linear",
            label: "Epoch",
            tickMinStep: 5,
          },
        ]}
        yAxis={[
          {
            label: "Cross-Entropy Loss",
            min: 0,
            valueFormatter: (v: number) => v.toFixed(1),
          },
        ]}
        grid={{ horizontal: true }}
        sx={{
          "& .MuiChartsAxis-label": {
            fontSize: "16px !important",
            fontWeight: 500,
          },
          "& .MuiChartsAxis-tickLabel": {
            fontSize: "14px !important",
          },
          "& .MuiChartsLegend-label": {
            fontSize: "15px !important",
          },
          "& .MuiLineElement-root": {
            strokeWidth: "3px",
          },
          "& .MuiAreaElement-series-train": {
            fill: `url(#${TRAIN_GRADIENT_ID})`,
          },
          "& .MuiAreaElement-series-val": {
            fill: `url(#${VAL_GRADIENT_ID})`,
          },
        }}
        slotProps={{
          legend: {
            direction: "row",
            position: { vertical: "bottom", horizontal: "middle" },
          },
        }}
        margin={{ top: 70, right: 40, bottom: 90, left: 90 }}
      >
        {/* Subtle fades from each line down to the zero baseline — keeps
            visual weight on the curves themselves while grounding both
            series against the cross-entropy-loss floor. */}
        <defs>
          <linearGradient id={TRAIN_GRADIENT_ID} x1="0" y1="0" x2="0" y2="1">
            <stop offset="0%" stopColor={t.palette[0]} stopOpacity={0.22} />
            <stop offset="100%" stopColor={t.palette[0]} stopOpacity={0.02} />
          </linearGradient>
          <linearGradient id={VAL_GRADIENT_ID} x1="0" y1="0" x2="0" y2="1">
            <stop offset="0%" stopColor={t.palette[1]} stopOpacity={0.22} />
            <stop offset="100%" stopColor={t.palette[1]} stopOpacity={0.02} />
          </linearGradient>
        </defs>
        <DivergenceZone />
        <ChartsReferenceLine
          x={bestEpoch}
          label={`Early-stop point · epoch ${bestEpoch}`}
          labelAlign="start"
          lineStyle={{ stroke: t.ink, strokeDasharray: "6 6", strokeWidth: 1.5, strokeOpacity: 0.6 }}
          labelStyle={{ fill: t.inkSoft, fontSize: 13 }}
        />
      </LineChart>
    </div>
  );
}
Runnable source as JSON, for any HTTP client: https://api.anyplot.ai/specs/line-loss-training/muix/code. Any spec id and library id listed in llms-full.txt fit the same URL shape; every URL below is complete and callable.
{
  "spec_id": "line-loss-training",
  "language": "javascript",
  "library": "muix",
  "page": "https://anyplot.ai/line-loss-training/javascript/muix",
  "hub": "https://anyplot.ai/line-loss-training",
  "code_json": "https://api.anyplot.ai/specs/line-loss-training/muix/code",
  "spec_json": "https://api.anyplot.ai/specs/line-loss-training",
  "render_light_png": "https://storage.googleapis.com/anyplot-images/plots/line-loss-training/javascript/muix/plot-light.png",
  "render_dark_png": "https://storage.googleapis.com/anyplot-images/plots/line-loss-training/javascript/muix/plot-dark.png",
  "interactive_light_html": "https://storage.googleapis.com/anyplot-images/plots/line-loss-training/javascript/muix/plot-light.html",
  "interactive_dark_html": "https://storage.googleapis.com/anyplot-images/plots/line-loss-training/javascript/muix/plot-dark.html",
  "quality_score": 97.0,
  "license": "MIT",
  "guide": "https://anyplot.ai/llms.txt"
}
Part of Training Loss Curve on anyplot.ai.