The same plot in 14 other libraries — JavaScript: D3.js, Apache ECharts, Highcharts, MUI X Charts; Python: Altair, Bokeh, lets-plot, Matplotlib, Plotly, plotnine, Pygal, Seaborn; R: ggplot2; Julia: Makie.jl. Compare all 15 side by side: Printable Maze Puzzle in Python, R, Julia and JavaScript.
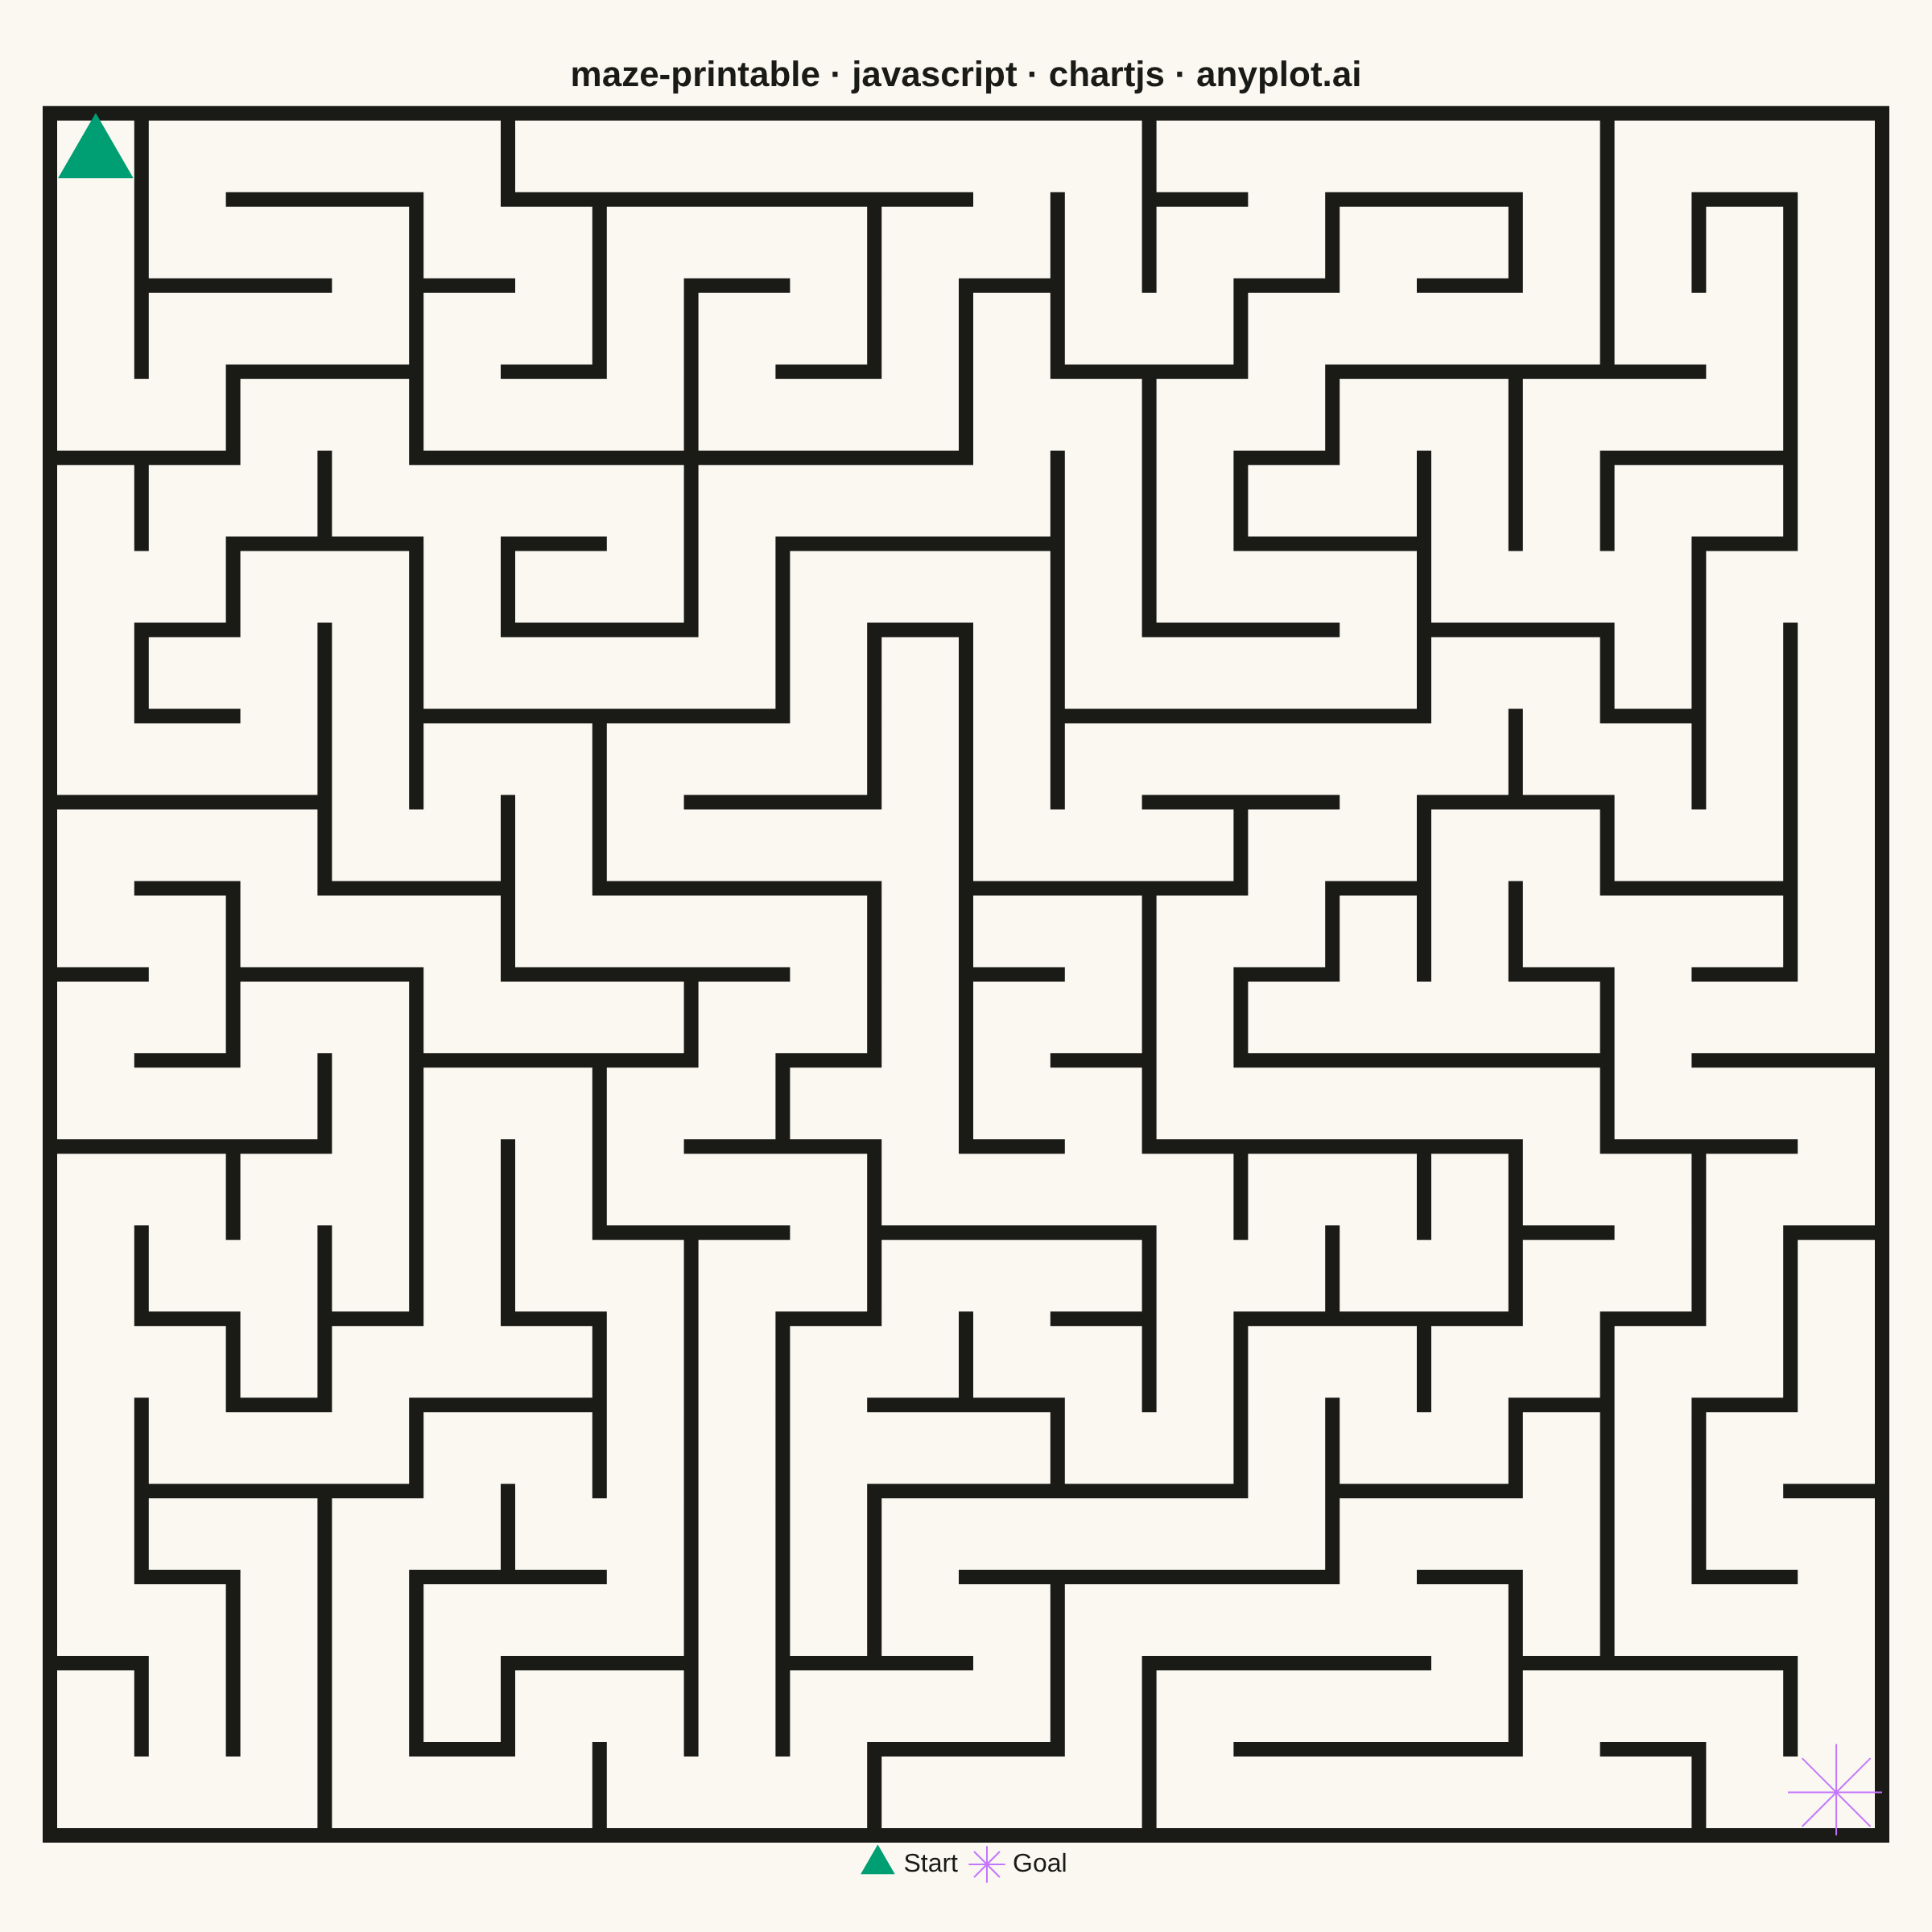
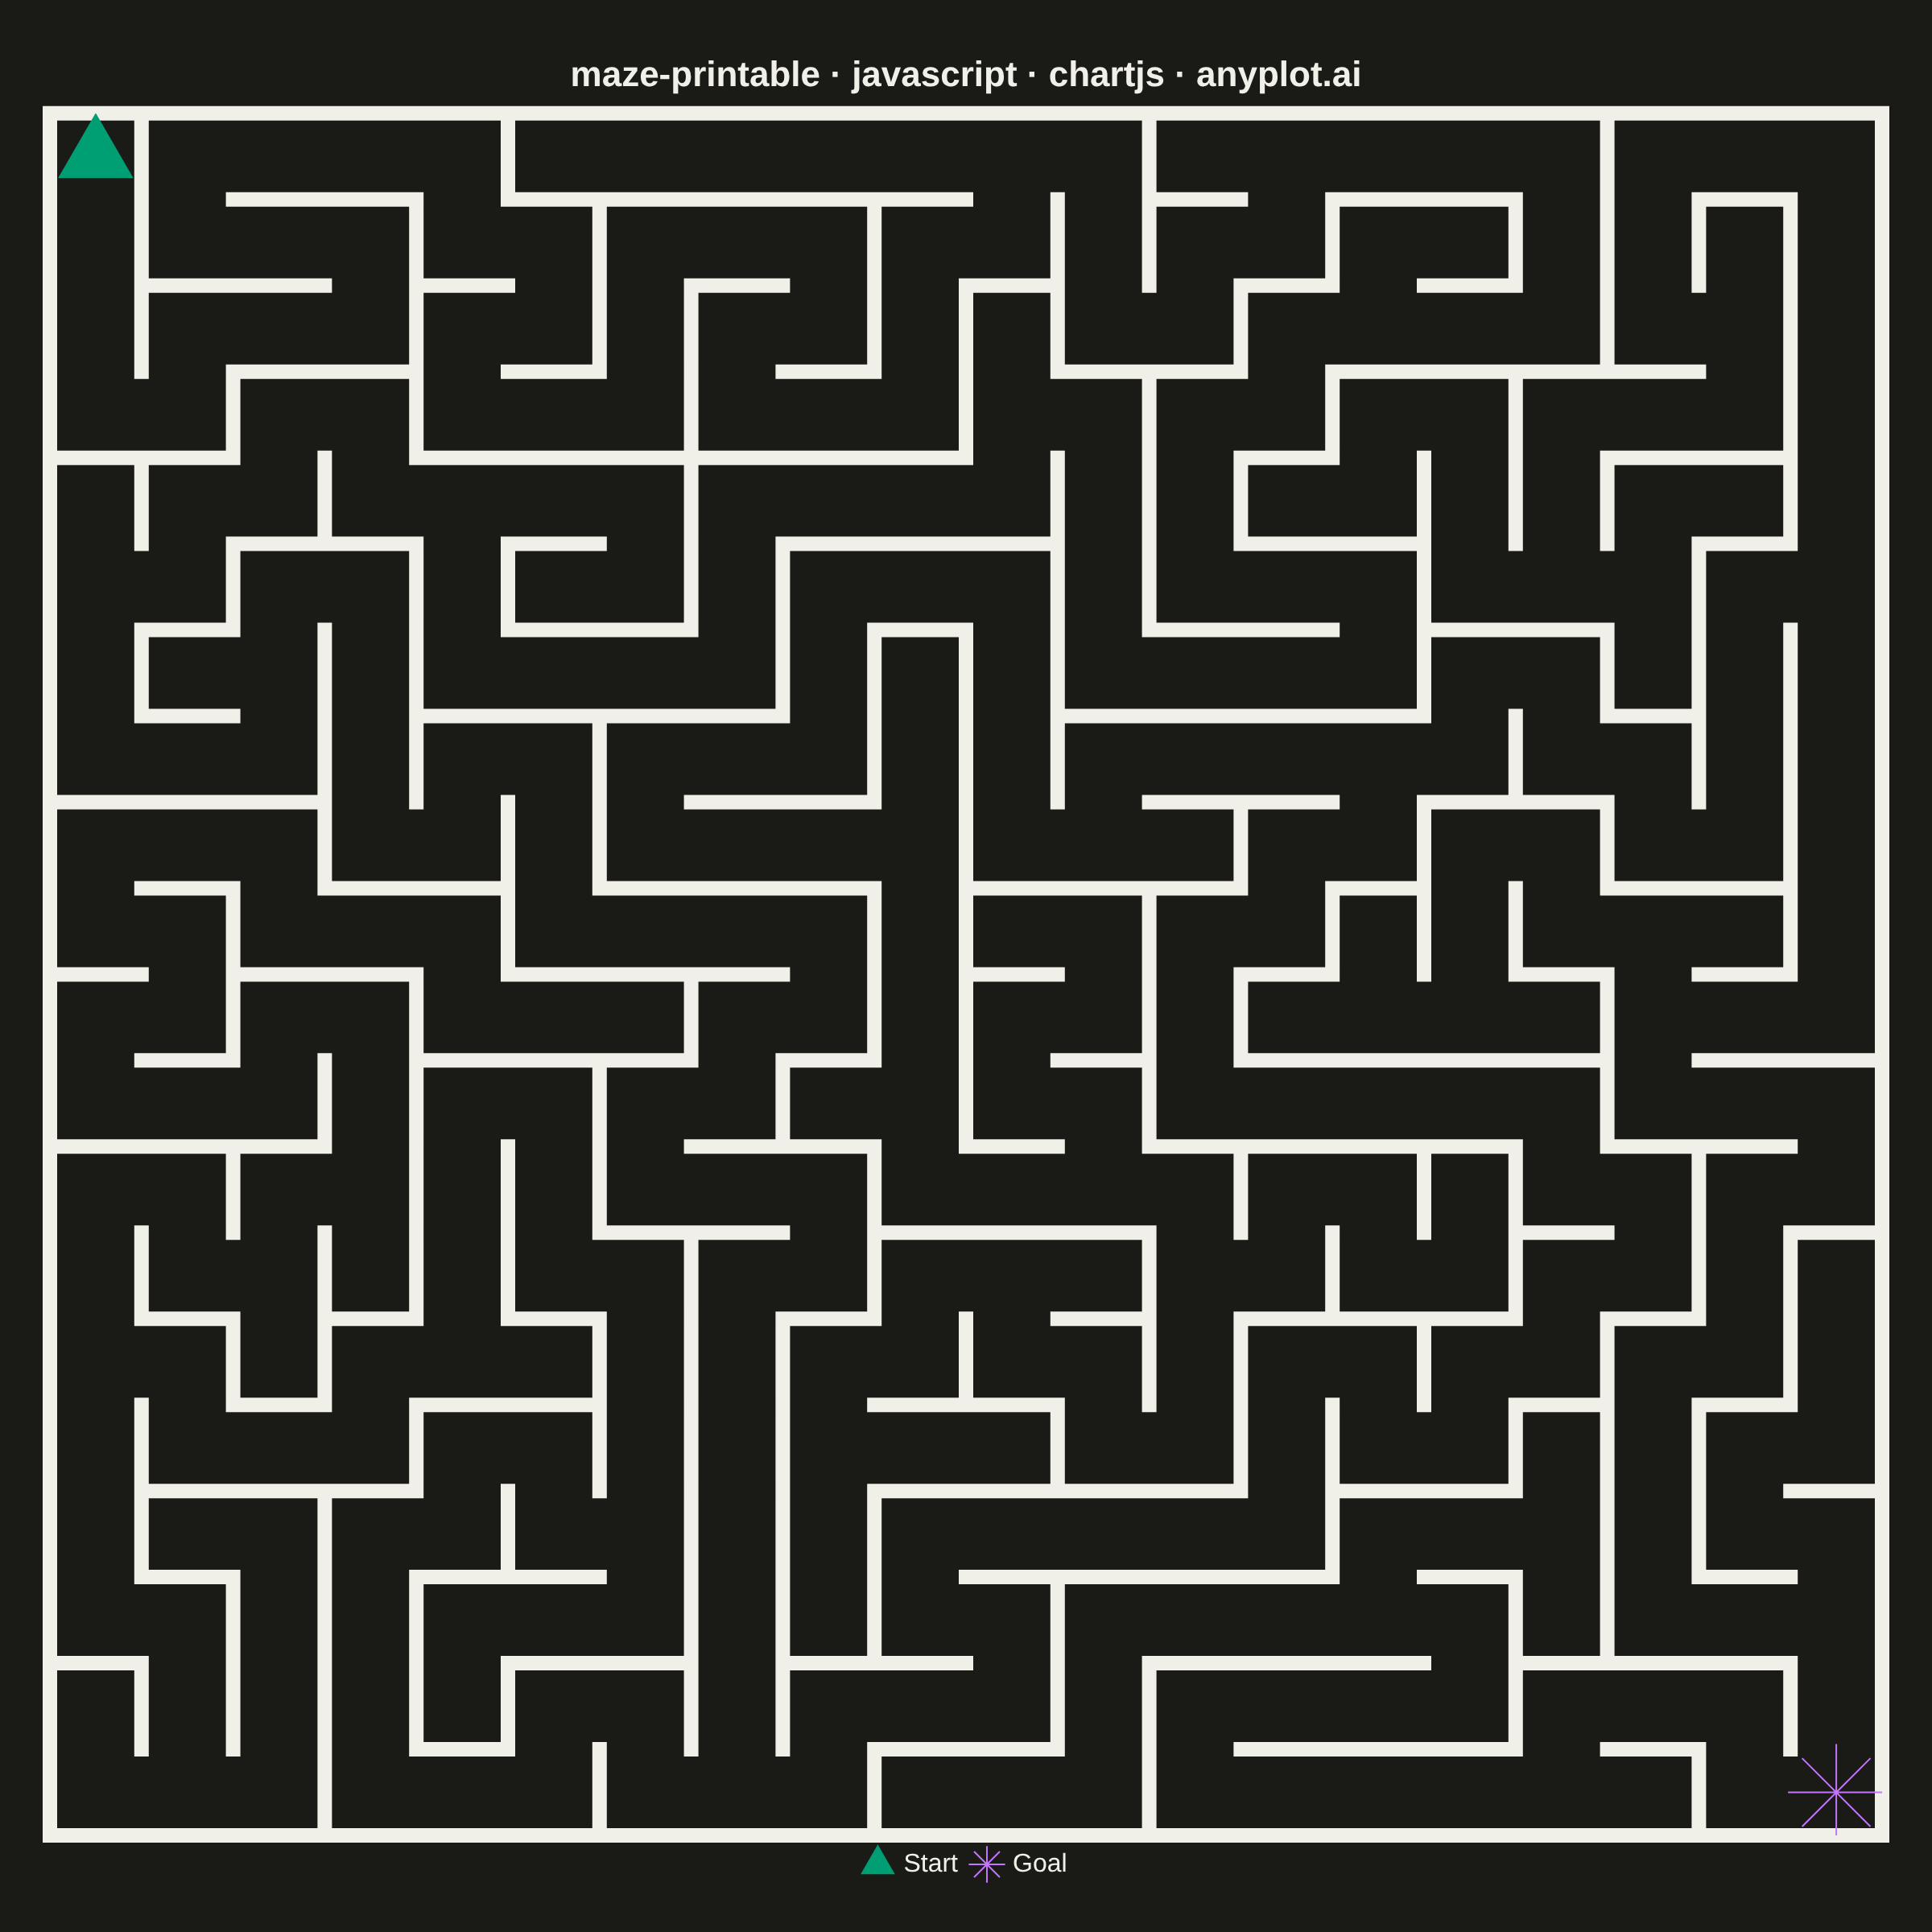
A rectangular maze puzzle visualization with clearly marked start and goal positions. The maze is algorithmically generated to guarantee exactly one solution path from start to finish. The clean black-and-white design is optimized for printing, allowing users to solve the puzzle with a pen or pencil.
// anyplot.ai
// maze-printable: Printable Maze Puzzle
// Library: chartjs 4.4.7 | JavaScript 22.23.2
// Quality: 92/100 | Created: 2026-09-05

//# anyplot-orientation: square
const t = window.ANYPLOT_TOKENS;

// --- Maze generation: recursive-backtracker DFS on a grid graph ------------
// A DFS spanning tree over the cell graph guarantees exactly one path
// between any two cells (a "perfect" maze) — no loops, no isolated pockets.
const COLS = 20;
const ROWS = 20;

// Tiny fixed-seed LCG — the browser has no seeded RNG.
function makeRng(seed) {
  let state = seed >>> 0;
  return function () {
    state = (Math.imul(state, 1103515245) + 12345) >>> 0;
    return state / 4294967296;
  };
}
const rng = makeRng(42);

function shuffle(arr) {
  for (let i = arr.length - 1; i > 0; i--) {
    const j = Math.floor(rng() * (i + 1));
    [arr[i], arr[j]] = [arr[j], arr[i]];
  }
  return arr;
}

const visited = new Array(COLS * ROWS).fill(false);
const walls = Array.from({ length: COLS * ROWS }, () => ({
  N: true,
  S: true,
  E: true,
  W: true,
}));

const stack = [[0, 0]];
visited[0] = true;
while (stack.length > 0) {
  const [col, row] = stack[stack.length - 1];
  const candidates = shuffle([
    [col, row - 1, "N", "S"],
    [col, row + 1, "S", "N"],
    [col - 1, row, "W", "E"],
    [col + 1, row, "E", "W"],
  ]).filter(
    ([nc, nr]) => nc >= 0 && nc < COLS && nr >= 0 && nr < ROWS && !visited[nr * COLS + nc],
  );

  if (candidates.length === 0) {
    stack.pop();
    continue;
  }
  const [nextCol, nextRow, dir, opposite] = candidates[0];
  walls[row * COLS + col][dir] = false;
  walls[nextRow * COLS + nextCol][opposite] = false;
  visited[nextRow * COLS + nextCol] = true;
  stack.push([nextCol, nextRow]);
}

// --- Wall segments: remaining walls as (x1,y1)-(x2,y2) data-space lines ----
// Cell (col, row) occupies x in [col, col+1], y in [ROWS-row-1, ROWS-row] so
// row 0 (the start row) renders at the top of the chart.
const wallLines = [];
for (let row = 0; row < ROWS; row++) {
  for (let col = 0; col < COLS; col++) {
    const cell = walls[row * COLS + col];
    if (cell.N) wallLines.push([col, ROWS - row, col + 1, ROWS - row]);
    if (cell.W) wallLines.push([col, ROWS - row - 1, col, ROWS - row]);
  }
}
for (let col = 0; col < COLS; col++) {
  if (walls[(ROWS - 1) * COLS + col].S) wallLines.push([col, 0, col + 1, 0]);
}
for (let row = 0; row < ROWS; row++) {
  if (walls[row * COLS + (COLS - 1)].E) wallLines.push([COLS, ROWS - row - 1, COLS, ROWS - row]);
}

// Start (top-left cell) and goal (bottom-right cell), at cell centers.
const startPoint = [{ x: 0.5, y: ROWS - 0.5 }];
const goalPoint = [{ x: COLS - 0.5, y: 0.5 }];

// --- Wall plugin: draws the maze directly on the canvas 2D context, mapping
// data-space coordinates through the chart's own linear scales. This is a
// Chart.js-native technique (a plugin hooking chart lifecycle + scale API)
// rather than a portable point/line-dataset trick.
const mazeWallsPlugin = {
  id: "mazeWalls",
  beforeDatasetsDraw(chart) {
    const { ctx, scales } = chart;
    ctx.save();
    ctx.strokeStyle = t.ink;
    ctx.lineWidth = 9;
    ctx.lineCap = "square";
    ctx.lineJoin = "miter";
    ctx.beginPath();
    for (const [x1, y1, x2, y2] of wallLines) {
      ctx.moveTo(scales.x.getPixelForValue(x1), scales.y.getPixelForValue(y1));
      ctx.lineTo(scales.x.getPixelForValue(x2), scales.y.getPixelForValue(y2));
    }
    ctx.stroke();
    ctx.restore();
  },
};

// --- Mount -------------------------------------------------------------
const canvas = document.createElement("canvas");
document.getElementById("container").appendChild(canvas);

// --- Chart -----------------------------------------------------------------
const title = "maze-printable · javascript · chartjs · anyplot.ai";

new Chart(canvas, {
  type: "line",
  data: {
    datasets: [
      {
        label: "Start",
        data: startPoint,
        showLine: false,
        pointStyle: "triangle",
        pointRadius: 26,
        backgroundColor: t.palette[0],
        borderColor: t.palette[0],
      },
      {
        label: "Goal",
        data: goalPoint,
        showLine: false,
        pointStyle: "star",
        pointRadius: 30,
        backgroundColor: t.palette[1],
        borderColor: t.palette[1],
      },
    ],
  },
  plugins: [mazeWallsPlugin],
  options: {
    responsive: true,
    maintainAspectRatio: false,
    animation: false,
    layout: { padding: 24 },
    plugins: {
      title: { display: true, text: title, color: t.ink, font: { size: 22 } },
      legend: {
        display: true,
        position: "bottom",
        labels: { color: t.ink, font: { size: 16 }, usePointStyle: true },
      },
    },
    scales: {
      x: { type: "linear", min: 0, max: COLS, display: false },
      y: { type: "linear", min: 0, max: ROWS, display: false },
    },
  },
});
Runnable source as JSON, for any HTTP client: https://api.anyplot.ai/specs/maze-printable/chartjs/code. Any spec id and library id listed in llms-full.txt fit the same URL shape; every URL below is complete and callable.
{
  "spec_id": "maze-printable",
  "language": "javascript",
  "library": "chartjs",
  "page": "https://anyplot.ai/maze-printable/javascript/chartjs",
  "hub": "https://anyplot.ai/maze-printable",
  "code_json": "https://api.anyplot.ai/specs/maze-printable/chartjs/code",
  "spec_json": "https://api.anyplot.ai/specs/maze-printable",
  "render_light_png": "https://storage.googleapis.com/anyplot-images/plots/maze-printable/javascript/chartjs/plot-light.png",
  "render_dark_png": "https://storage.googleapis.com/anyplot-images/plots/maze-printable/javascript/chartjs/plot-dark.png",
  "interactive_light_html": "https://storage.googleapis.com/anyplot-images/plots/maze-printable/javascript/chartjs/plot-light.html",
  "interactive_dark_html": "https://storage.googleapis.com/anyplot-images/plots/maze-printable/javascript/chartjs/plot-dark.html",
  "quality_score": 92.0,
  "license": "MIT",
  "guide": "https://anyplot.ai/llms.txt"
}
Part of Printable Maze Puzzle on anyplot.ai.