The same plot in 14 other libraries — JavaScript: Chart.js, D3.js, Apache ECharts, MUI X Charts; Python: Altair, Bokeh, lets-plot, Matplotlib, Plotly, plotnine, Pygal, Seaborn; R: ggplot2; Julia: Makie.jl. Compare all 15 side by side: Printable Maze Puzzle in Python, R, Julia and JavaScript.
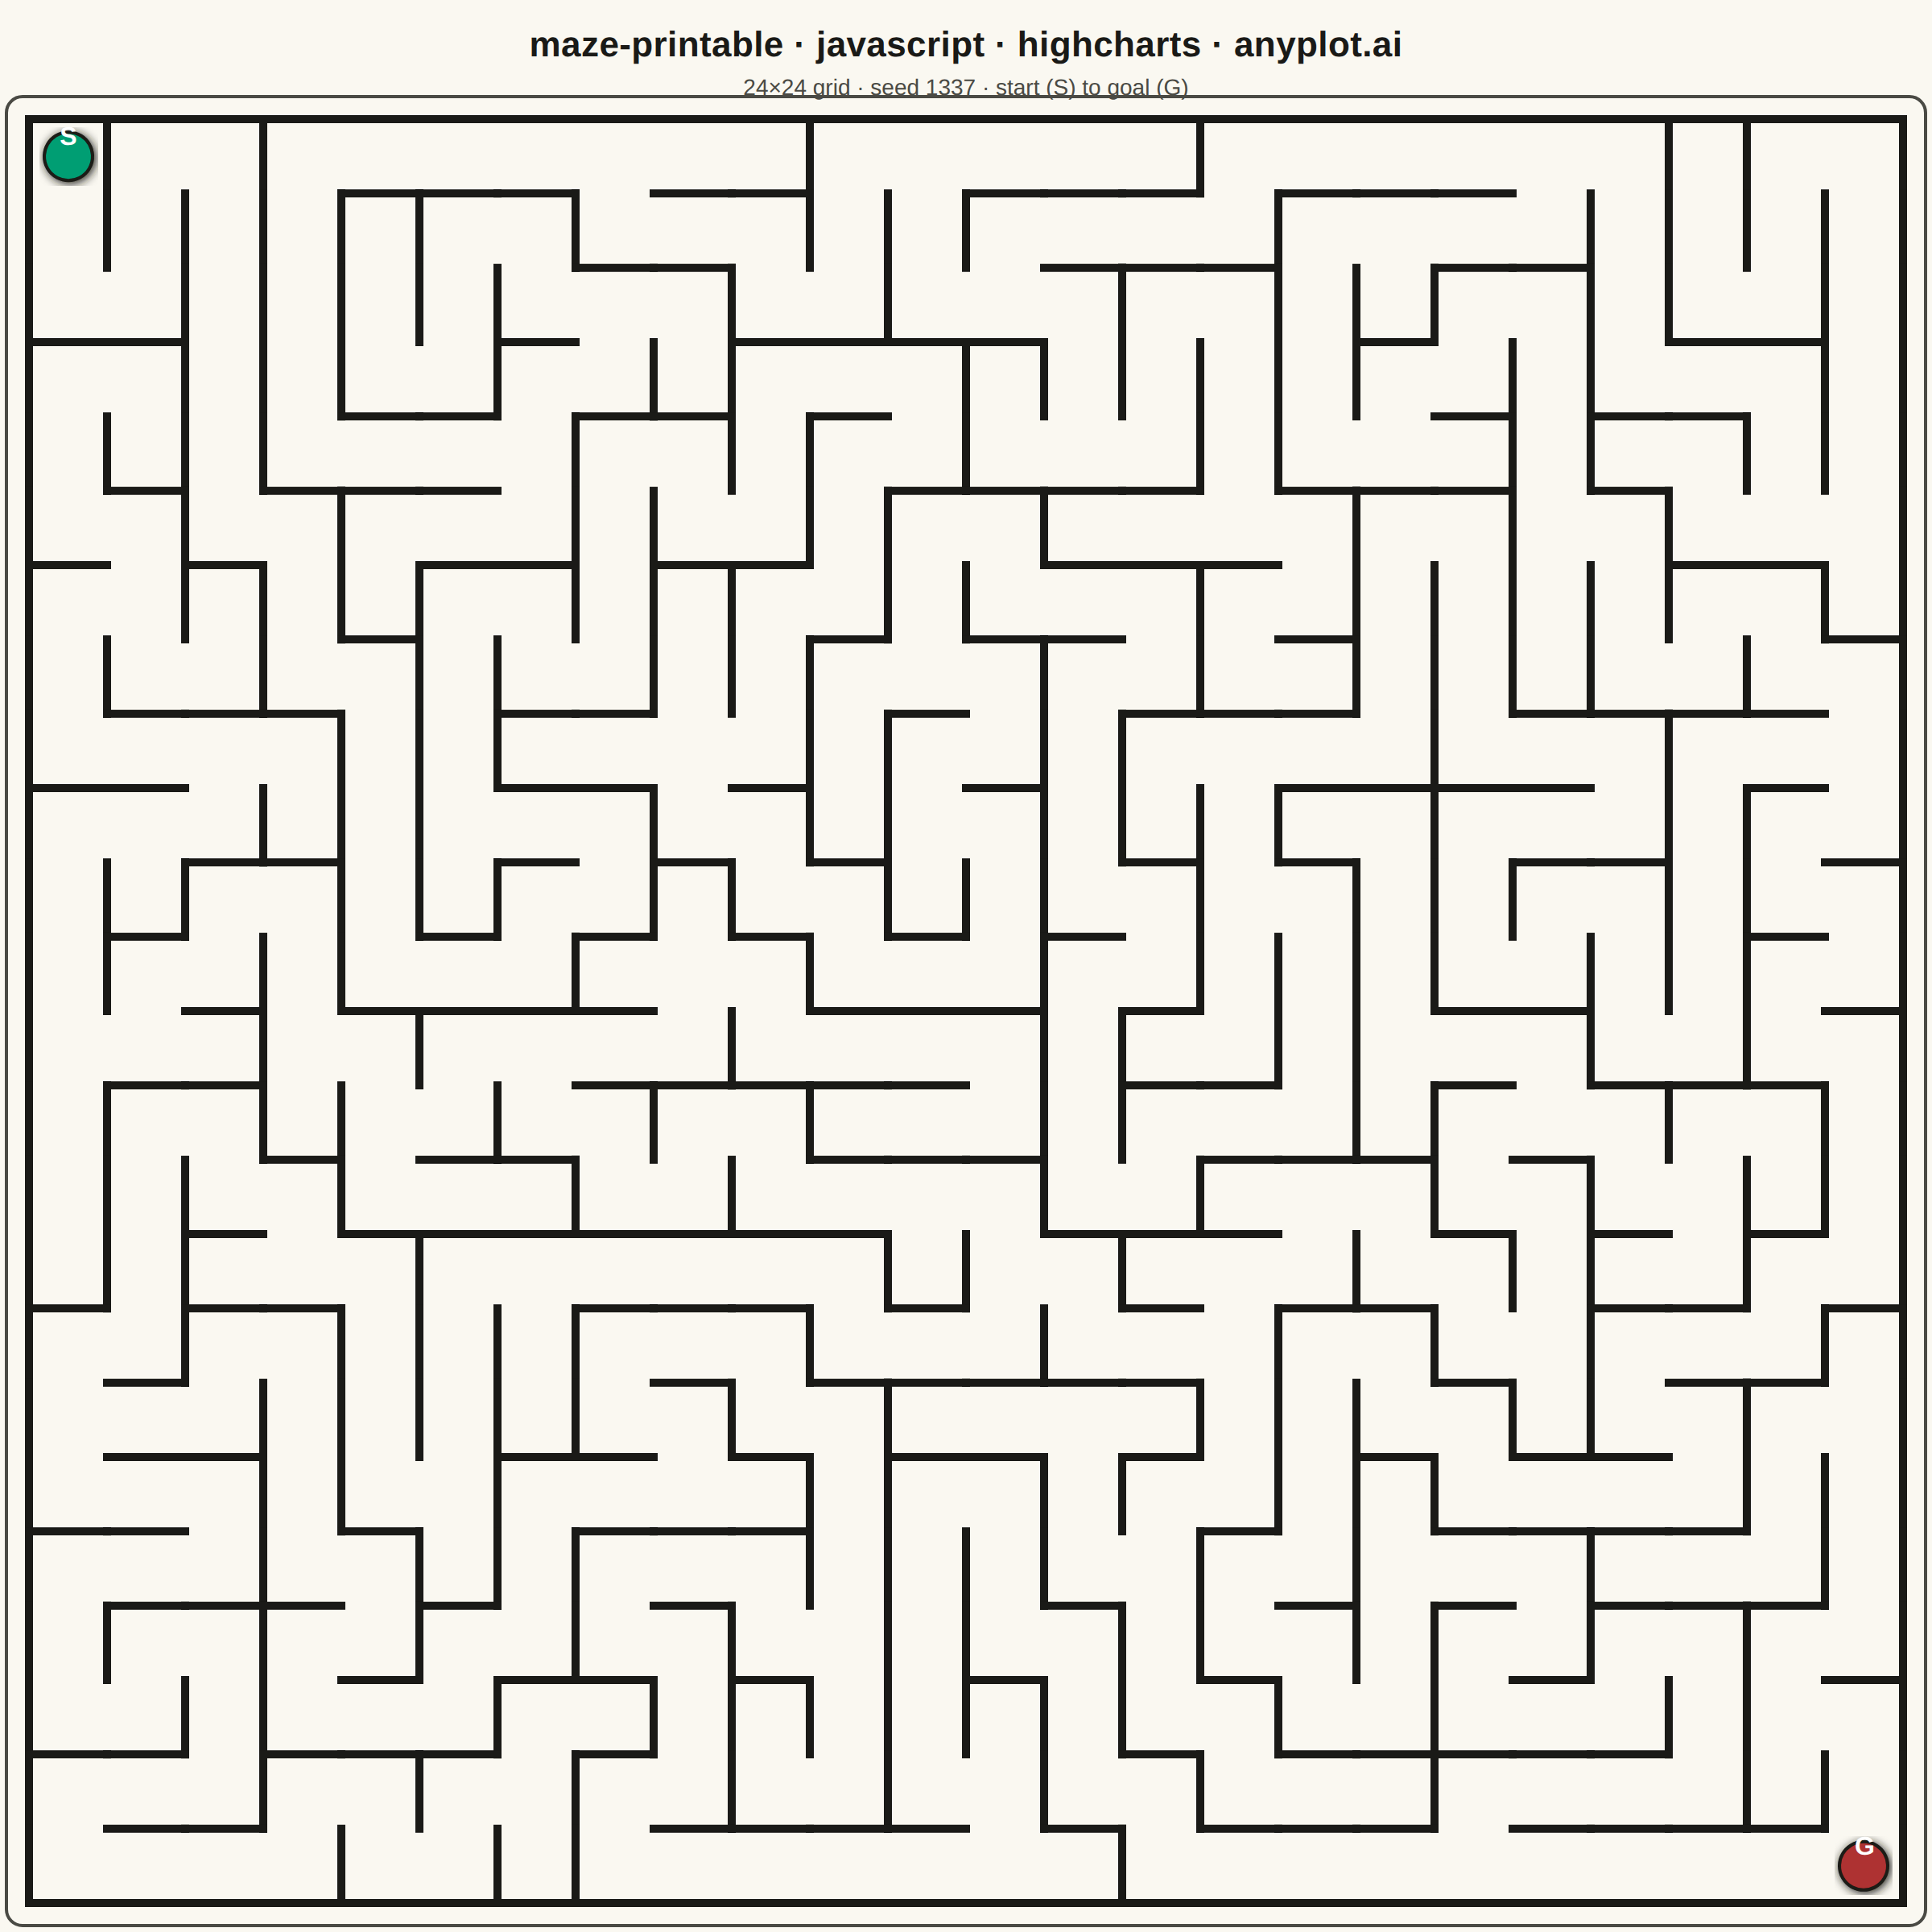
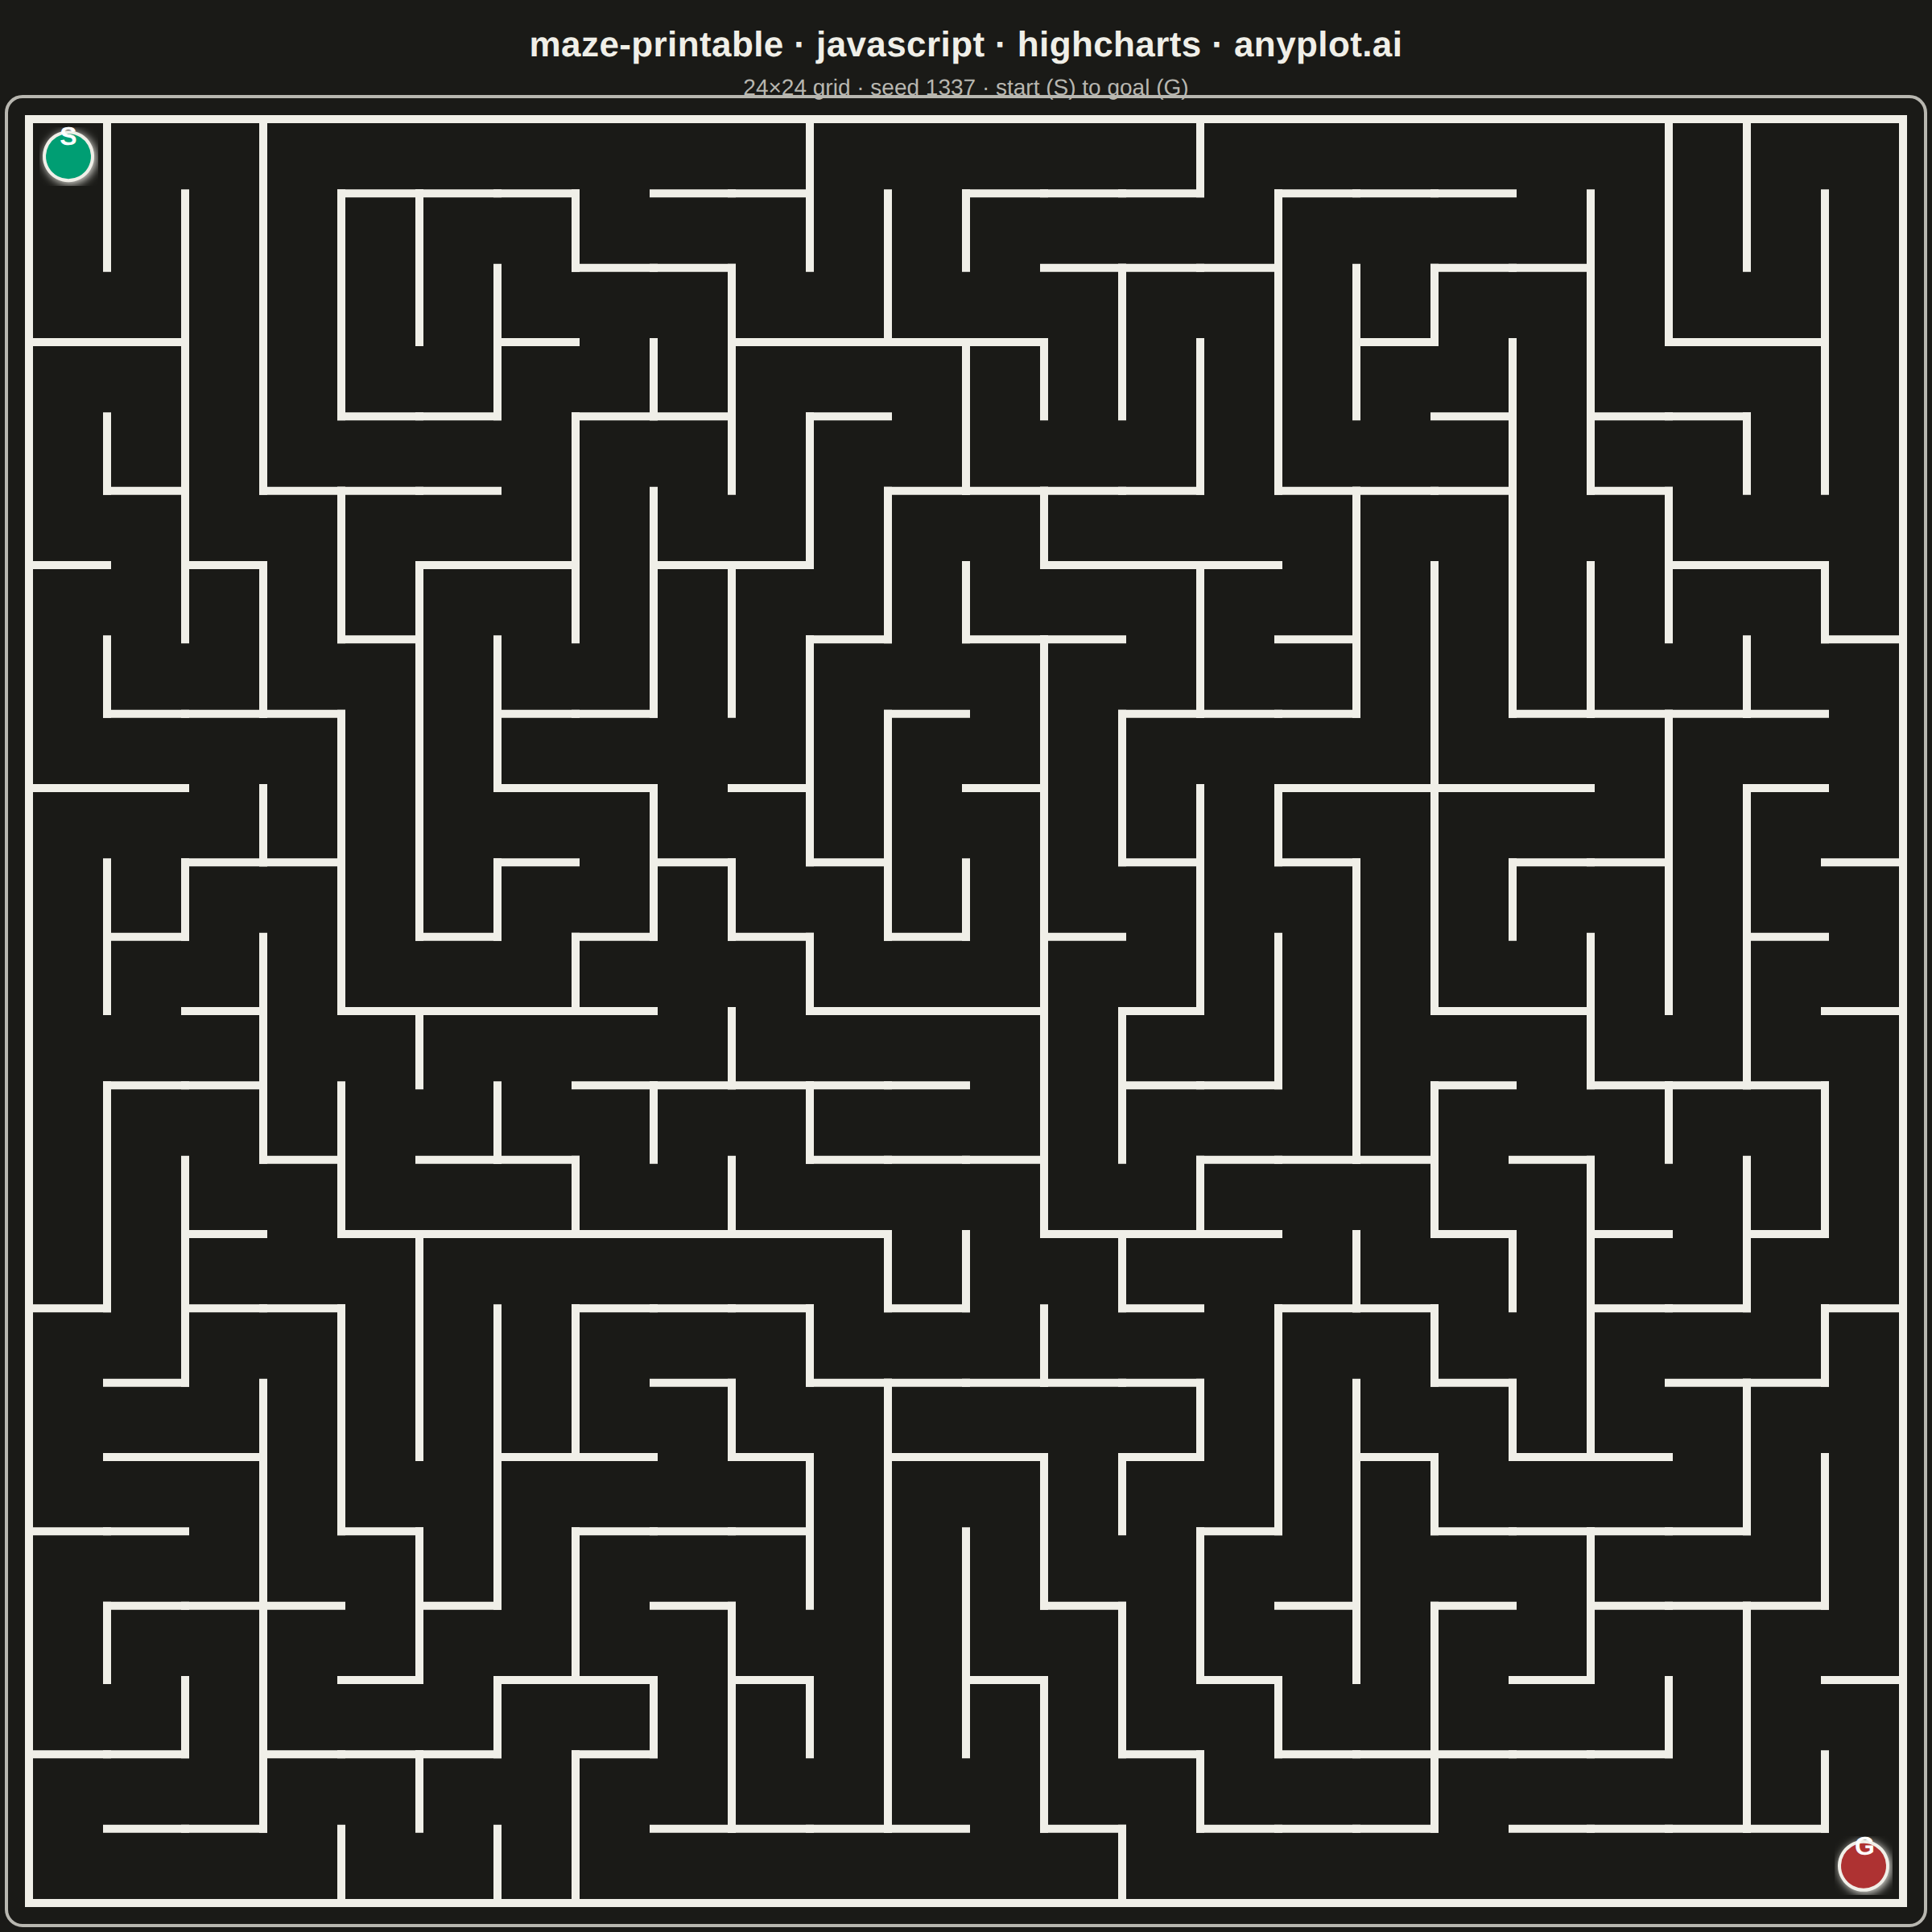
A rectangular maze puzzle visualization with clearly marked start and goal positions. The maze is algorithmically generated to guarantee exactly one solution path from start to finish. The clean black-and-white design is optimized for printing, allowing users to solve the puzzle with a pen or pencil.
// anyplot.ai
// maze-printable: Printable Maze Puzzle
// Library: highcharts 12.6.0 | JavaScript 22.23.2
// Quality: 91/100 | Created: 2026-09-05
//# anyplot-orientation: square

const t = window.ANYPLOT_TOKENS;

// --- Config ------------------------------------------------------------
const WIDTH = 24;
const HEIGHT = 24;
const SEED = 1337;

// --- Deterministic RNG (tiny LCG — no seeded RNG exists in-browser) -----
function makeRng(seed) {
  let state = seed >>> 0;
  return function rng() {
    state = (Math.imul(state, 1664525) + 1013904223) >>> 0;
    return state / 4294967296;
  };
}

// --- Maze generation: recursive backtracker (guarantees a single, --------
// unique path between any two cells — a perfect maze / spanning tree) ----
function generateMaze(width, height, rng) {
  const cells = [];
  for (let r = 0; r < height; r++) {
    const row = [];
    for (let c = 0; c < width; c++) {
      row.push({ top: true, right: true, bottom: true, left: true });
    }
    cells.push(row);
  }

  const DIRS = [
    { dr: -1, dc: 0, wall: "top", opposite: "bottom" },
    { dr: 0, dc: 1, wall: "right", opposite: "left" },
    { dr: 1, dc: 0, wall: "bottom", opposite: "top" },
    { dr: 0, dc: -1, wall: "left", opposite: "right" },
  ];

  const visited = Array.from({ length: height }, () => new Array(width).fill(false));
  const stack = [[0, 0]];
  visited[0][0] = true;

  while (stack.length) {
    const [r, c] = stack[stack.length - 1];
    const candidates = [];
    for (const d of DIRS) {
      const nr = r + d.dr;
      const nc = c + d.dc;
      if (nr >= 0 && nr < height && nc >= 0 && nc < width && !visited[nr][nc]) {
        candidates.push({ nr, nc, wall: d.wall, opposite: d.opposite });
      }
    }
    if (candidates.length === 0) {
      stack.pop();
      continue;
    }
    const pick = candidates[Math.floor(rng() * candidates.length)];
    cells[r][c][pick.wall] = false;
    cells[pick.nr][pick.nc][pick.opposite] = false;
    visited[pick.nr][pick.nc] = true;
    stack.push([pick.nr, pick.nc]);
  }

  return cells;
}

// --- Walls -> a flat list of [x0,y0,x1,y1] segments (each wall is drawn ---
// exactly once: every cell contributes its own top + left edge, and the
// outer grid contributes the closing right + bottom border). Segments are
// drawn as individual SVG paths via the chart renderer rather than as
// series data, since a maze is vector art, not a plotted series.
function buildWallSegments(cells, width, height) {
  const segments = [];
  const segment = (x0, y0, x1, y1) => segments.push([x0, y0, x1, y1]);

  for (let r = 0; r < height; r++) {
    for (let c = 0; c < width; c++) {
      const cell = cells[r][c];
      const yTop = height - r;
      const yBottom = height - r - 1;
      if (cell.top) segment(c, yTop, c + 1, yTop);
      if (cell.left) segment(c, yBottom, c, yTop);
      if (r === height - 1 && cell.bottom) segment(c, yBottom, c + 1, yBottom);
      if (c === width - 1 && cell.right) segment(c + 1, yBottom, c + 1, yTop);
    }
  }

  return segments;
}

const rng = makeRng(SEED);
const maze = generateMaze(WIDTH, HEIGHT, rng);
const wallData = buildWallSegments(maze, WIDTH, HEIGHT);

const startPoint = { x: 0.5, y: HEIGHT - 0.5 };
const goalPoint = { x: WIDTH - 0.5, y: 0.5 };

// --- Chart ---------------------------------------------------------------
// Decorative outset frame drawn once the axes are laid out: a thin rounded
// border around the maze's bounding box, offset outward for breathing room.
// Purely chrome (never overlaps a wall segment), so it cannot hint at the
// solution path.
const FRAME_PAD = 14;
const FRAME_RADIUS = 10;

// Soft drop-shadow applied to the S/G marker graphics after they render,
// giving the two focal points a subtle lift off the flat maze plane — a
// second distinctive use of the SVG renderer beyond the wall vector art.
const MARKER_SHADOW = { color: t.ink, opacity: 0.28, width: 6 };

Highcharts.chart("container", {
  chart: {
    type: "line",
    backgroundColor: "transparent",
    animation: false,
    spacing: [18, 18, 18, 18],
    style: { fontFamily: "inherit" },
    events: {
      load: function drawWalls() {
        const chart = this;
        const xAxis = chart.xAxis[0];
        const yAxis = chart.yAxis[0];

        const xPix0 = xAxis.toPixels(0);
        const xPix1 = xAxis.toPixels(WIDTH);
        const yPixTop = yAxis.toPixels(HEIGHT);
        const yPixBottom = yAxis.toPixels(0);
        chart.renderer
          .rect(
            xPix0 - FRAME_PAD,
            yPixTop - FRAME_PAD,
            xPix1 - xPix0 + 2 * FRAME_PAD,
            yPixBottom - yPixTop + 2 * FRAME_PAD,
            FRAME_RADIUS
          )
          .attr({ "stroke-width": 2, stroke: t.inkSoft, fill: "none", zIndex: 1 })
          .add();

        wallData.forEach(([x0, y0, x1, y1]) => {
          chart.renderer
            .path(["M", xAxis.toPixels(x0), yAxis.toPixels(y0), "L", xAxis.toPixels(x1), yAxis.toPixels(y1)])
            .attr({ "stroke-width": 5, stroke: t.ink, "stroke-linecap": "square", zIndex: 5 })
            .add();
        });

        chart.series.forEach((series) => {
          series.points.forEach((point) => {
            if (point.graphic) point.graphic.shadow(MARKER_SHADOW);
          });
        });

        window.__anyplotReady = true;
      },
    },
  },
  credits: { enabled: false },
  tooltip: { enabled: false },
  title: {
    text: "maze-printable · javascript · highcharts · anyplot.ai",
    style: { color: t.ink, fontSize: "22px", fontWeight: "700", letterSpacing: "0.2px" },
  },
  subtitle: {
    text: `${WIDTH}×${HEIGHT} grid · seed ${SEED} · start (S) to goal (G)`,
    style: { color: t.inkSoft, fontSize: "14px" },
  },
  xAxis: {
    min: 0,
    max: WIDTH,
    lineWidth: 0,
    tickLength: 0,
    gridLineWidth: 0,
    startOnTick: false,
    endOnTick: false,
    minPadding: 0,
    maxPadding: 0,
    labels: { enabled: false },
    title: { text: null },
  },
  yAxis: {
    min: 0,
    max: HEIGHT,
    lineWidth: 0,
    tickLength: 0,
    gridLineWidth: 0,
    startOnTick: false,
    endOnTick: false,
    minPadding: 0,
    maxPadding: 0,
    labels: { enabled: false },
    title: { text: null },
  },
  legend: { enabled: false },
  plotOptions: {
    series: { animation: false, enableMouseTracking: false, states: { hover: { enabled: false } } },
  },
  series: [
    {
      type: "scatter",
      name: "Start",
      data: [startPoint],
      color: t.palette[0],
      marker: { radius: 15, symbol: "circle", lineColor: t.ink, lineWidth: 2 },
      dataLabels: {
        enabled: true,
        format: "S",
        style: { color: "#FFFFFF", fontSize: "16px", fontWeight: "700", textOutline: "none" },
      },
    },
    {
      type: "scatter",
      name: "Goal",
      data: [goalPoint],
      color: t.palette[4],
      marker: { radius: 15, symbol: "circle", lineColor: t.ink, lineWidth: 2 },
      dataLabels: {
        enabled: true,
        format: "G",
        style: { color: "#FFFFFF", fontSize: "16px", fontWeight: "700", textOutline: "none" },
      },
    },
  ],
});
Runnable source as JSON, for any HTTP client: https://api.anyplot.ai/specs/maze-printable/highcharts/code. Any spec id and library id listed in llms-full.txt fit the same URL shape; every URL below is complete and callable.
{
  "spec_id": "maze-printable",
  "language": "javascript",
  "library": "highcharts",
  "page": "https://anyplot.ai/maze-printable/javascript/highcharts",
  "hub": "https://anyplot.ai/maze-printable",
  "code_json": "https://api.anyplot.ai/specs/maze-printable/highcharts/code",
  "spec_json": "https://api.anyplot.ai/specs/maze-printable",
  "render_light_png": "https://storage.googleapis.com/anyplot-images/plots/maze-printable/javascript/highcharts/plot-light.png",
  "render_dark_png": "https://storage.googleapis.com/anyplot-images/plots/maze-printable/javascript/highcharts/plot-dark.png",
  "interactive_light_html": "https://storage.googleapis.com/anyplot-images/plots/maze-printable/javascript/highcharts/plot-light.html",
  "interactive_dark_html": "https://storage.googleapis.com/anyplot-images/plots/maze-printable/javascript/highcharts/plot-dark.html",
  "quality_score": 91.0,
  "license": "MIT",
  "guide": "https://anyplot.ai/llms.txt"
}
Part of Printable Maze Puzzle on anyplot.ai.