The same plot in 14 other libraries — JavaScript: Chart.js, D3.js, Highcharts, MUI X Charts; Python: Altair, Bokeh, lets-plot, Matplotlib, Plotly, plotnine, Pygal, Seaborn; R: ggplot2; Julia: Makie.jl. Compare all 15 side by side: Printable Maze Puzzle in Python, R, Julia and JavaScript.
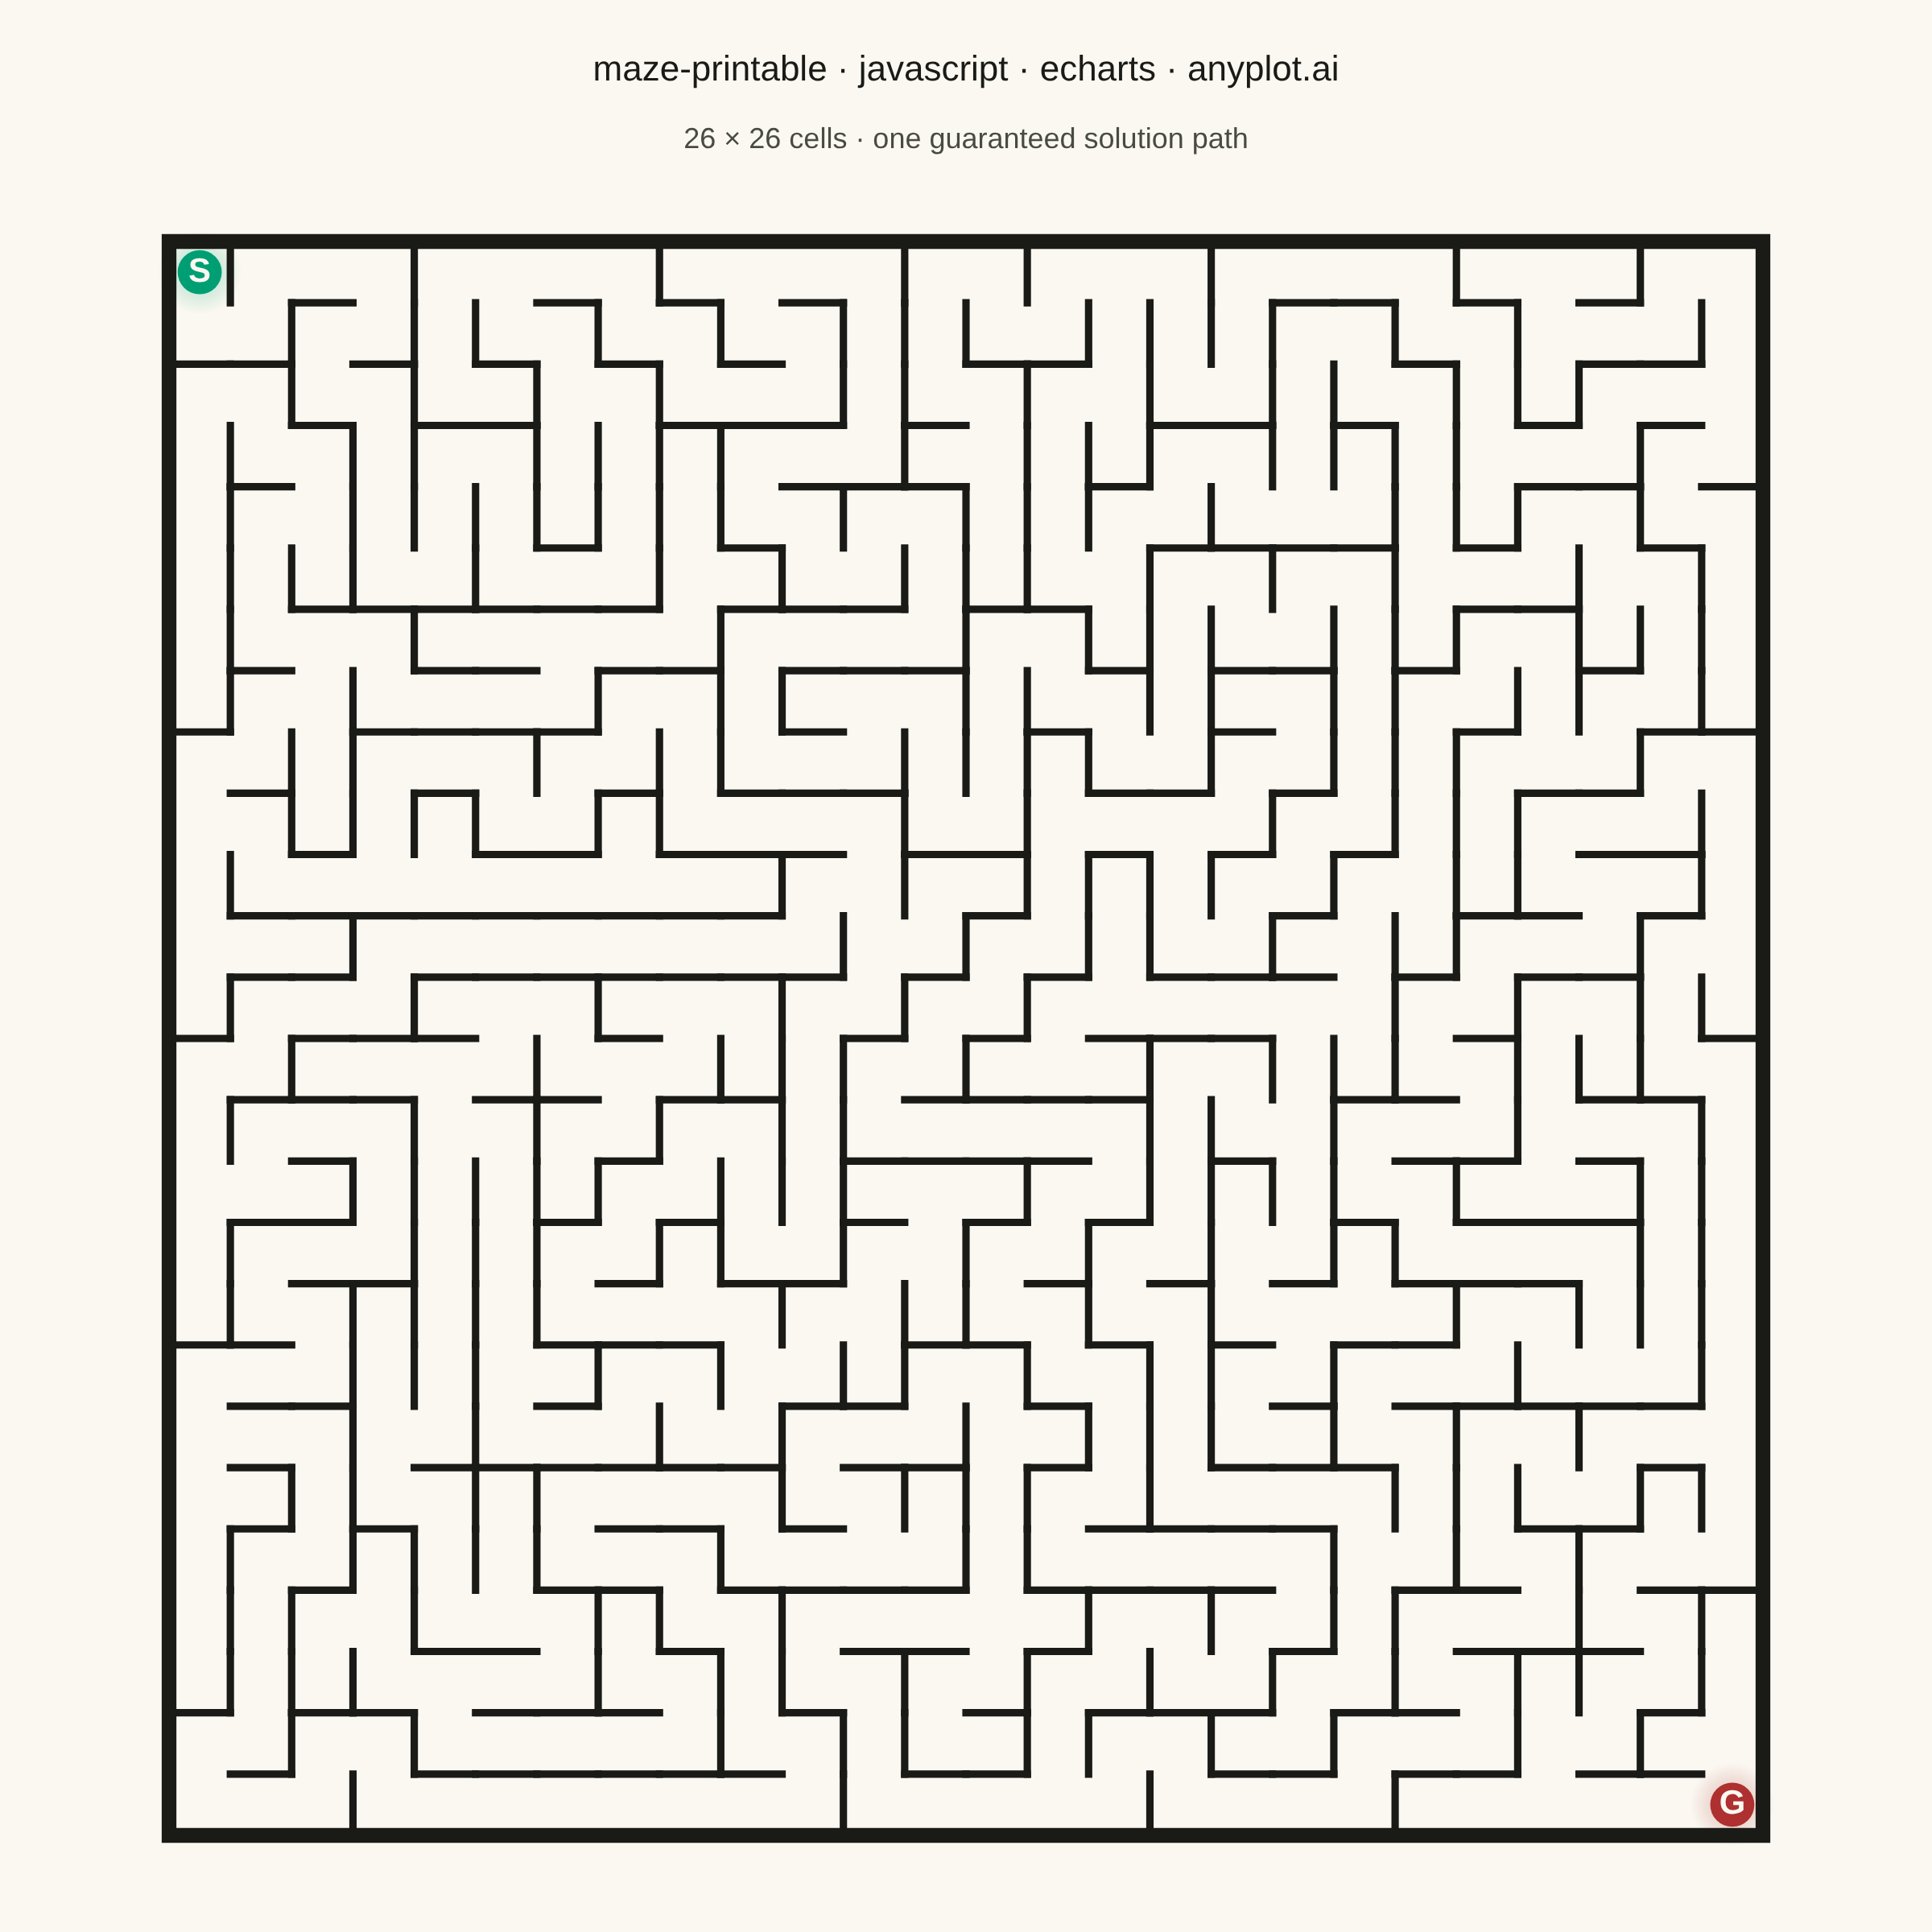
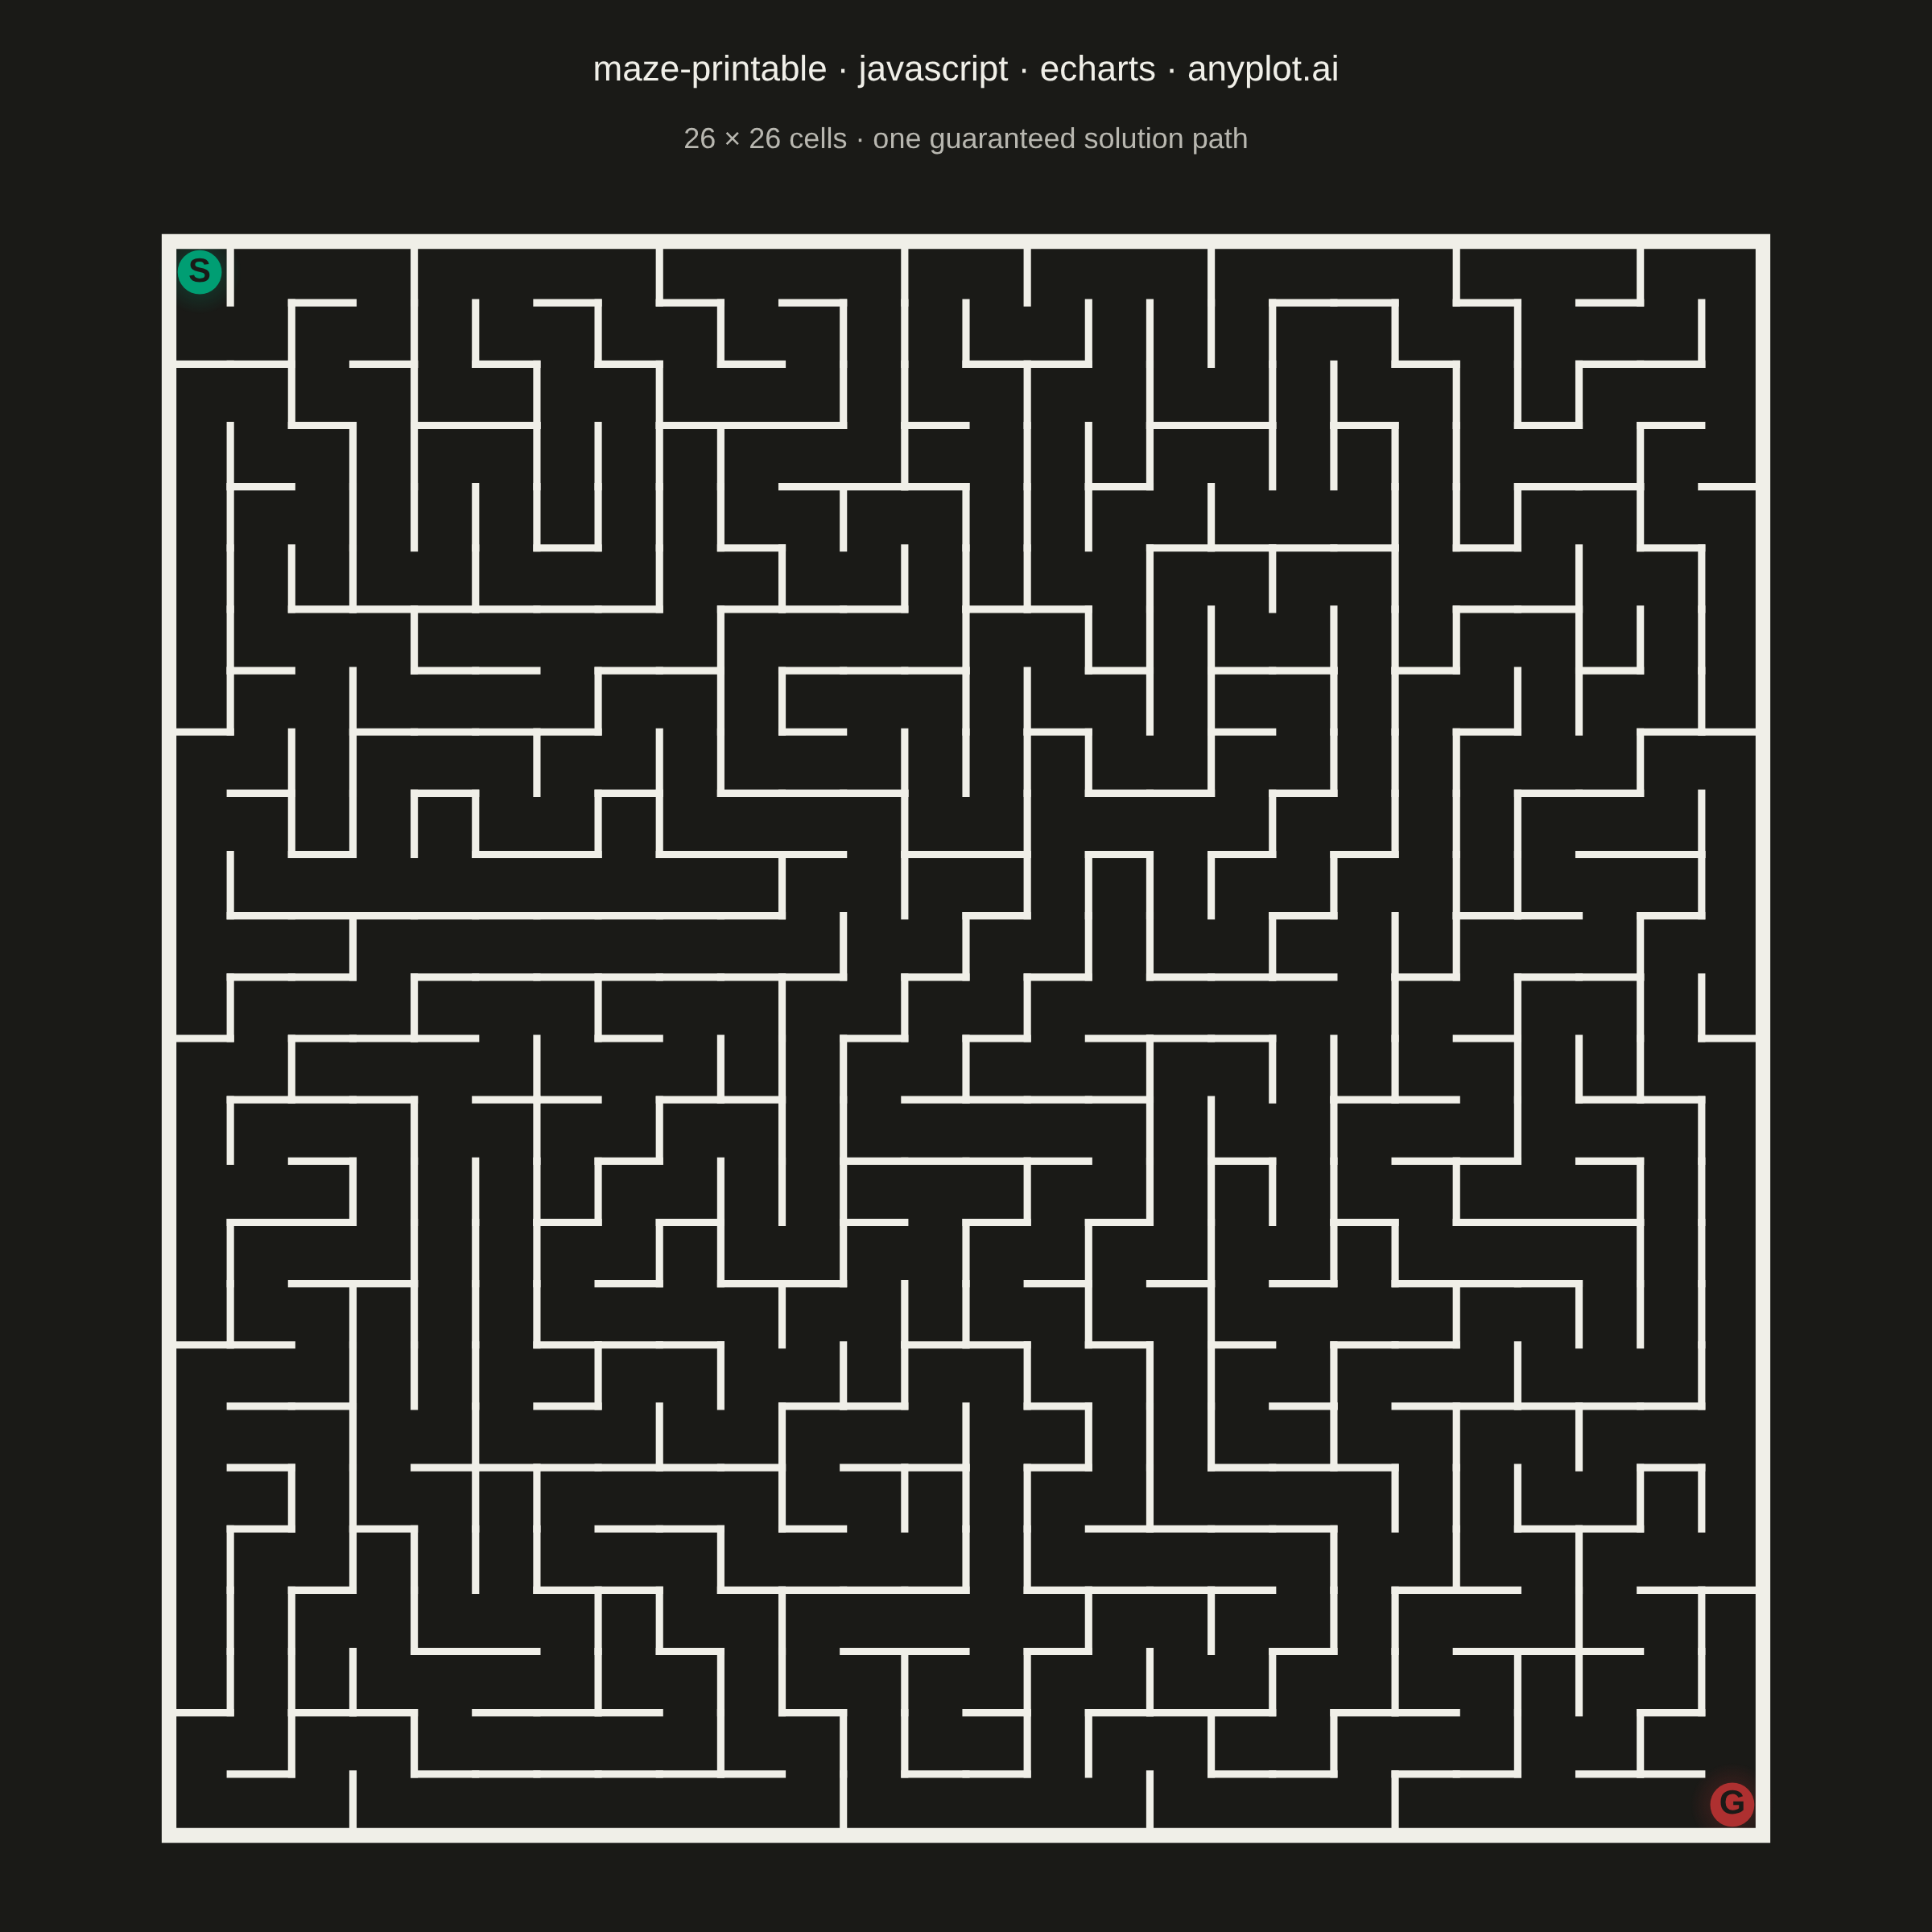
A rectangular maze puzzle visualization with clearly marked start and goal positions. The maze is algorithmically generated to guarantee exactly one solution path from start to finish. The clean black-and-white design is optimized for printing, allowing users to solve the puzzle with a pen or pencil.
// anyplot.ai
// maze-printable: Printable Maze Puzzle
// Library: echarts 6.1.0 | JavaScript 22.23.2
// Quality: 91/100 | Created: 2026-09-05
//# anyplot-orientation: square

const t = window.ANYPLOT_TOKENS;
const size = window.ANYPLOT_SIZE;

// --- Deterministic RNG (LCG — the browser has no seeded Math.random) --------
function makeLcg(seed) {
  let state = seed >>> 0;
  return () => {
    state = (Math.imul(state, 1664525) + 1013904223) >>> 0;
    return state / 4294967296;
  };
}

// --- Maze generation: recursive backtracker (guarantees a perfect maze — --
// --- exactly one simple path between any two cells, incl. start -> goal) --
const cols = 26;
const rows = 26;
const rng = makeLcg(20260905);

const index = (r, c) => r * cols + c;
const cells = Array.from({ length: rows * cols }, () => ({ N: true, S: true, E: true, W: true }));
const visited = new Array(rows * cols).fill(false);

const DIRECTIONS = [
  { key: "N", opposite: "S", dr: -1, dc: 0 },
  { key: "S", opposite: "N", dr: 1, dc: 0 },
  { key: "E", opposite: "W", dr: 0, dc: 1 },
  { key: "W", opposite: "E", dr: 0, dc: -1 },
];

const stack = [[0, 0]];
visited[index(0, 0)] = true;
while (stack.length > 0) {
  const [r, c] = stack[stack.length - 1];
  const unvisitedNeighbors = DIRECTIONS.map((d) => ({ ...d, nr: r + d.dr, nc: c + d.dc })).filter(
    (d) => d.nr >= 0 && d.nr < rows && d.nc >= 0 && d.nc < cols && !visited[index(d.nr, d.nc)]
  );

  if (unvisitedNeighbors.length === 0) {
    stack.pop();
    continue;
  }

  const next = unvisitedNeighbors[Math.floor(rng() * unvisitedNeighbors.length)];
  cells[index(r, c)][next.key] = false;
  cells[index(next.nr, next.nc)][next.opposite] = false;
  visited[index(next.nr, next.nc)] = true;
  stack.push([next.nr, next.nc]);
}

// --- Layout: fit the cell grid inside the mount, below the title/caption ---
const margin = { top: 150, bottom: 60, left: 60, right: 60 };
const usableWidth = size.width - margin.left - margin.right;
const usableHeight = size.height - margin.top - margin.bottom;
const cellSize = Math.min(usableWidth / cols, usableHeight / rows);
const gridWidth = cellSize * cols;
const gridHeight = cellSize * rows;
const originX = margin.left + (usableWidth - gridWidth) / 2;
const originY = margin.top + (usableHeight - gridHeight) / 2;

const cellLeft = (c) => originX + c * cellSize;
const cellTop = (r) => originY + r * cellSize;

// --- Walls as individual line segments (N + W per cell, plus the two -------
// --- outer edges so the boundary is never drawn twice) ----------------------
const wallWidth = Math.max(3, cellSize * 0.12);
const wallSegments = [];
for (let r = 0; r < rows; r += 1) {
  for (let c = 0; c < cols; c += 1) {
    const cell = cells[index(r, c)];
    const x0 = cellLeft(c);
    const y0 = cellTop(r);
    const x1 = x0 + cellSize;
    const y1 = y0 + cellSize;
    if (cell.N) wallSegments.push([x0, y0, x1, y0]);
    if (cell.W) wallSegments.push([x0, y0, x0, y1]);
    if (r === rows - 1 && cell.S) wallSegments.push([x0, y1, x1, y1]);
    if (c === cols - 1 && cell.E) wallSegments.push([x1, y0, x1, y1]);
  }
}

const wallElements = wallSegments.map(([x1, y1, x2, y2]) => ({
  type: "line",
  shape: { x1, y1, x2, y2 },
  style: { stroke: t.ink, lineWidth: wallWidth, lineCap: "square" },
  silent: true,
}));

// --- Heavier outer border frames the puzzle and separates it from the -------
// --- page, reinforcing the print-ready boundary beyond the interior walls --
const outerBorder = {
  type: "rect",
  shape: { x: originX, y: originY, width: gridWidth, height: gridHeight },
  style: { stroke: t.ink, lineWidth: wallWidth * 2, fill: "transparent" },
  silent: true,
};

// --- Start / goal markers (traffic-light convention: green = go, red = stop)
const markerRadius = cellSize * 0.36;
const markerFont = Math.max(14, cellSize * 0.55);
const startCenter = { cx: cellLeft(0) + cellSize / 2, cy: cellTop(0) + cellSize / 2 };
const goalCenter = { cx: cellLeft(cols - 1) + cellSize / 2, cy: cellTop(rows - 1) + cellSize / 2 };

// Soft radial halos (echarts.graphic.RadialGradient) behind each marker —
// an ECharts-distinctive touch that draws the eye from start to goal.
const hexToRgba = (hex, alpha) => {
  const n = parseInt(hex.slice(1), 16);
  const r = (n >> 16) & 255;
  const g = (n >> 8) & 255;
  const b = n & 255;
  return `rgba(${r}, ${g}, ${b}, ${alpha})`;
};

const makeHalo = (cx, cy, color) => ({
  type: "circle",
  shape: { cx, cy, r: markerRadius * 1.9 },
  style: {
    fill: new echarts.graphic.RadialGradient(0.5, 0.5, 0.5, [
      { offset: 0, color: hexToRgba(color, 0.32) },
      { offset: 1, color: hexToRgba(color, 0) },
    ]),
  },
  silent: true,
});

const startHalo = makeHalo(startCenter.cx, startCenter.cy, t.palette[0]);
const goalHalo = makeHalo(goalCenter.cx, goalCenter.cy, "#AE3030");

const startMarker = {
  type: "circle",
  shape: { cx: startCenter.cx, cy: startCenter.cy, r: markerRadius },
  style: {
    fill: t.palette[0],
    text: "S",
    textFill: t.pageBg,
    textPosition: "inside",
    fontSize: markerFont,
    fontWeight: "bold",
  },
  silent: true,
};

const goalMarker = {
  type: "circle",
  shape: { cx: goalCenter.cx, cy: goalCenter.cy, r: markerRadius },
  style: {
    fill: "#AE3030",
    text: "G",
    textFill: t.pageBg,
    textPosition: "inside",
    fontSize: markerFont,
    fontWeight: "bold",
  },
  silent: true,
};

const caption = {
  type: "text",
  left: "center",
  top: 78,
  style: {
    text: `${cols} × ${rows} cells · one guaranteed solution path`,
    fill: t.inkSoft,
    fontSize: 18,
  },
};

// --- Init --------------------------------------------------------------------
const chart = echarts.init(document.getElementById("container"));

// --- Option ------------------------------------------------------------------
chart.setOption({
  animation: false,
  backgroundColor: "transparent",
  title: {
    text: "maze-printable · javascript · echarts · anyplot.ai",
    left: "center",
    top: 28,
    textStyle: { color: t.ink, fontSize: 22, fontWeight: 500 },
  },
  graphic: {
    elements: [caption, startHalo, goalHalo, ...wallElements, outerBorder, startMarker, goalMarker],
  },
});
Runnable source as JSON, for any HTTP client: https://api.anyplot.ai/specs/maze-printable/echarts/code. Any spec id and library id listed in llms-full.txt fit the same URL shape; every URL below is complete and callable.
{
  "spec_id": "maze-printable",
  "language": "javascript",
  "library": "echarts",
  "page": "https://anyplot.ai/maze-printable/javascript/echarts",
  "hub": "https://anyplot.ai/maze-printable",
  "code_json": "https://api.anyplot.ai/specs/maze-printable/echarts/code",
  "spec_json": "https://api.anyplot.ai/specs/maze-printable",
  "render_light_png": "https://storage.googleapis.com/anyplot-images/plots/maze-printable/javascript/echarts/plot-light.png",
  "render_dark_png": "https://storage.googleapis.com/anyplot-images/plots/maze-printable/javascript/echarts/plot-dark.png",
  "interactive_light_html": "https://storage.googleapis.com/anyplot-images/plots/maze-printable/javascript/echarts/plot-light.html",
  "interactive_dark_html": "https://storage.googleapis.com/anyplot-images/plots/maze-printable/javascript/echarts/plot-dark.html",
  "quality_score": 91.0,
  "license": "MIT",
  "guide": "https://anyplot.ai/llms.txt"
}
Part of Printable Maze Puzzle on anyplot.ai.