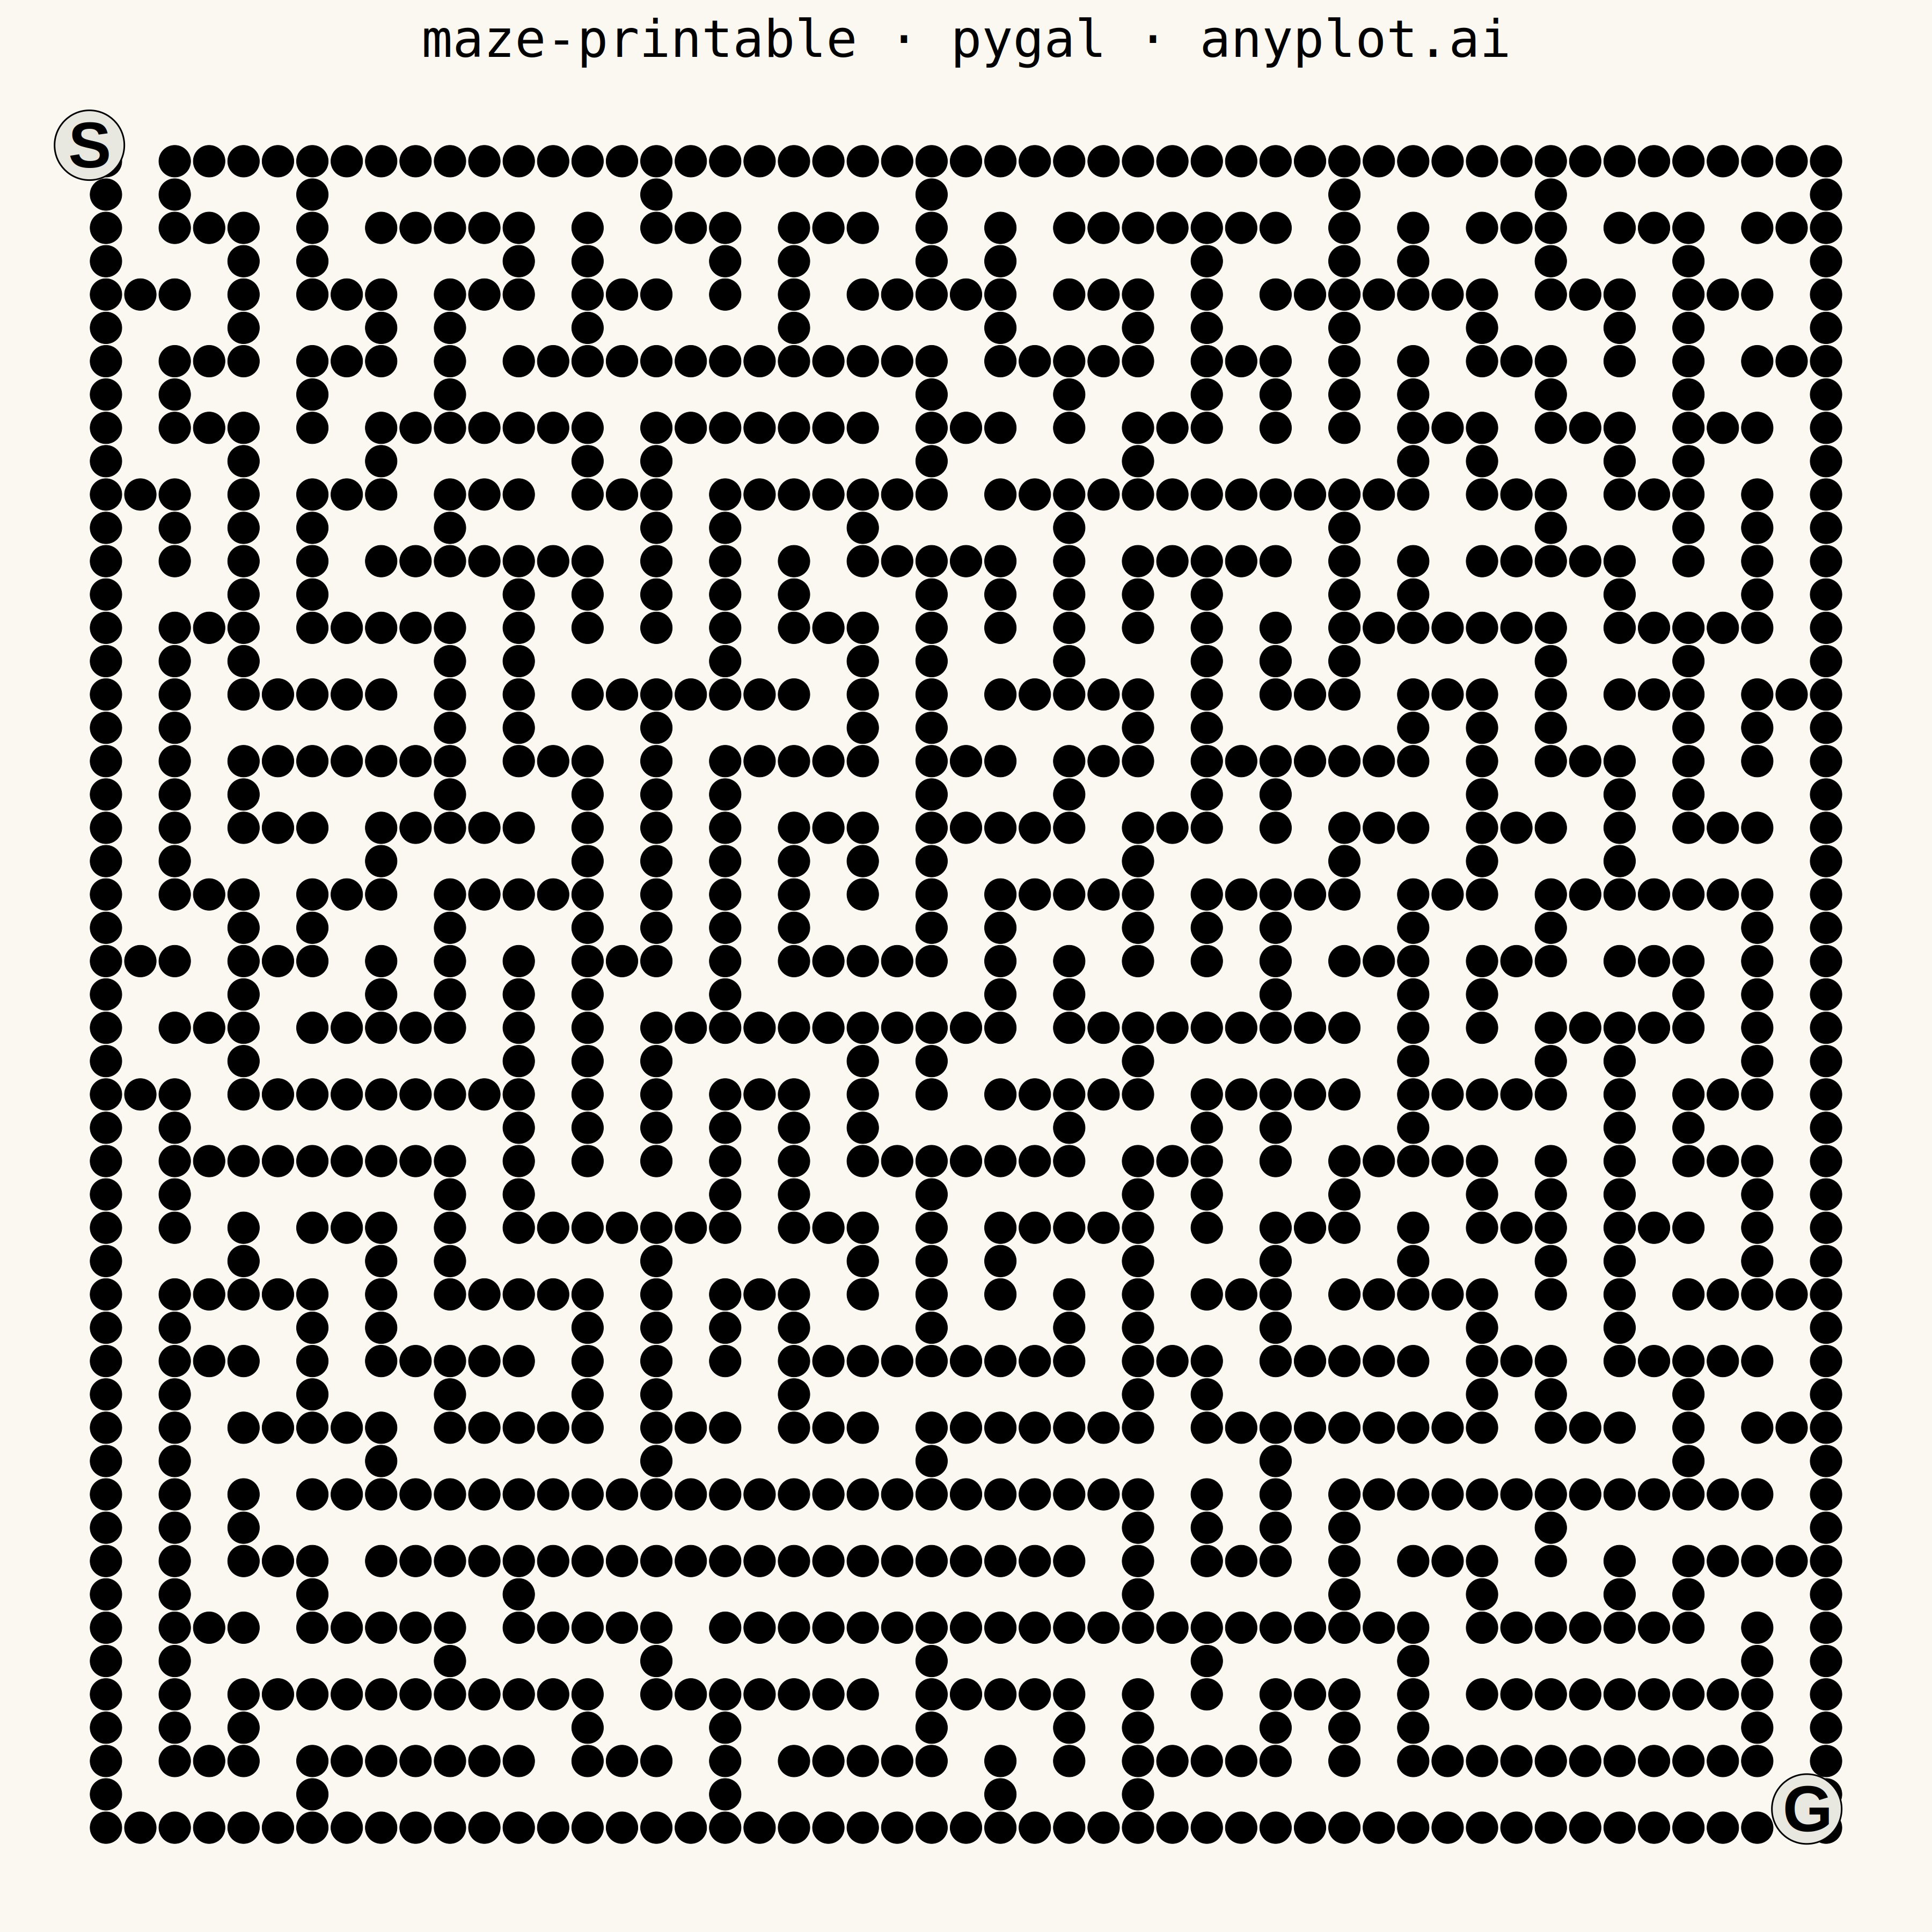
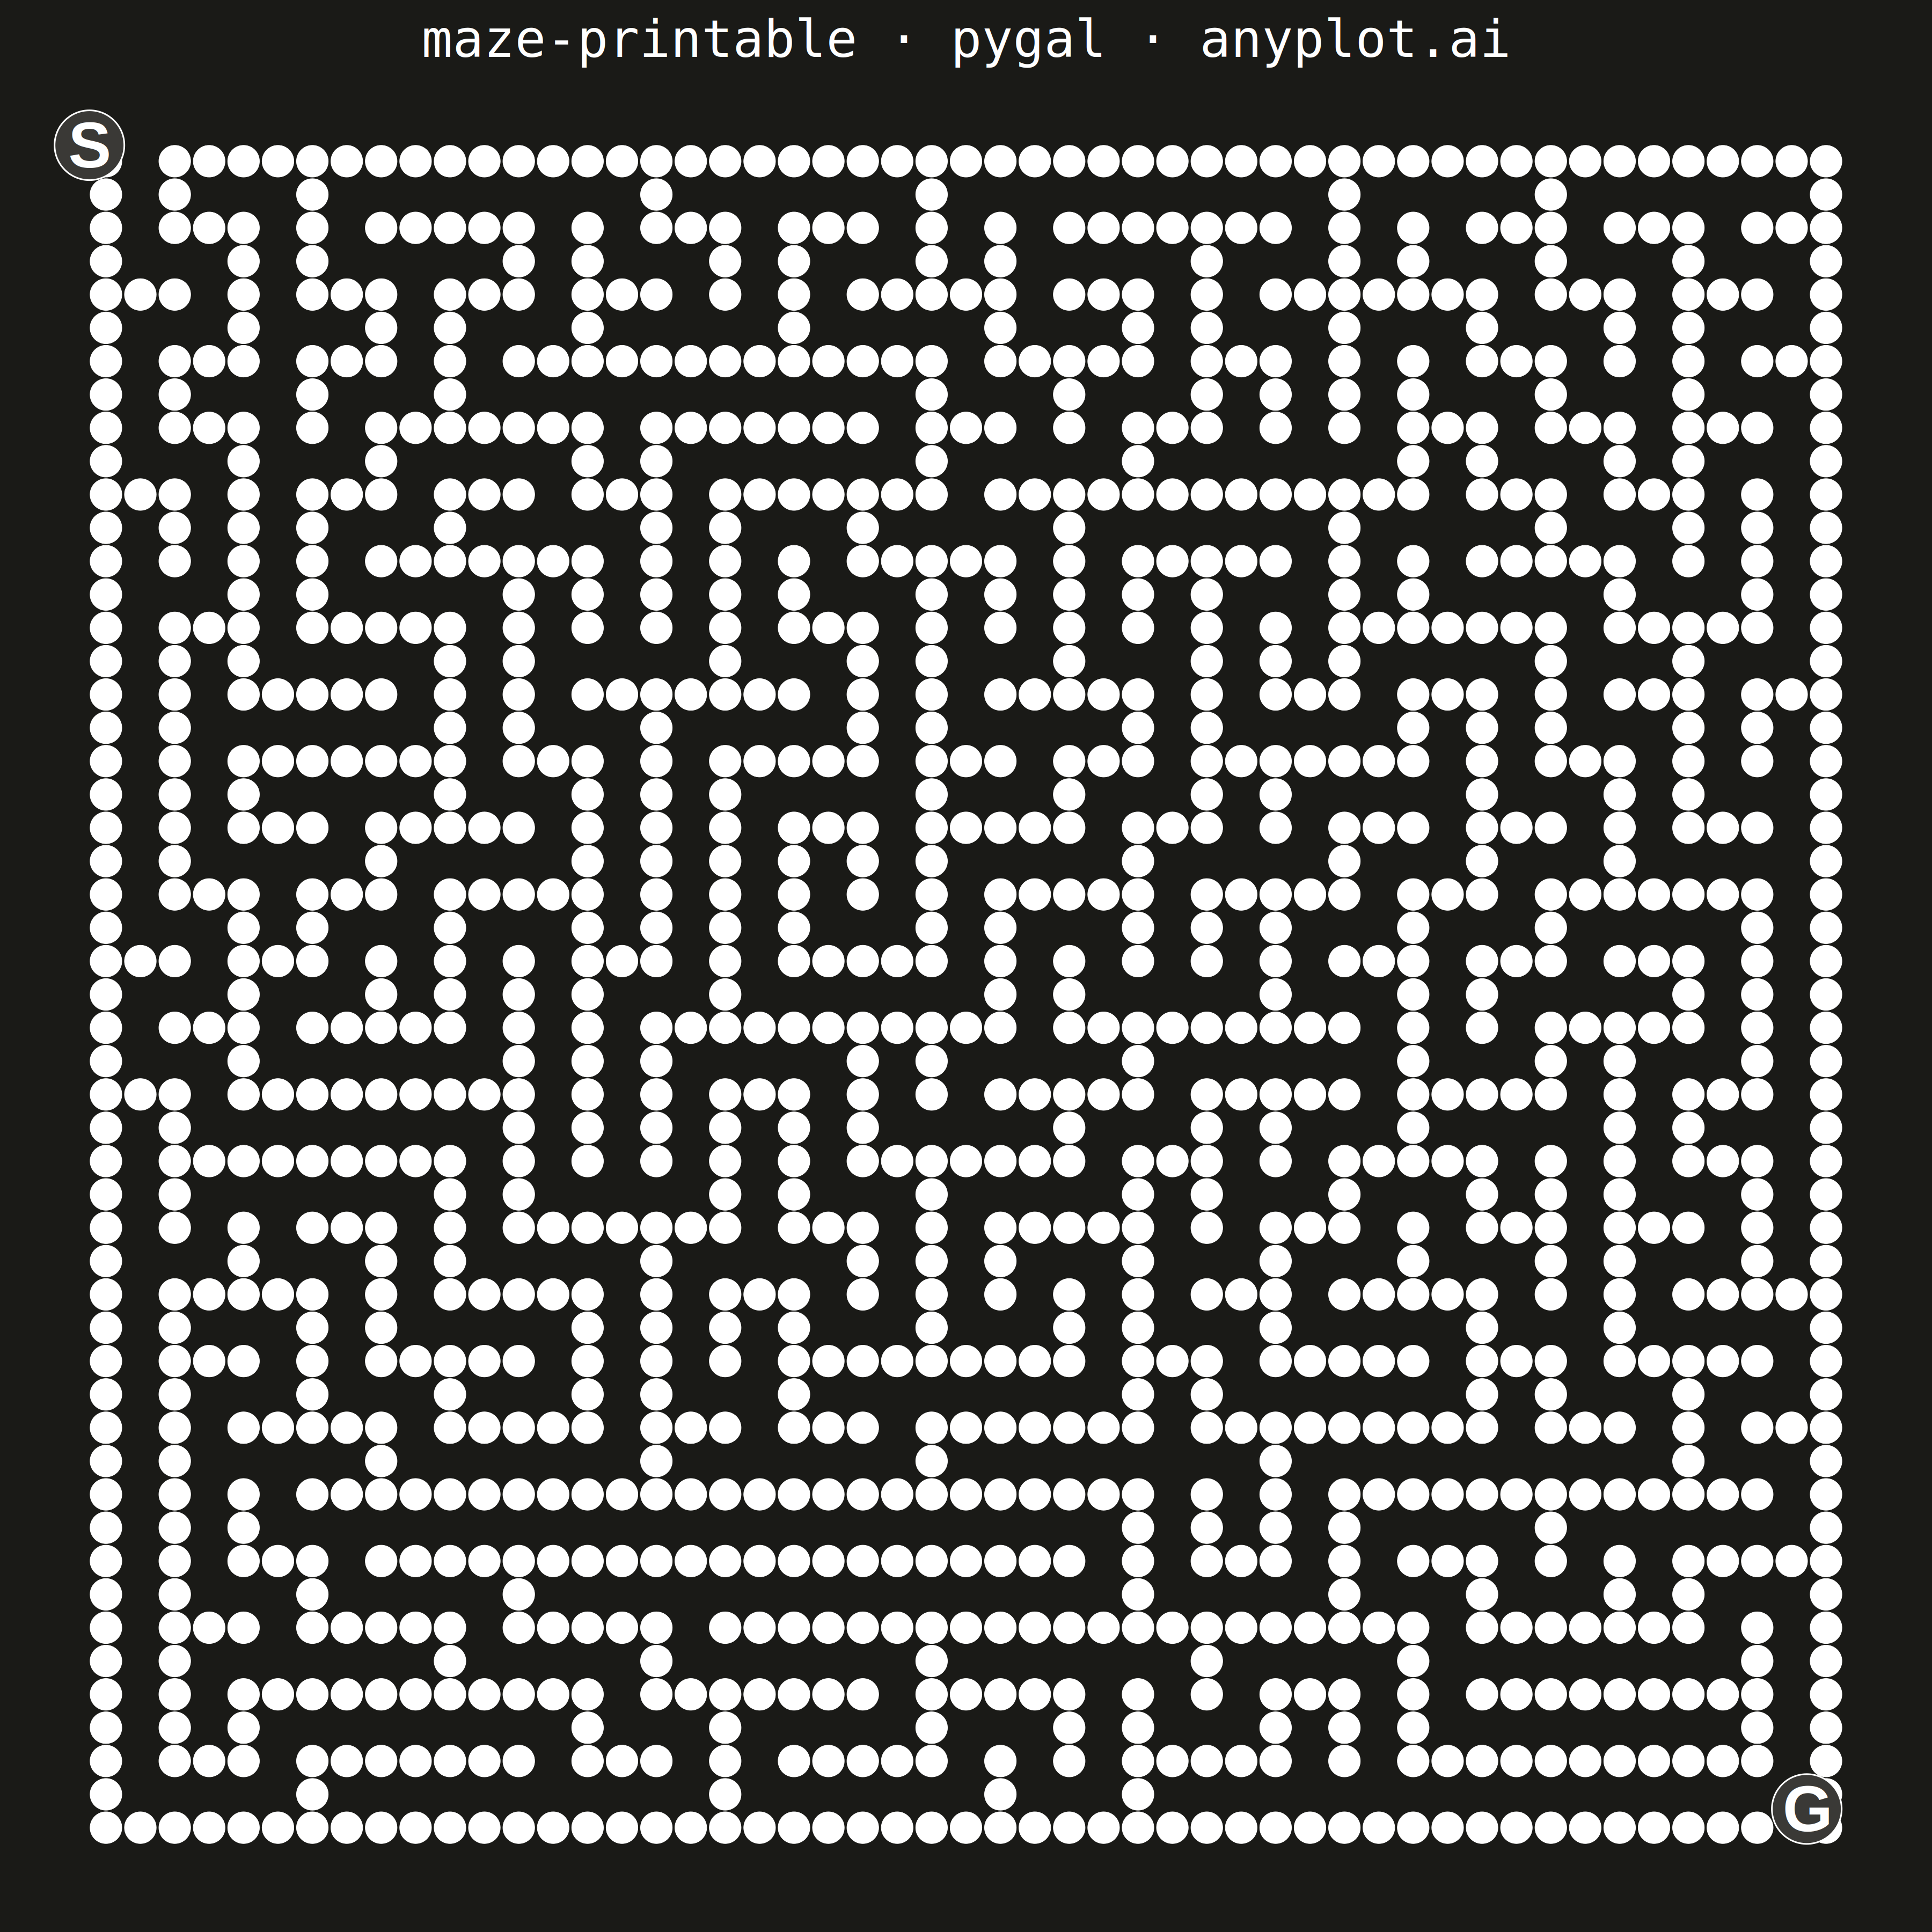
A rectangular maze puzzle visualization with clearly marked start and goal positions. The maze is algorithmically generated to guarantee exactly one solution path from start to finish. The clean black-and-white design is optimized for printing, allowing users to solve the puzzle with a pen or pencil.
""" anyplot.ai
maze-printable: Printable Maze Puzzle
Library: pygal 3.1.0 | Python 3.13.13
Quality: 87/100 | Updated: 2026-05-16
"""

import os
import re
import sys
from importlib import import_module


# Prevent module name conflict with pygal.py script
sys.path = [p for p in sys.path if "implementations" not in p]

import cairosvg
import numpy as np


pygal_module = import_module("pygal")
Style = import_module("pygal.style").Style

THEME = os.getenv("ANYPLOT_THEME", "light")

# Theme-adaptive colors for maze walls and background
if THEME == "light":
    PAGE_BG = "#FAF8F1"
    WALL_COLOR = "#000000"  # Black walls on light background (printable)
else:
    PAGE_BG = "#1A1A17"
    WALL_COLOR = "#FFFFFF"  # White walls on dark background

# Seed for reproducibility
np.random.seed(42)

# Maze dimensions (25x25 as specified in spec)
maze_width = 25
maze_height = 25

# Generate maze using DFS algorithm
# Each cell: 0 = wall, 1 = passage
grid_h = maze_height * 2 + 1
grid_w = maze_width * 2 + 1
maze = np.zeros((grid_h, grid_w), dtype=int)

# Initialize cells (passages between walls)
for y in range(maze_height):
    for x in range(maze_width):
        maze[y * 2 + 1, x * 2 + 1] = 1

# DFS maze generation
stack = [(0, 0)]
visited = set()
visited.add((0, 0))

directions = [(0, 1), (1, 0), (0, -1), (-1, 0)]

while stack:
    cx, cy = stack[-1]
    neighbors = []
    for dx, dy in directions:
        nx, ny = cx + dx, cy + dy
        if 0 <= nx < maze_width and 0 <= ny < maze_height and (nx, ny) not in visited:
            neighbors.append((nx, ny, dx, dy))

    if neighbors:
        idx = np.random.randint(len(neighbors))
        nx, ny, dx, dy = neighbors[idx]
        # Remove wall between current and neighbor
        maze[cy * 2 + 1 + dy, cx * 2 + 1 + dx] = 1
        visited.add((nx, ny))
        stack.append((nx, ny))
    else:
        stack.pop()

# Create entrance (top-left) and exit (bottom-right)
maze[0, 1] = 1  # Entrance at top
maze[grid_h - 1, grid_w - 2] = 1  # Exit at bottom

# Mark start and goal positions in the maze data
# Start: first cell after entrance (row 1, col 1)
start_y, start_x = 1, 1
# Goal: last cell before exit (row grid_h-2, col grid_w-2)
goal_y, goal_x = grid_h - 2, grid_w - 2

# All walls are the same color - create enough entries for each row
colors = tuple([WALL_COLOR] * grid_h)

# Custom style - clean for printability
custom_style = Style(
    background=PAGE_BG,
    plot_background=PAGE_BG,
    foreground=WALL_COLOR,
    foreground_strong=WALL_COLOR,
    foreground_subtle=WALL_COLOR,
    colors=colors,
    title_font_size=96,
    label_font_size=1,
    major_label_font_size=1,
    legend_font_size=1,
    value_font_size=1,
    font_family="monospace",
)

# Use Dot chart to create grid representation
chart = pygal_module.Dot(
    width=3600,
    height=3600,
    style=custom_style,
    title="maze-printable · pygal · anyplot.ai",
    show_legend=False,
    show_x_labels=False,
    show_y_labels=False,
    dots_size=32,
    margin=100,
)

# Add wall rows - walls show as dots, passages are empty
for y in range(grid_h):
    row_data = []
    for x in range(grid_w):
        if maze[y, x] == 0:  # Wall
            row_data.append(1)
        else:  # Passage
            row_data.append(None)
    chart.add("", row_data)

# First, create a helper chart with dots at start and goal positions to find exact coordinates
helper_chart = pygal_module.Dot(
    width=3600,
    height=3600,
    style=custom_style,
    title="maze-printable · pygal · anyplot.ai",
    show_legend=False,
    show_x_labels=False,
    show_y_labels=False,
    dots_size=32,
    margin=100,
)

# Add rows with dots only at start and goal positions
for y in range(grid_h):
    row_data = []
    for x in range(grid_w):
        if (x == start_x and y == start_y) or (x == goal_x and y == goal_y):
            row_data.append(1)
        else:
            row_data.append(None)
    helper_chart.add("", row_data)

# Extract circle positions from helper chart
helper_svg = helper_chart.render().decode("utf-8")
circles = re.findall(r'<circle[^>]*cx="([^"]+)"[^>]*cy="([^"]+)"', helper_svg)

# Get start and goal positions (first circle is start, second is goal)
# Note: pygal applies a transform to the plot group, so we need to add offsets
# The plot group has transform="translate(margin, title_area_height + margin)"
# margin = 100, title_area_height ~ 106 (based on title_font_size 96)
plot_x_offset = 100
plot_y_offset = 206  # Accounts for title area and margin

if len(circles) >= 2:
    s_x = float(circles[0][0]) + plot_x_offset
    s_y = float(circles[0][1]) + plot_y_offset
    g_x = float(circles[1][0]) + plot_x_offset
    g_y = float(circles[1][1]) + plot_y_offset
else:
    # Fallback positions
    s_x, s_y = 300, 400
    g_x, g_y = 3350, 3350

# Render the main maze chart
svg_string = chart.render().decode("utf-8")

# Create S and G text elements with bold styling - sized to fit within a cell
# Cell spacing is approximately 64px, so font-size of 50 fits well
s_marker = f'''<text x="{s_x}" y="{s_y}" font-family="Arial, sans-serif" font-size="50" font-weight="bold" fill="{WALL_COLOR}" text-anchor="middle" dominant-baseline="central">S</text>'''
g_marker = f'''<text x="{g_x}" y="{g_y}" font-family="Arial, sans-serif" font-size="50" font-weight="bold" fill="{WALL_COLOR}" text-anchor="middle" dominant-baseline="central">G</text>'''

# Insert markers before the closing </svg> tag
svg_with_markers = svg_string.replace("</svg>", f"{s_marker}\n{g_marker}\n</svg>")

# Use cairosvg to convert SVG to PNG
cairosvg.svg2png(bytestring=svg_with_markers.encode("utf-8"), write_to=f"plot-{THEME}.png")

# Also save HTML version with markers
html_template = f"""<?xml version="1.0" encoding="utf-8"?>
<!DOCTYPE html>
<html>
<head>
<meta charset="utf-8">
<title>maze-printable · pygal · anyplot.ai</title>
</head>
<body style="margin:0;padding:0;background:{PAGE_BG};">
{svg_with_markers}
</body>
</html>"""

with open(f"plot-{THEME}.html", "w", encoding="utf-8") as f:
    f.write(html_template)
Runnable source as JSON, for any HTTP client: https://api.anyplot.ai/specs/maze-printable/pygal/code. Any spec id and library id listed in llms-full.txt fit the same URL shape; every URL below is complete and callable.
{
  "spec_id": "maze-printable",
  "language": "python",
  "library": "pygal",
  "page": "https://anyplot.ai/maze-printable/python/pygal",
  "hub": "https://anyplot.ai/maze-printable",
  "code_json": "https://api.anyplot.ai/specs/maze-printable/pygal/code",
  "spec_json": "https://api.anyplot.ai/specs/maze-printable",
  "render_light_png": "https://storage.googleapis.com/anyplot-images/plots/maze-printable/python/pygal/plot-light.png",
  "render_dark_png": "https://storage.googleapis.com/anyplot-images/plots/maze-printable/python/pygal/plot-dark.png",
  "interactive_light_html": "https://storage.googleapis.com/anyplot-images/plots/maze-printable/python/pygal/plot-light.html",
  "interactive_dark_html": "https://storage.googleapis.com/anyplot-images/plots/maze-printable/python/pygal/plot-dark.html",
  "quality_score": 87.0,
  "license": "MIT",
  "guide": "https://anyplot.ai/llms.txt"
}
Part of Printable Maze Puzzle on anyplot.ai.