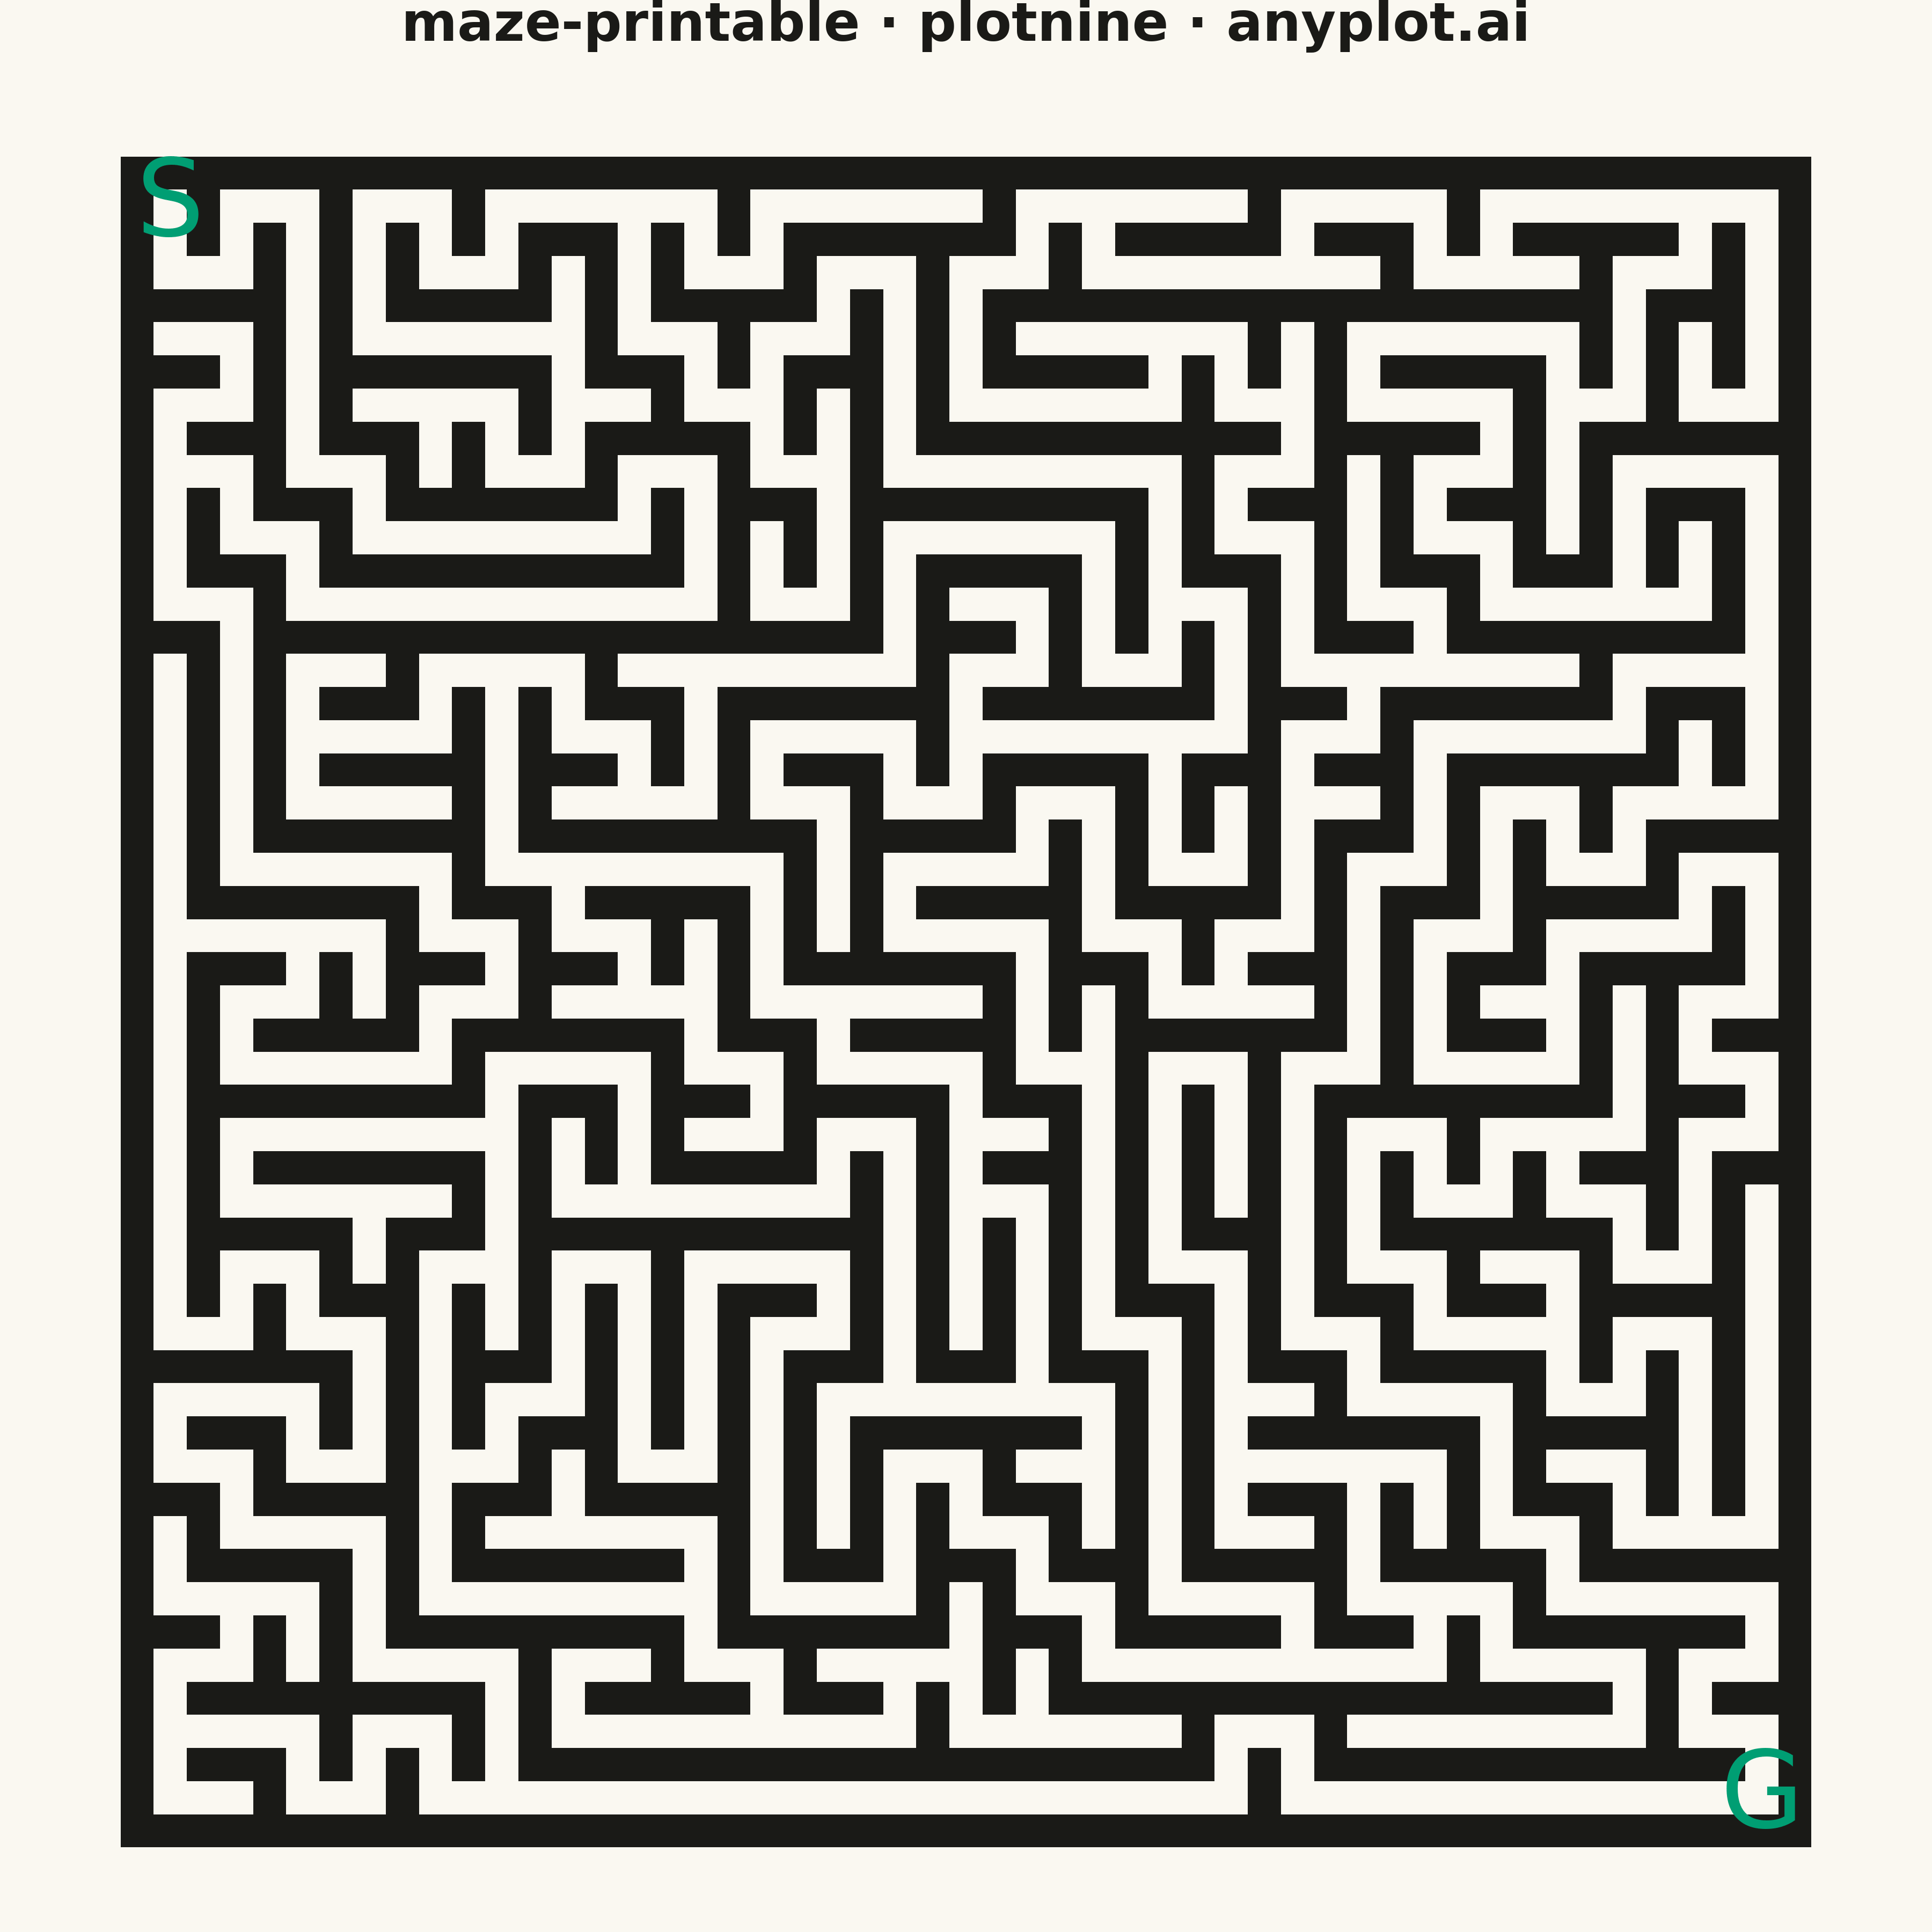
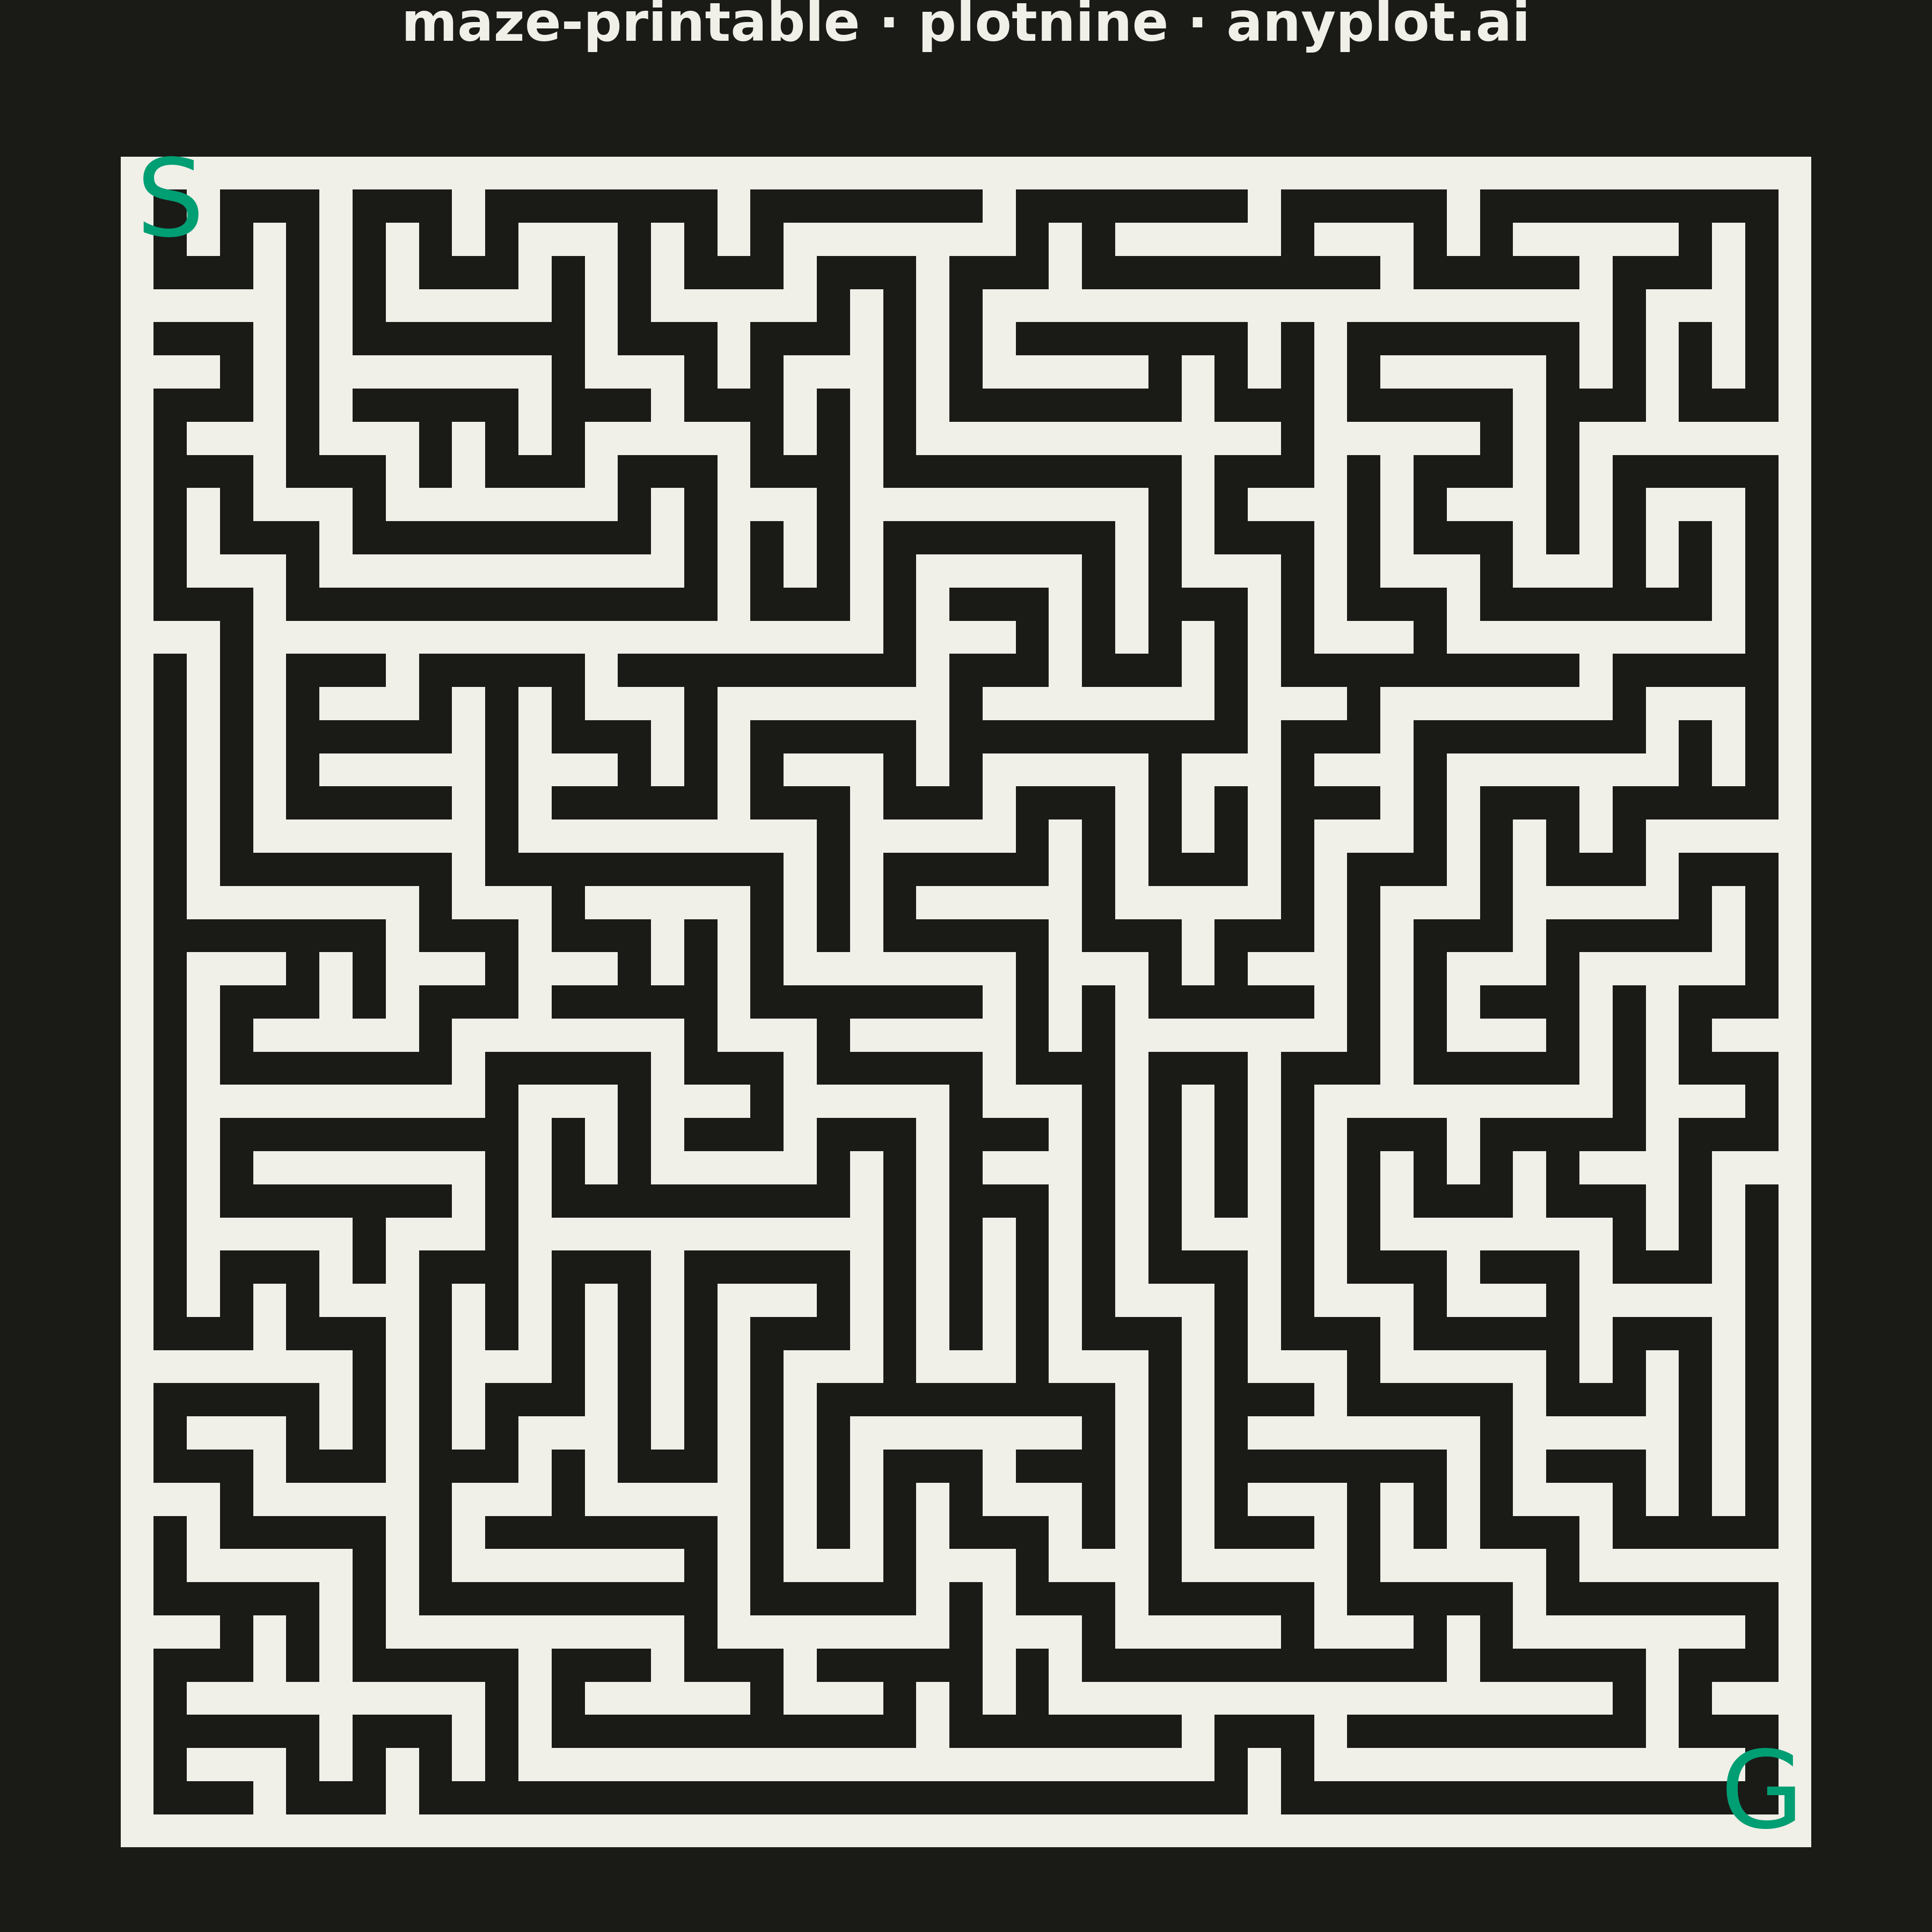
A rectangular maze puzzle visualization with clearly marked start and goal positions. The maze is algorithmically generated to guarantee exactly one solution path from start to finish. The clean black-and-white design is optimized for printing, allowing users to solve the puzzle with a pen or pencil.
""" anyplot.ai
maze-printable: Printable Maze Puzzle
Library: plotnine 0.15.4 | Python 3.13.13
Quality: 90/100 | Updated: 2026-05-16
"""

import os

import numpy as np
import pandas as pd
from plotnine import aes, coord_fixed, element_rect, element_text, geom_text, geom_tile, ggplot, labs, theme, theme_void


# Theme tokens
THEME = os.getenv("ANYPLOT_THEME", "light")
PAGE_BG = "#FAF8F1" if THEME == "light" else "#1A1A17"
INK = "#1A1A17" if THEME == "light" else "#F0EFE8"
BRAND = "#009E73"  # Okabe-Ito position 1

# Maze generation using Depth-First Search (Recursive Backtracker)
np.random.seed(42)
width, height = 25, 25

# Initialize maze grid (all walls)
# 0 = passage, 1 = wall
maze = np.ones((height * 2 + 1, width * 2 + 1), dtype=int)

# Starting cell (top-left)
start_cell = (1, 1)
maze[start_cell[0], start_cell[1]] = 0

# DFS maze generation
stack = [start_cell]
visited = {start_cell}

while stack:
    current = stack[-1]
    cy, cx = current

    # Find unvisited neighbors (2 cells away)
    neighbors = []
    for dy, dx in [(-2, 0), (2, 0), (0, -2), (0, 2)]:
        ny, nx = cy + dy, cx + dx
        if 1 <= ny < height * 2 and 1 <= nx < width * 2:
            if (ny, nx) not in visited:
                neighbors.append((ny, nx, dy // 2, dx // 2))

    if neighbors:
        # Choose random neighbor
        ny, nx, wy, wx = neighbors[np.random.randint(len(neighbors))]
        # Remove wall between current and neighbor
        maze[cy + wy, cx + wx] = 0
        maze[ny, nx] = 0
        visited.add((ny, nx))
        stack.append((ny, nx))
    else:
        stack.pop()

# Create DataFrame for plotting
rows = []
for y in range(maze.shape[0]):
    for x in range(maze.shape[1]):
        if maze[y, x] == 1:  # Wall
            rows.append({"x": x, "y": -y, "type": "wall"})

walls_df = pd.DataFrame(rows)

# Start and goal positions
start_y, start_x = 1, 1
goal_y, goal_x = height * 2 - 1, width * 2 - 1

markers_df = pd.DataFrame(
    {"x": [start_x, goal_x], "y": [-start_y, -goal_y], "label": ["S", "G"], "type": ["marker", "marker"]}
)

# Create the plot
plot = (
    ggplot()
    + geom_tile(data=walls_df, mapping=aes(x="x", y="y"), fill=INK, width=1, height=1)
    + geom_text(data=markers_df, mapping=aes(x="x", y="y", label="label"), size=48, color=BRAND)
    + coord_fixed(ratio=1)
    + labs(title="maze-printable · plotnine · anyplot.ai")
    + theme_void()
    + theme(
        figure_size=(12, 12),
        plot_title=element_text(size=24, ha="center", weight="bold", color=INK),
        plot_background=element_rect(fill=PAGE_BG, color=PAGE_BG),
        panel_background=element_rect(fill=PAGE_BG, color=PAGE_BG),
    )
)

# Save
plot.save(f"plot-{THEME}.png", dpi=300)
Runnable source as JSON, for any HTTP client: https://api.anyplot.ai/specs/maze-printable/plotnine/code. Any spec id and library id listed in llms-full.txt fit the same URL shape; every URL below is complete and callable.
{
  "spec_id": "maze-printable",
  "language": "python",
  "library": "plotnine",
  "page": "https://anyplot.ai/maze-printable/python/plotnine",
  "hub": "https://anyplot.ai/maze-printable",
  "code_json": "https://api.anyplot.ai/specs/maze-printable/plotnine/code",
  "spec_json": "https://api.anyplot.ai/specs/maze-printable",
  "render_light_png": "https://storage.googleapis.com/anyplot-images/plots/maze-printable/python/plotnine/plot-light.png",
  "render_dark_png": "https://storage.googleapis.com/anyplot-images/plots/maze-printable/python/plotnine/plot-dark.png",
  "quality_score": 90.0,
  "license": "MIT",
  "guide": "https://anyplot.ai/llms.txt"
}
Part of Printable Maze Puzzle on anyplot.ai.