The same plot in 14 other libraries — JavaScript: Chart.js, D3.js, Apache ECharts, Highcharts; Python: Altair, Bokeh, lets-plot, Matplotlib, Plotly, plotnine, Pygal, Seaborn; R: ggplot2; Julia: Makie.jl. Compare all 15 side by side: Printable Maze Puzzle in Python, R, Julia and JavaScript.
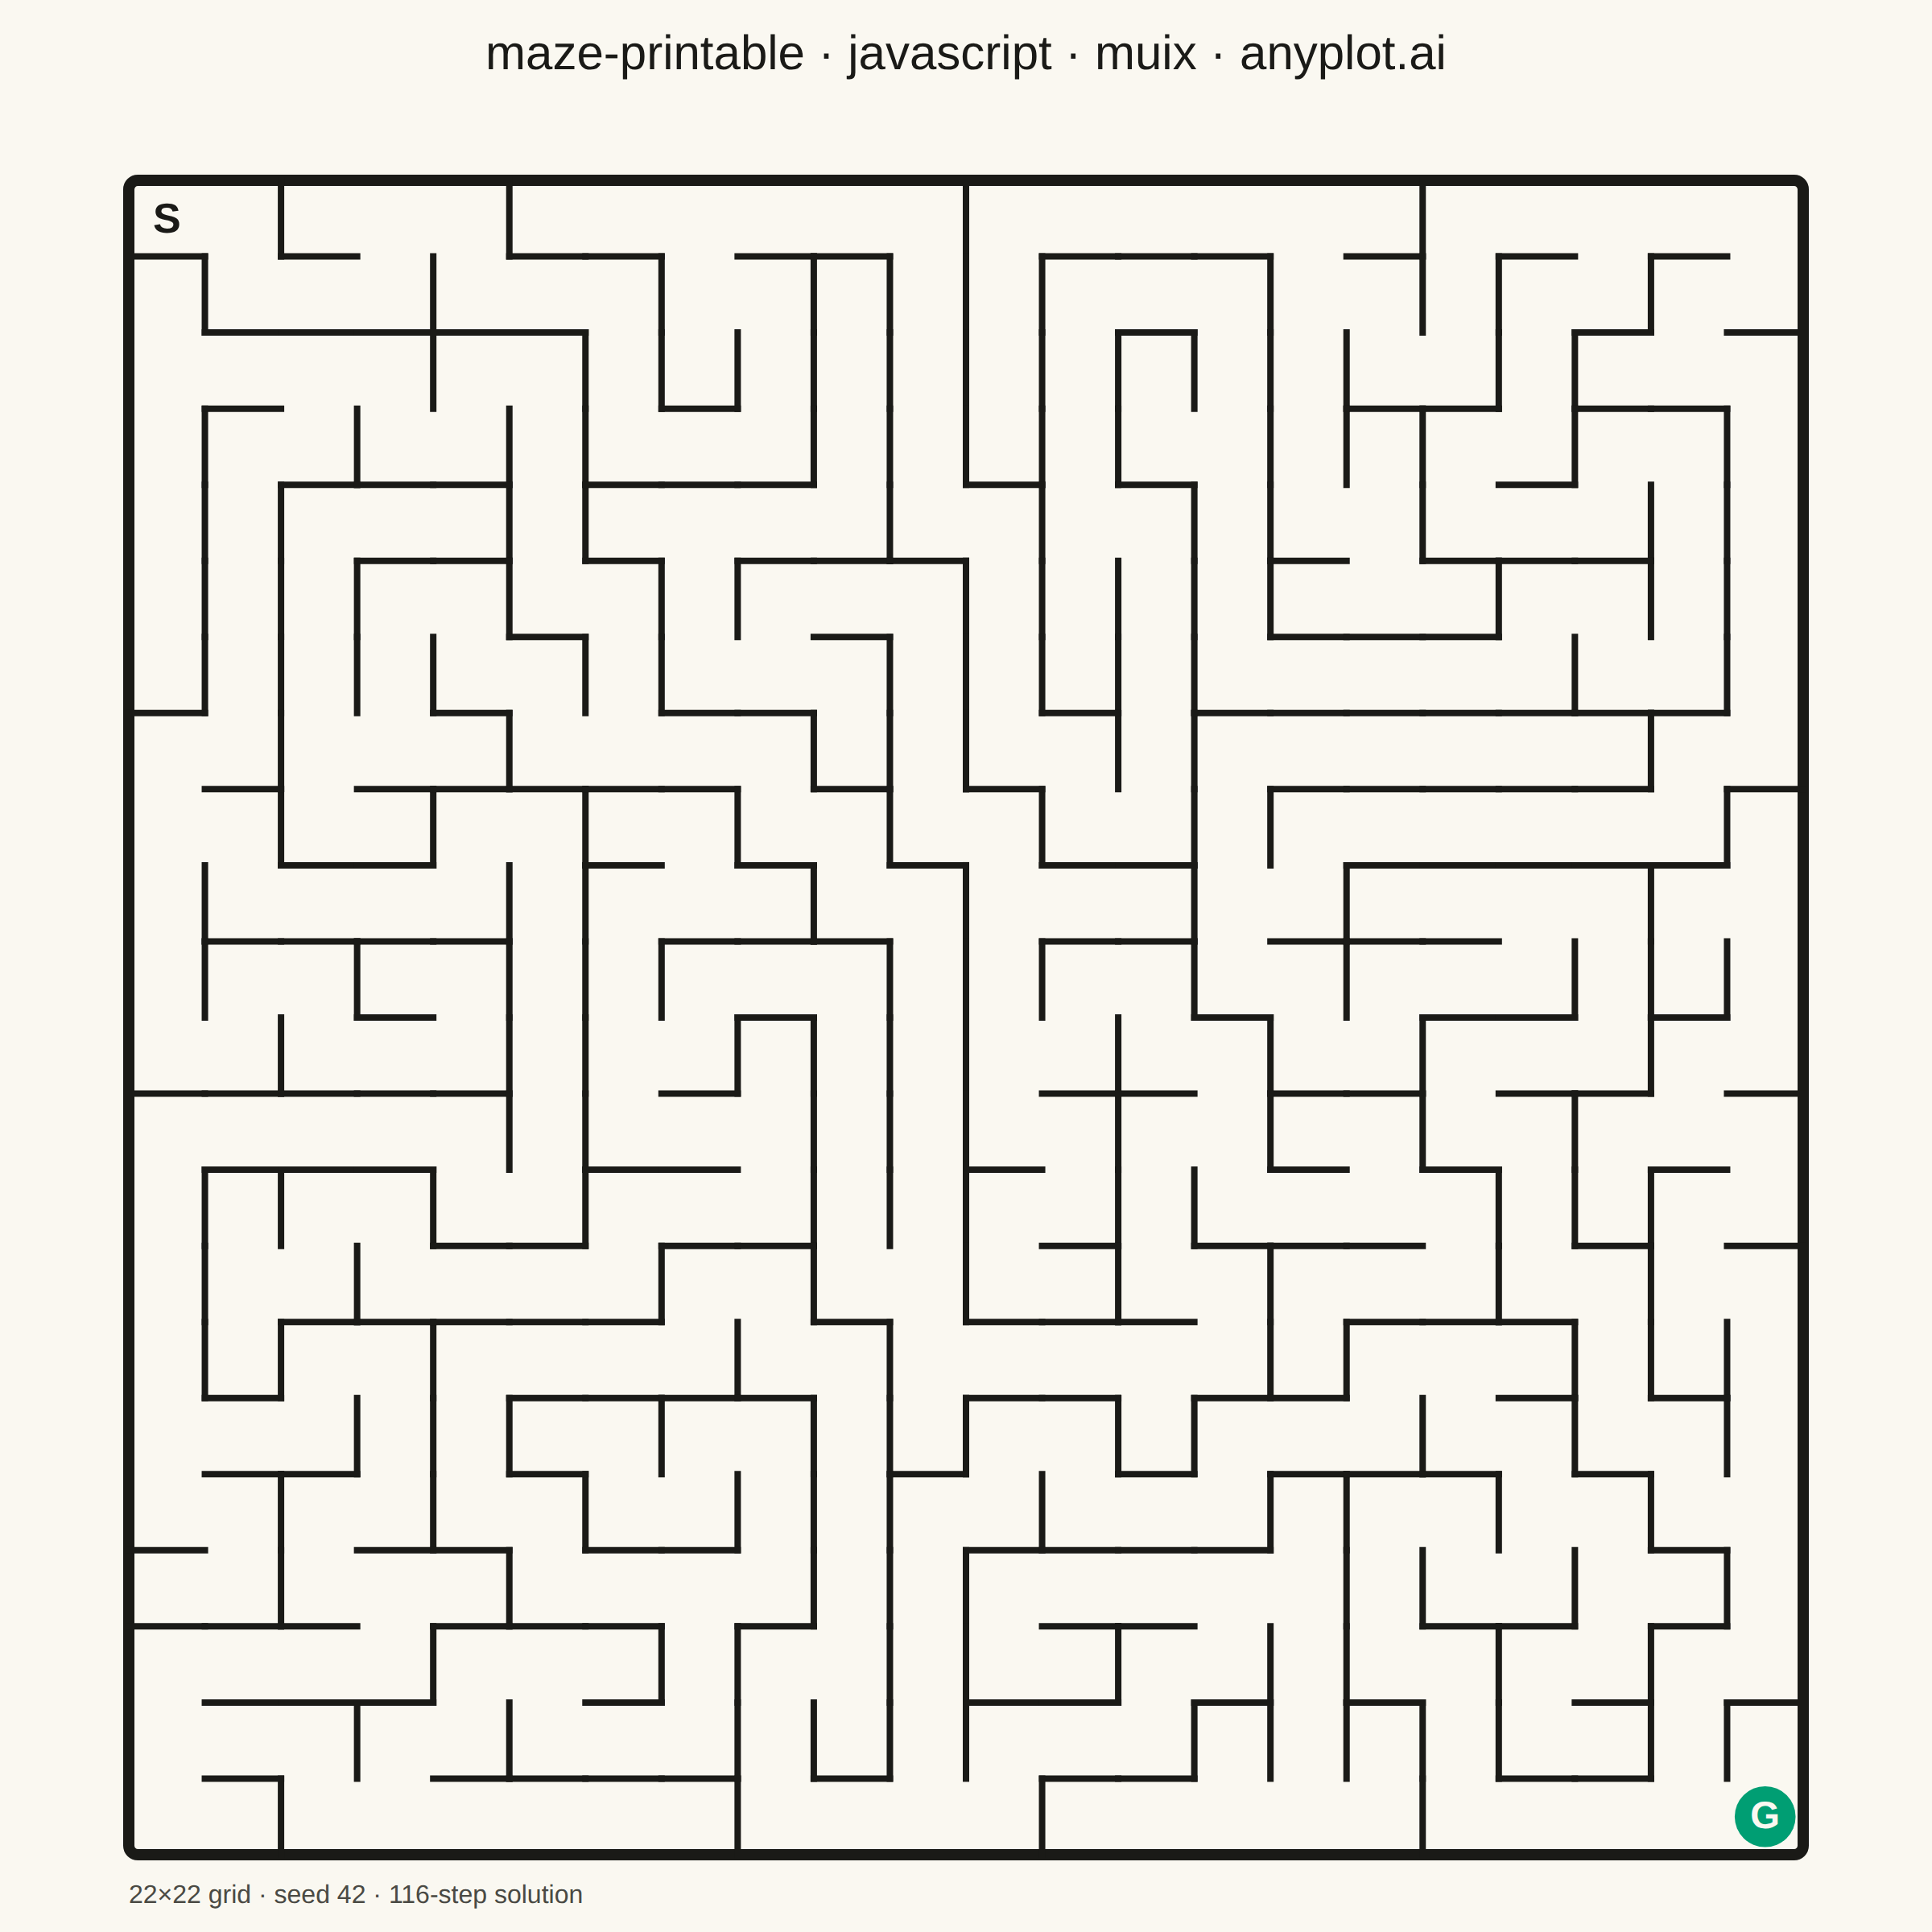
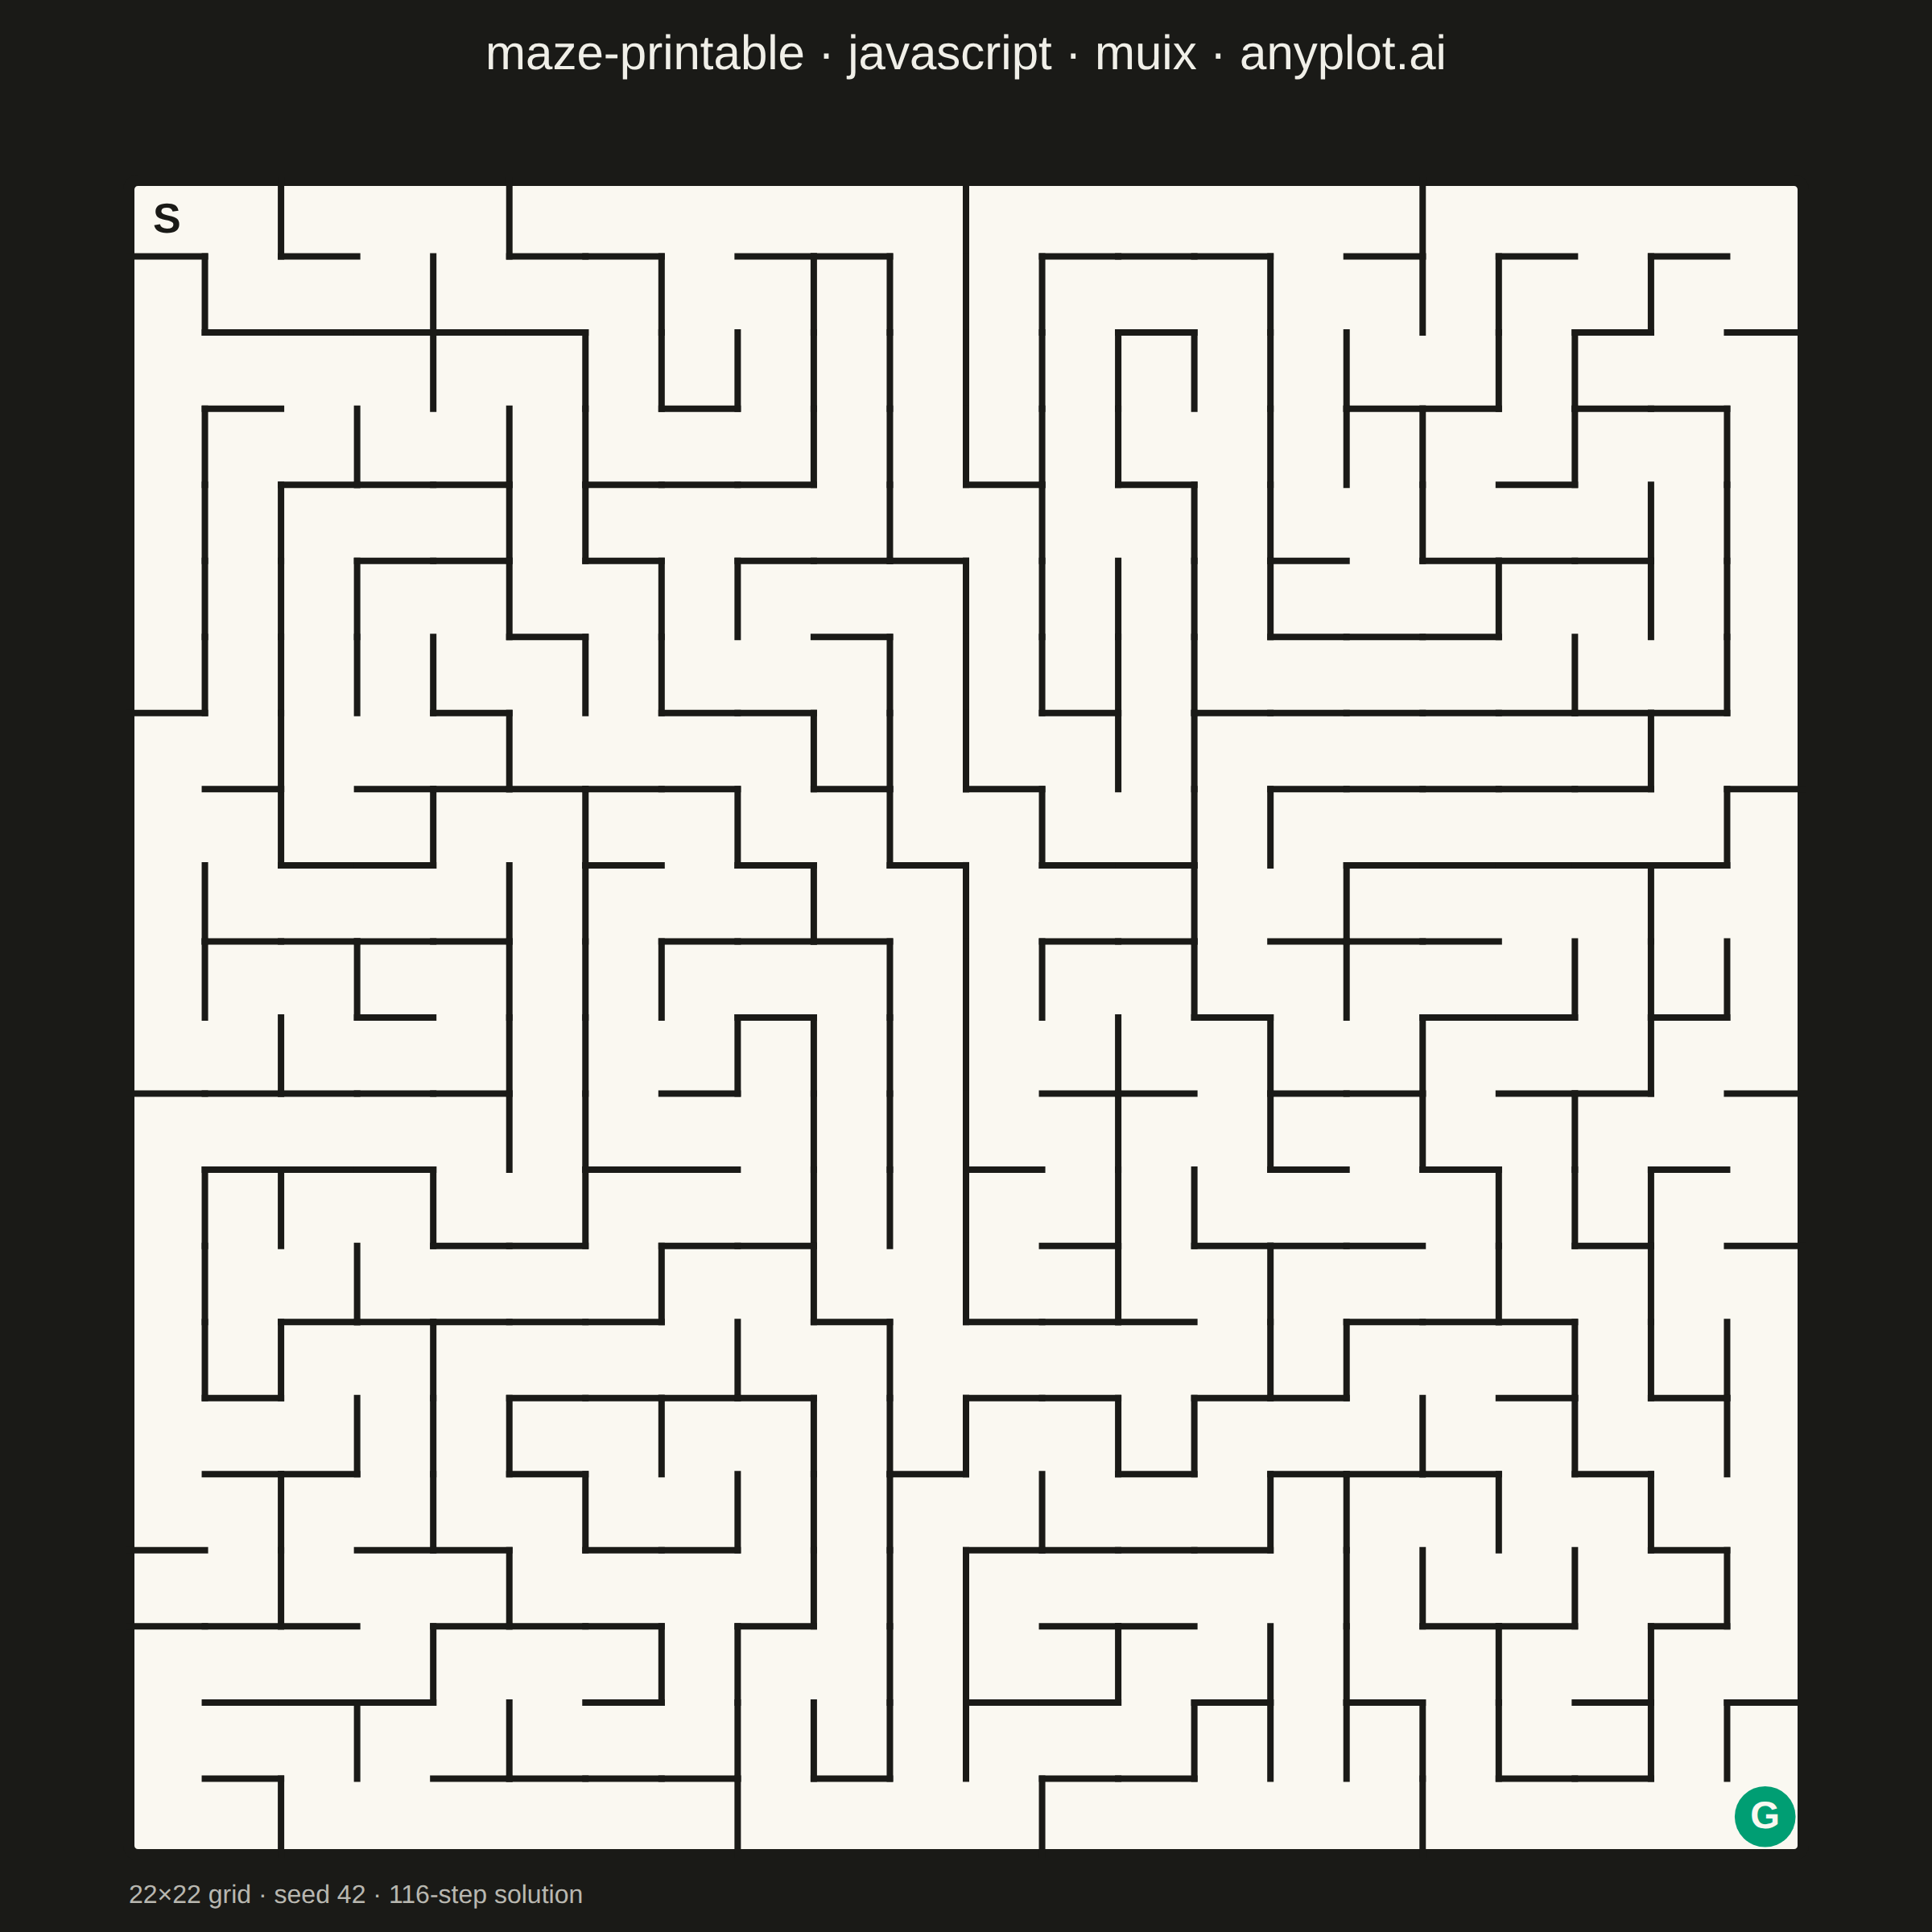
A rectangular maze puzzle visualization with clearly marked start and goal positions. The maze is algorithmically generated to guarantee exactly one solution path from start to finish. The clean black-and-white design is optimized for printing, allowing users to solve the puzzle with a pen or pencil.
// anyplot.ai
// maze-printable: Printable Maze Puzzle
// Library: muix 7.29.1 | JavaScript 22.23.2
// Quality: 88/100 | Created: 2026-09-05
//# anyplot-orientation: square
// anyplot.ai
// maze-printable: Printable Maze Puzzle
// Library: MUI X Charts | React | Node 22
// License: @mui/x-charts — MIT (community). Pro/Premium are out of scope.
// Quality: pending | Created: 2026-09-05

import Box from "@mui/material/Box";
import Typography from "@mui/material/Typography";
import { ScatterChart } from "@mui/x-charts/ScatterChart";
import { useDrawingArea } from "@mui/x-charts/hooks";

const t = window.ANYPLOT_TOKENS;

// The maze itself is a print artifact — "black walls on white background for
// maximum contrast and ink efficiency" per spec — so its ink/paper colors
// stay fixed across themes, same convention as the maze-circular muix
// implementation. Only the surrounding page and title follow ANYPLOT_THEME.
const PAPER = "#FAF8F1";
const INK = "#1A1A17";
const GOAL_GREEN = "#009E73";

// --- Deterministic PRNG (mulberry32) — the browser has no seeded RNG --------
function mulberry32(seed) {
  let a = seed;
  return function random() {
    a |= 0;
    a = (a + 0x6d2b79f5) | 0;
    let z = Math.imul(a ^ (a >>> 15), 1 | a);
    z = (z + Math.imul(z ^ (z >>> 7), 61 | z)) ^ z;
    return ((z ^ (z >>> 14)) >>> 0) / 4294967296;
  };
}

const rand = mulberry32(42);

// --- Maze topology: a ROWS x COLS grid, start top-left, goal bottom-right --
const ROWS = 22;
const COLS = 22;

const cellId = (r, c) => r * COLS + c;
const edgeKey = (a, b) => (a < b ? `${a}|${b}` : `${b}|${a}`);

function neighborsOf(r, c) {
  const result = [];
  if (r > 0) result.push([r - 1, c]);
  if (r < ROWS - 1) result.push([r + 1, c]);
  if (c > 0) result.push([r, c - 1]);
  if (c < COLS - 1) result.push([r, c + 1]);
  return result;
}

// Randomized depth-first search (recursive backtracker), run iteratively to
// avoid deep call stacks. Every carved passage links a visited cell to a
// brand-new one, so the carved edges form a spanning tree over the grid —
// exactly one path connects any two cells, including start and goal, which
// is what "guarantee exactly one solution" requires.
const passages = new Set();
const visited = new Set([cellId(0, 0)]);
const stack = [[0, 0]];
while (stack.length > 0) {
  const [r, c] = stack[stack.length - 1];
  const candidates = neighborsOf(r, c).filter(
    ([nr, nc]) => !visited.has(cellId(nr, nc)),
  );
  if (candidates.length === 0) {
    stack.pop();
    continue;
  }
  const [nr, nc] = candidates[Math.floor(rand() * candidates.length)];
  passages.add(edgeKey(cellId(r, c), cellId(nr, nc)));
  visited.add(cellId(nr, nc));
  stack.push([nr, nc]);
}

const isPassage = (r1, c1, r2, c2) =>
  passages.has(edgeKey(cellId(r1, c1), cellId(r2, c2)));

// Shortest path length over the spanning tree, i.e. THE solution length (the
// carved passages form a tree, so start->goal has exactly one route — no
// search heuristics needed, a plain BFS finds it). Reported in the footnote
// as a difficulty cue without ever drawing the path itself, so the puzzle
// stays unspoiled.
function solutionLength() {
  const startId = cellId(0, 0);
  const goalId = cellId(ROWS - 1, COLS - 1);
  const cameFrom = new Map([[startId, null]]);
  const queue = [startId];
  for (let head = 0; head < queue.length; head++) {
    const current = queue[head];
    if (current === goalId) break;
    const r = Math.floor(current / COLS);
    const c = current % COLS;
    for (const [nr, nc] of neighborsOf(r, c)) {
      const next = cellId(nr, nc);
      if (!cameFrom.has(next) && isPassage(r, c, nr, nc)) {
        cameFrom.set(next, current);
        queue.push(next);
      }
    }
  }
  let steps = 0;
  for (let node = goalId; node !== startId; steps++) {
    node = cameFrom.get(node);
  }
  return steps;
}

const SOLUTION_STEPS = solutionLength();

// --- Why ScatterChart (not LineChart/BarChart) hosts this maze --------------
// MUI X community has no grid-of-walls / graph-maze primitive, so some
// canvas-hosting workaround is unavoidable here. ScatterChart is deliberately
// the thinnest option: a single anonymous point satisfies its `series` prop
// with nothing left over to suppress, its axes take an explicit numeric
// domain (0..COLS / 0..ROWS) with no forced ticks or gridlines, and
// `useDrawingArea()` returns the exact inset rectangle MUI already computed
// for margins/aspect — so the maze inherits the chart's own responsive layout
// math for free. LineChart/BarChart would force a categorical or continuous
// axis with visible tick/gridline defaults that fight the print-artifact
// look and need more overrides to hide.
//
// Draws the whole puzzle as raw SVG paths sized off that drawing area — MUI X
// owns layout/scaling, the maze geometry is ours (same composition pattern as
// the maze-circular muix implementation).
function MazeMark() {
  const { left, top, width, height } = useDrawingArea();
  const cellSize = Math.min(width / COLS, height / ROWS);
  const mazeWidth = cellSize * COLS;
  const mazeHeight = cellSize * ROWS;
  const originX = left + (width - mazeWidth) / 2;
  const originY = top + (height - mazeHeight) / 2;
  const px = (c) => originX + c * cellSize;
  const py = (r) => originY + r * cellSize;

  const walls = [];
  for (let r = 0; r < ROWS; r++) {
    for (let c = 0; c < COLS - 1; c++) {
      if (!isPassage(r, c, r, c + 1)) {
        const x = px(c + 1);
        walls.push(`M ${x} ${py(r)} L ${x} ${py(r + 1)}`);
      }
    }
  }
  for (let r = 0; r < ROWS - 1; r++) {
    for (let c = 0; c < COLS; c++) {
      if (!isPassage(r, c, r + 1, c)) {
        const y = py(r + 1);
        walls.push(`M ${px(c)} ${y} L ${px(c + 1)} ${y}`);
      }
    }
  }

  // Border noticeably heavier than the interior walls: a clear weight
  // hierarchy (frame > corridor) instead of one uniform line thickness, and
  // both are sized up from a flat pixel constant to scale with the cell so
  // the puzzle still reads at small thumbnail sizes.
  const wallStroke = Math.max(4, cellSize * 0.075);
  const borderStroke = wallStroke * 1.75;
  const borderRadius = cellSize * 0.12;

  return (
    <g>
      <rect
        x={originX}
        y={originY}
        width={mazeWidth}
        height={mazeHeight}
        fill={PAPER}
        stroke={INK}
        strokeWidth={borderStroke}
        rx={borderRadius}
        ry={borderRadius}
      />
      {walls.map((d, i) => (
        <path
          key={i}
          d={d}
          stroke={INK}
          strokeWidth={wallStroke}
          strokeLinecap="square"
          fill="none"
        />
      ))}
      <text
        x={px(0.5)}
        y={py(0.5)}
        fontSize={cellSize * 0.55}
        fontWeight={700}
        fill={INK}
        textAnchor="middle"
        dominantBaseline="central"
      >
        S
      </text>
      <circle
        cx={px(COLS - 0.5)}
        cy={py(ROWS - 0.5)}
        r={cellSize * 0.4}
        fill={GOAL_GREEN}
      />
      <text
        x={px(COLS - 0.5)}
        y={py(ROWS - 0.5)}
        fontSize={cellSize * 0.5}
        fontWeight={700}
        fill={PAPER}
        textAnchor="middle"
        dominantBaseline="central"
      >
        G
      </text>
      {/* Outside the paper card, on the page background, so — unlike the
          fixed ink/paper maze above it — this footnote must follow
          ANYPLOT_THEME or it goes invisible on the dark page. */}
      <text
        x={originX}
        y={originY + mazeHeight + 30}
        fontSize={16}
        fill={t.inkSoft}
        textAnchor="start"
      >
        {ROWS}×{COLS} grid · seed 42 · {SOLUTION_STEPS}-step solution
      </text>
    </g>
  );
}

const TITLE = "maze-printable · javascript · muix · anyplot.ai";
const TITLE_HEIGHT = 64;

export default function Chart() {
  const { width, height } = window.ANYPLOT_SIZE;
  const chartHeight = height - TITLE_HEIGHT;
  const margin = 48;

  return (
    <Box
      sx={{
        width,
        height,
        bgcolor: t.pageBg,
        display: "flex",
        flexDirection: "column",
      }}
    >
      <Typography
        sx={{
          color: t.ink,
          fontSize: 30,
          fontWeight: 500,
          textAlign: "center",
          lineHeight: 1.2,
          pt: "16px",
          height: TITLE_HEIGHT,
          fontFamily: "inherit",
        }}
      >
        {TITLE}
      </Typography>
      <Box
        sx={{
          flex: 1,
          display: "flex",
          alignItems: "center",
          justifyContent: "center",
        }}
      >
        <ScatterChart
          width={width}
          height={chartHeight}
          skipAnimation
          disableVoronoi
          series={[
            { id: "maze", type: "scatter", data: [{ x: 0, y: 0, id: "c" }] },
          ]}
          xAxis={[
            {
              scaleType: "linear",
              min: 0,
              max: COLS,
              disableTicks: true,
              disableLine: true,
            },
          ]}
          yAxis={[
            {
              scaleType: "linear",
              min: 0,
              max: ROWS,
              disableTicks: true,
              disableLine: true,
            },
          ]}
          topAxis={null}
          bottomAxis={null}
          leftAxis={null}
          rightAxis={null}
          margin={{ top: margin, bottom: margin, left: margin, right: margin }}
          slots={{ scatter: MazeMark }}
          slotProps={{ legend: { hidden: true } }}
        />
      </Box>
    </Box>
  );
}
Runnable source as JSON, for any HTTP client: https://api.anyplot.ai/specs/maze-printable/muix/code. Any spec id and library id listed in llms-full.txt fit the same URL shape; every URL below is complete and callable.
{
  "spec_id": "maze-printable",
  "language": "javascript",
  "library": "muix",
  "page": "https://anyplot.ai/maze-printable/javascript/muix",
  "hub": "https://anyplot.ai/maze-printable",
  "code_json": "https://api.anyplot.ai/specs/maze-printable/muix/code",
  "spec_json": "https://api.anyplot.ai/specs/maze-printable",
  "render_light_png": "https://storage.googleapis.com/anyplot-images/plots/maze-printable/javascript/muix/plot-light.png",
  "render_dark_png": "https://storage.googleapis.com/anyplot-images/plots/maze-printable/javascript/muix/plot-dark.png",
  "interactive_light_html": "https://storage.googleapis.com/anyplot-images/plots/maze-printable/javascript/muix/plot-light.html",
  "interactive_dark_html": "https://storage.googleapis.com/anyplot-images/plots/maze-printable/javascript/muix/plot-dark.html",
  "quality_score": 88.0,
  "license": "MIT",
  "guide": "https://anyplot.ai/llms.txt"
}
Part of Printable Maze Puzzle on anyplot.ai.