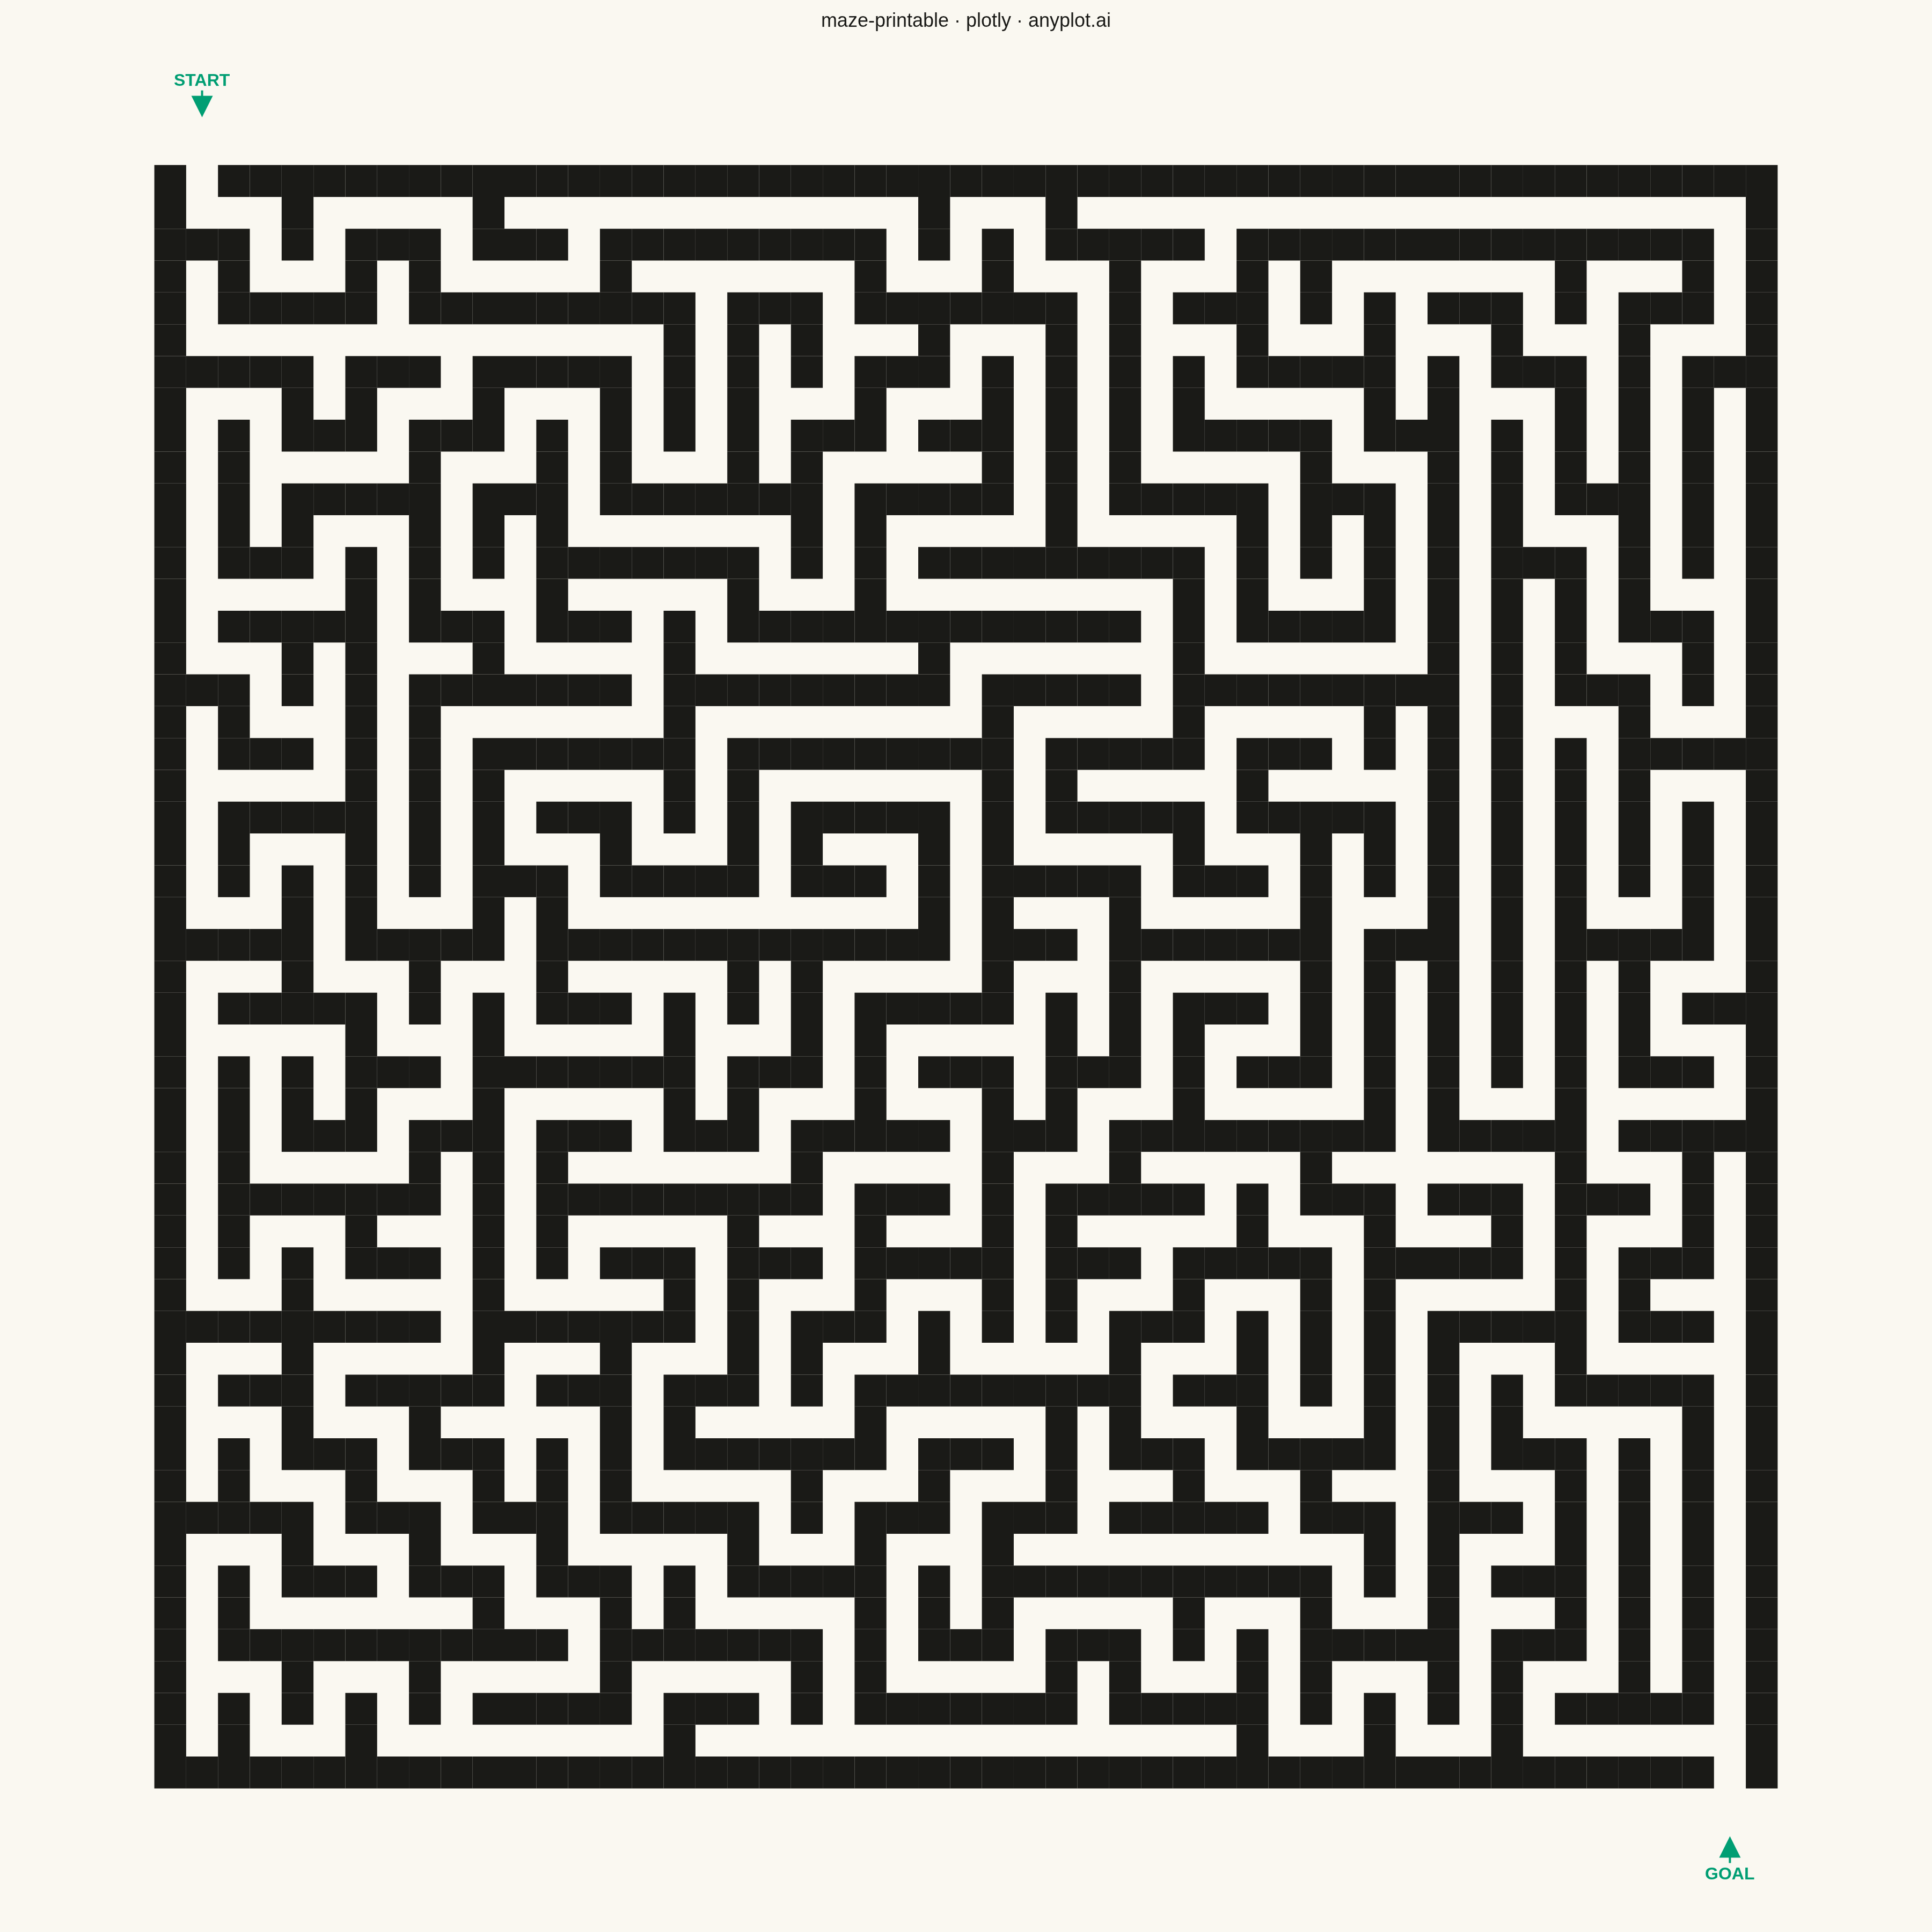
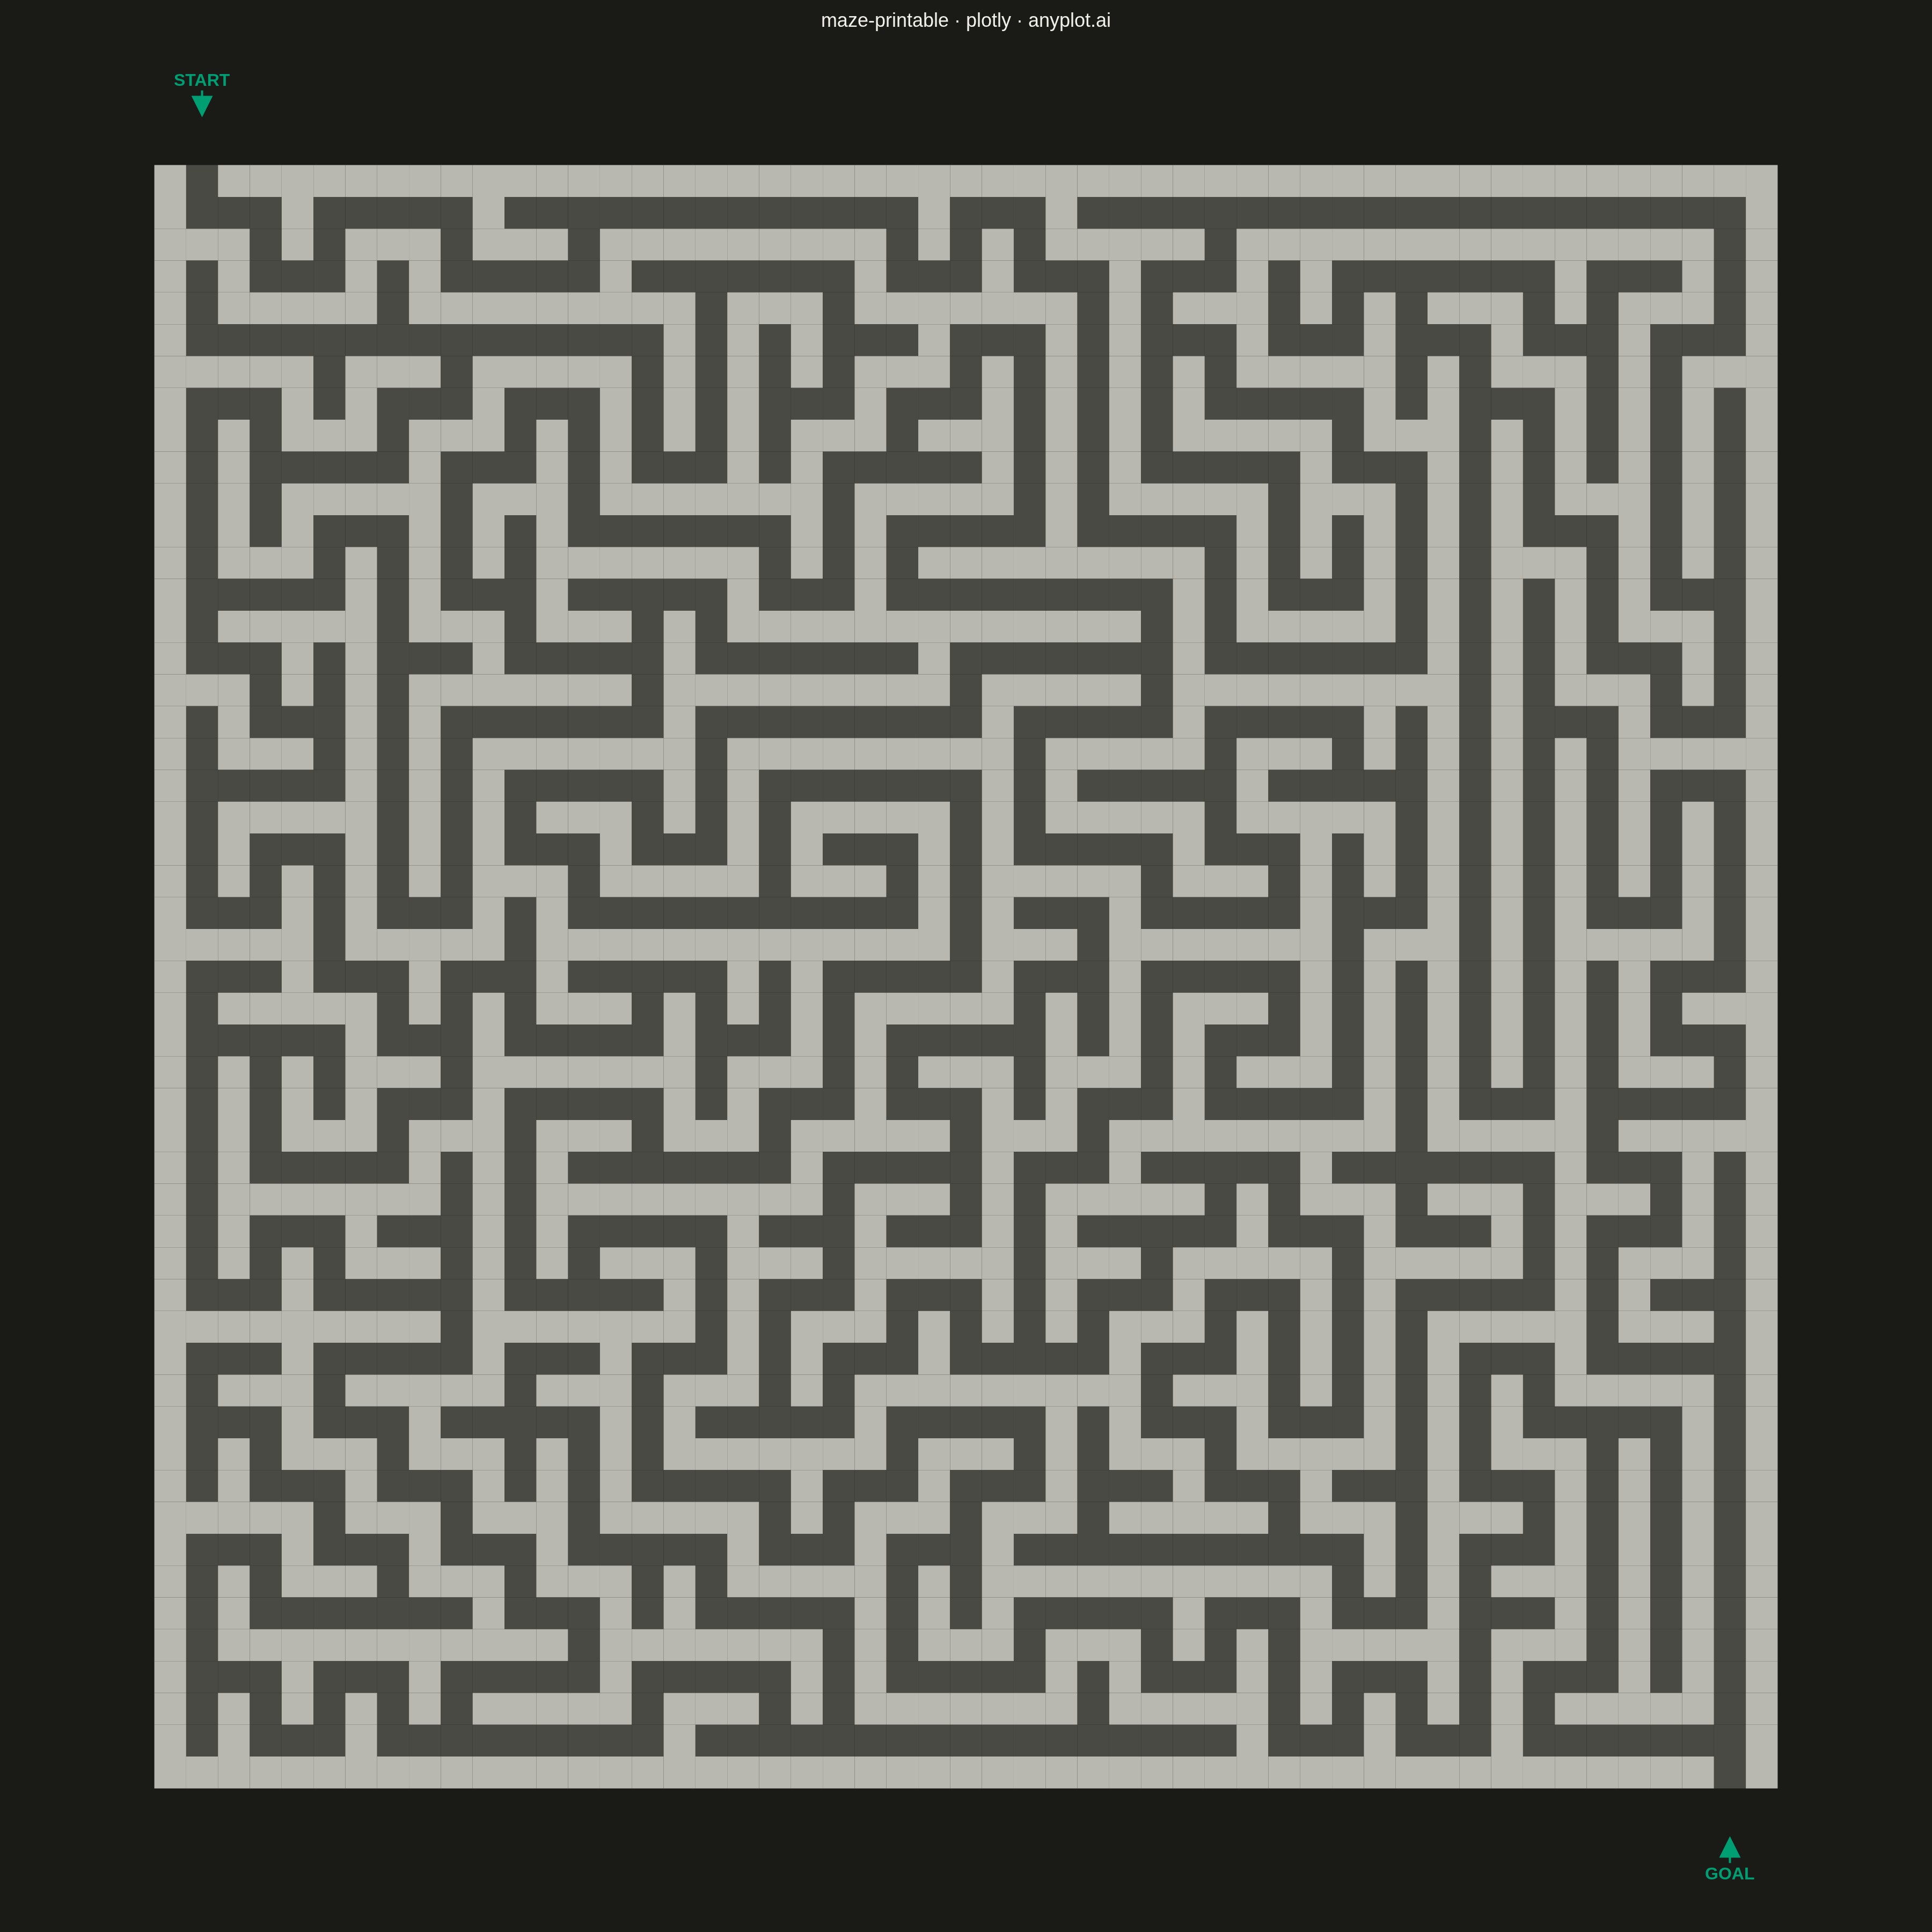
A rectangular maze puzzle visualization with clearly marked start and goal positions. The maze is algorithmically generated to guarantee exactly one solution path from start to finish. The clean black-and-white design is optimized for printing, allowing users to solve the puzzle with a pen or pencil.
""" anyplot.ai
maze-printable: Printable Maze Puzzle
Library: plotly 6.7.0 | Python 3.13.13
Quality: 85/100 | Updated: 2026-05-16
"""

import os

import numpy as np
import plotly.graph_objects as go


# Theme tokens
THEME = os.getenv("ANYPLOT_THEME", "light")
PAGE_BG = "#FAF8F1" if THEME == "light" else "#1A1A17"
INK = "#1A1A17" if THEME == "light" else "#F0EFE8"
INK_SOFT = "#4A4A44" if THEME == "light" else "#B8B7B0"
BRAND = "#009E73"  # Okabe-Ito position 1

# Maze generation parameters
np.random.seed(42)
width = 25
height = 25

# Initialize maze grid (True = wall, False = passage)
# Using cells and walls representation
maze = np.ones((2 * height + 1, 2 * width + 1), dtype=bool)

# Mark all cells as passages initially (odd indices)
for y in range(height):
    for x in range(width):
        maze[2 * y + 1, 2 * x + 1] = False

# DFS maze generation algorithm
visited = np.zeros((height, width), dtype=bool)
stack = [(0, 0)]
visited[0, 0] = True

directions = [(0, 1), (1, 0), (0, -1), (-1, 0)]  # right, down, left, up

while stack:
    cy, cx = stack[-1]

    # Find unvisited neighbors
    neighbors = []
    for dy, dx in directions:
        ny, nx = cy + dy, cx + dx
        if 0 <= ny < height and 0 <= nx < width and not visited[ny, nx]:
            neighbors.append((ny, nx, dy, dx))

    if neighbors:
        # Choose random neighbor
        ny, nx, dy, dx = neighbors[np.random.randint(len(neighbors))]
        # Remove wall between current cell and neighbor
        maze[2 * cy + 1 + dy, 2 * cx + 1 + dx] = False
        visited[ny, nx] = True
        stack.append((ny, nx))
    else:
        stack.pop()

# Create entrance (top of first cell) and exit (bottom of last cell)
maze[0, 1] = False  # Entrance opening at top-left
maze[2 * height, 2 * width - 1] = False  # Exit opening at bottom-right

# Create figure
fig = go.Figure()

# Theme-specific colors for maze elements
if THEME == "light":
    # Light theme: black walls on white background (printable)
    wall_color = INK
    passage_color = None  # Passages implicit as white background
else:
    # Dark theme: explicitly draw passages as medium gray for visibility
    wall_color = INK_SOFT  # Light gray walls
    passage_color = "#4A4A44"  # Medium gray passages (distinct from dark bg and light walls)

# Draw maze elements as shapes
wall_shapes = []

for y in range(maze.shape[0]):
    for x in range(maze.shape[1]):
        if maze[y, x]:  # Wall
            wall_shapes.append(
                {
                    "type": "rect",
                    "x0": x - 0.5,
                    "y0": (maze.shape[0] - 1 - y) - 0.5,
                    "x1": x + 0.5,
                    "y1": (maze.shape[0] - 1 - y) + 0.5,
                    "fillcolor": wall_color,
                    "line": {"width": 0},
                }
            )
        elif THEME == "dark" and passage_color:  # Passage in dark theme
            wall_shapes.append(
                {
                    "type": "rect",
                    "x0": x - 0.5,
                    "y0": (maze.shape[0] - 1 - y) - 0.5,
                    "x1": x + 0.5,
                    "y1": (maze.shape[0] - 1 - y) + 0.5,
                    "fillcolor": passage_color,
                    "line": {"width": 0},
                }
            )

# Add start marker "START" above entrance opening with arrow pointing down
start_x = 1  # Entrance column in maze coordinates
start_y = maze.shape[0] - 1 - 0  # Top row (entrance)

fig.add_annotation(
    x=start_x,
    y=start_y + 2,  # Position above the maze
    text="<b>START</b>",
    font={"size": 32, "color": BRAND},
    showarrow=True,
    arrowhead=2,
    arrowsize=2,
    arrowwidth=4,
    arrowcolor=BRAND,
    ay=-50,  # Arrow points down
    ax=0,
    yanchor="bottom",
)

# Add goal marker "GOAL" below exit opening with arrow pointing up
goal_x = maze.shape[1] - 2  # Exit column in maze coordinates
goal_y = 0  # Bottom row (exit)

fig.add_annotation(
    x=goal_x,
    y=goal_y - 2,  # Position below the maze
    text="<b>GOAL</b>",
    font={"size": 32, "color": BRAND},
    showarrow=True,
    arrowhead=2,
    arrowsize=2,
    arrowwidth=4,
    arrowcolor=BRAND,
    ay=50,  # Arrow points up
    ax=0,
    yanchor="top",
)

# Update layout
fig.update_layout(
    title={
        "text": "maze-printable · plotly · anyplot.ai",
        "font": {"size": 36, "color": INK},
        "x": 0.5,
        "xanchor": "center",
    },
    shapes=wall_shapes,
    xaxis={
        "showgrid": False,
        "zeroline": False,
        "showticklabels": False,
        "scaleanchor": "y",
        "scaleratio": 1,
        "range": [-3, maze.shape[1] + 2],
        "showline": False,
    },
    yaxis={
        "showgrid": False,
        "zeroline": False,
        "showticklabels": False,
        "range": [-4, maze.shape[0] + 3],
        "showline": False,
    },
    plot_bgcolor=PAGE_BG,
    paper_bgcolor=PAGE_BG,
    margin={"l": 60, "r": 60, "t": 100, "b": 60},
    width=3600,
    height=3600,
)

# Save as PNG and HTML
fig.write_image(f"plot-{THEME}.png", width=3600, height=3600, scale=1)
fig.write_html(f"plot-{THEME}.html", include_plotlyjs="cdn")
Runnable source as JSON, for any HTTP client: https://api.anyplot.ai/specs/maze-printable/plotly/code. Any spec id and library id listed in llms-full.txt fit the same URL shape; every URL below is complete and callable.
{
  "spec_id": "maze-printable",
  "language": "python",
  "library": "plotly",
  "page": "https://anyplot.ai/maze-printable/python/plotly",
  "hub": "https://anyplot.ai/maze-printable",
  "code_json": "https://api.anyplot.ai/specs/maze-printable/plotly/code",
  "spec_json": "https://api.anyplot.ai/specs/maze-printable",
  "render_light_png": "https://storage.googleapis.com/anyplot-images/plots/maze-printable/python/plotly/plot-light.png",
  "render_dark_png": "https://storage.googleapis.com/anyplot-images/plots/maze-printable/python/plotly/plot-dark.png",
  "interactive_light_html": "https://storage.googleapis.com/anyplot-images/plots/maze-printable/python/plotly/plot-light.html",
  "interactive_dark_html": "https://storage.googleapis.com/anyplot-images/plots/maze-printable/python/plotly/plot-dark.html",
  "quality_score": 85.0,
  "license": "MIT",
  "guide": "https://anyplot.ai/llms.txt"
}
Part of Printable Maze Puzzle on anyplot.ai.