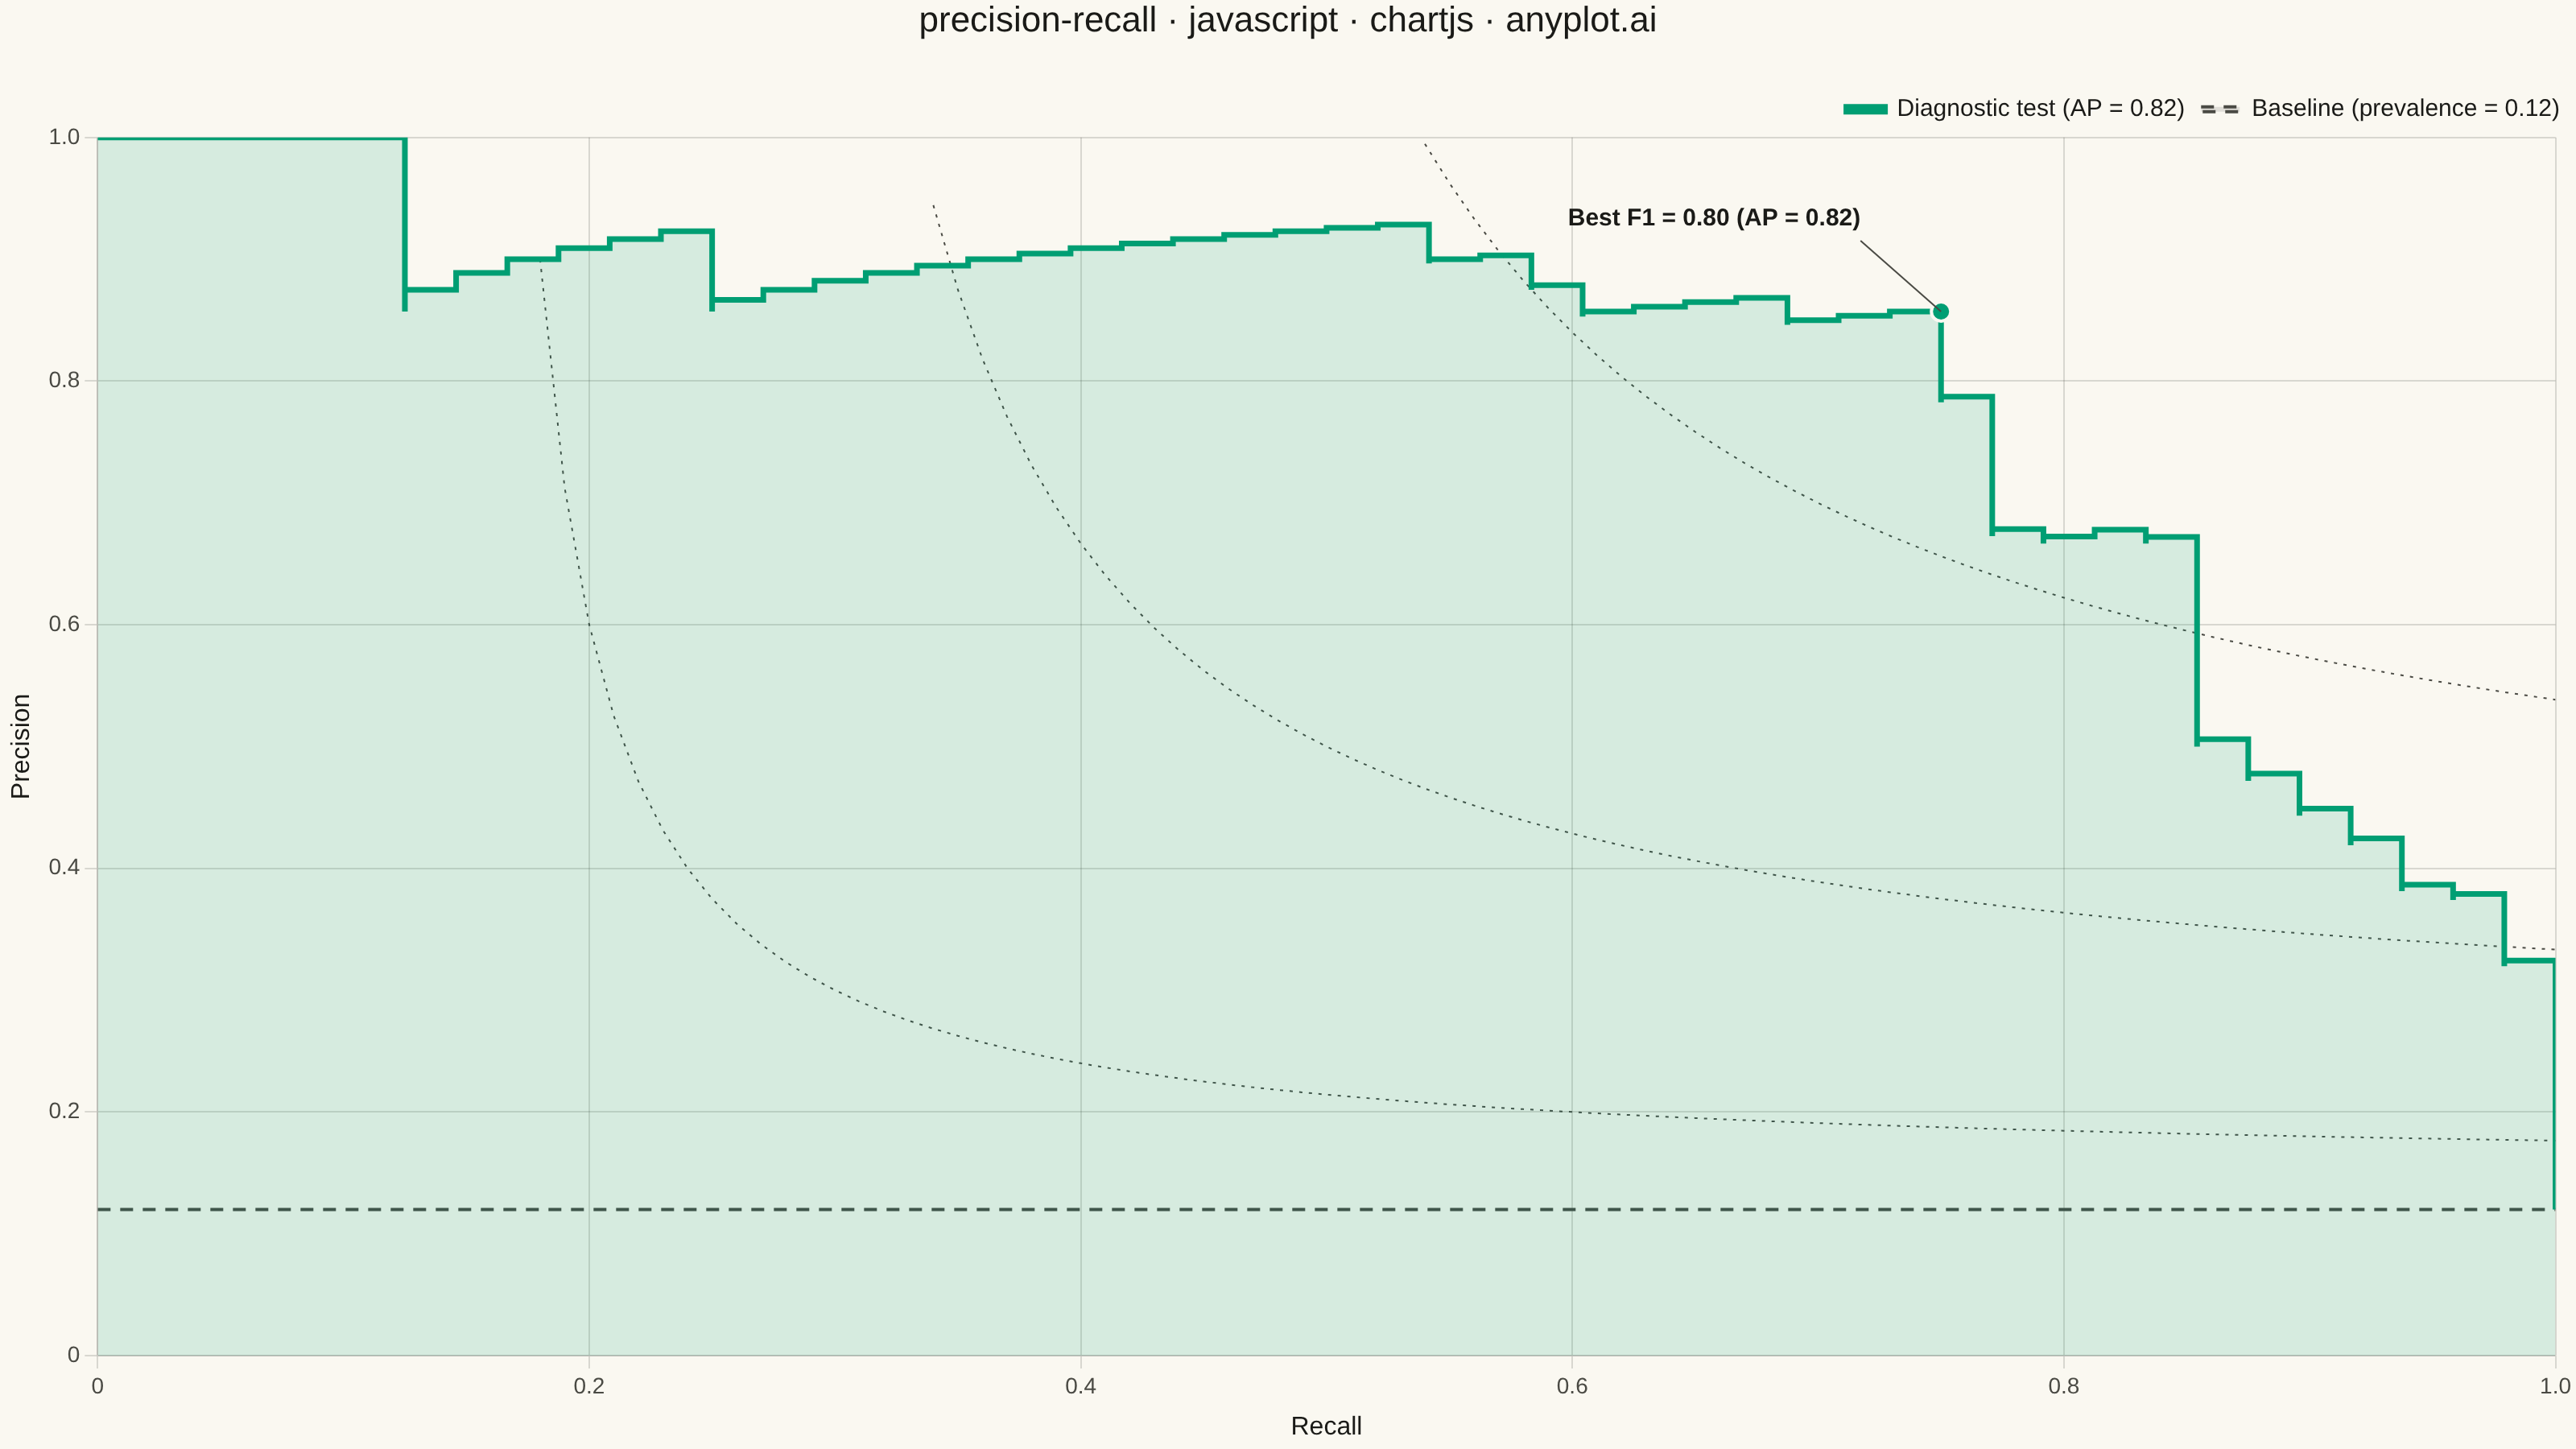
The same plot in 14 other libraries — JavaScript: D3.js, Apache ECharts, Highcharts, MUI X Charts; Python: Altair, Bokeh, lets-plot, Matplotlib, Plotly, plotnine, Pygal, Seaborn; R: ggplot2; Julia: Makie.jl. Compare all 15 side by side: Precision-Recall Curve in Python, R, Julia and JavaScript.
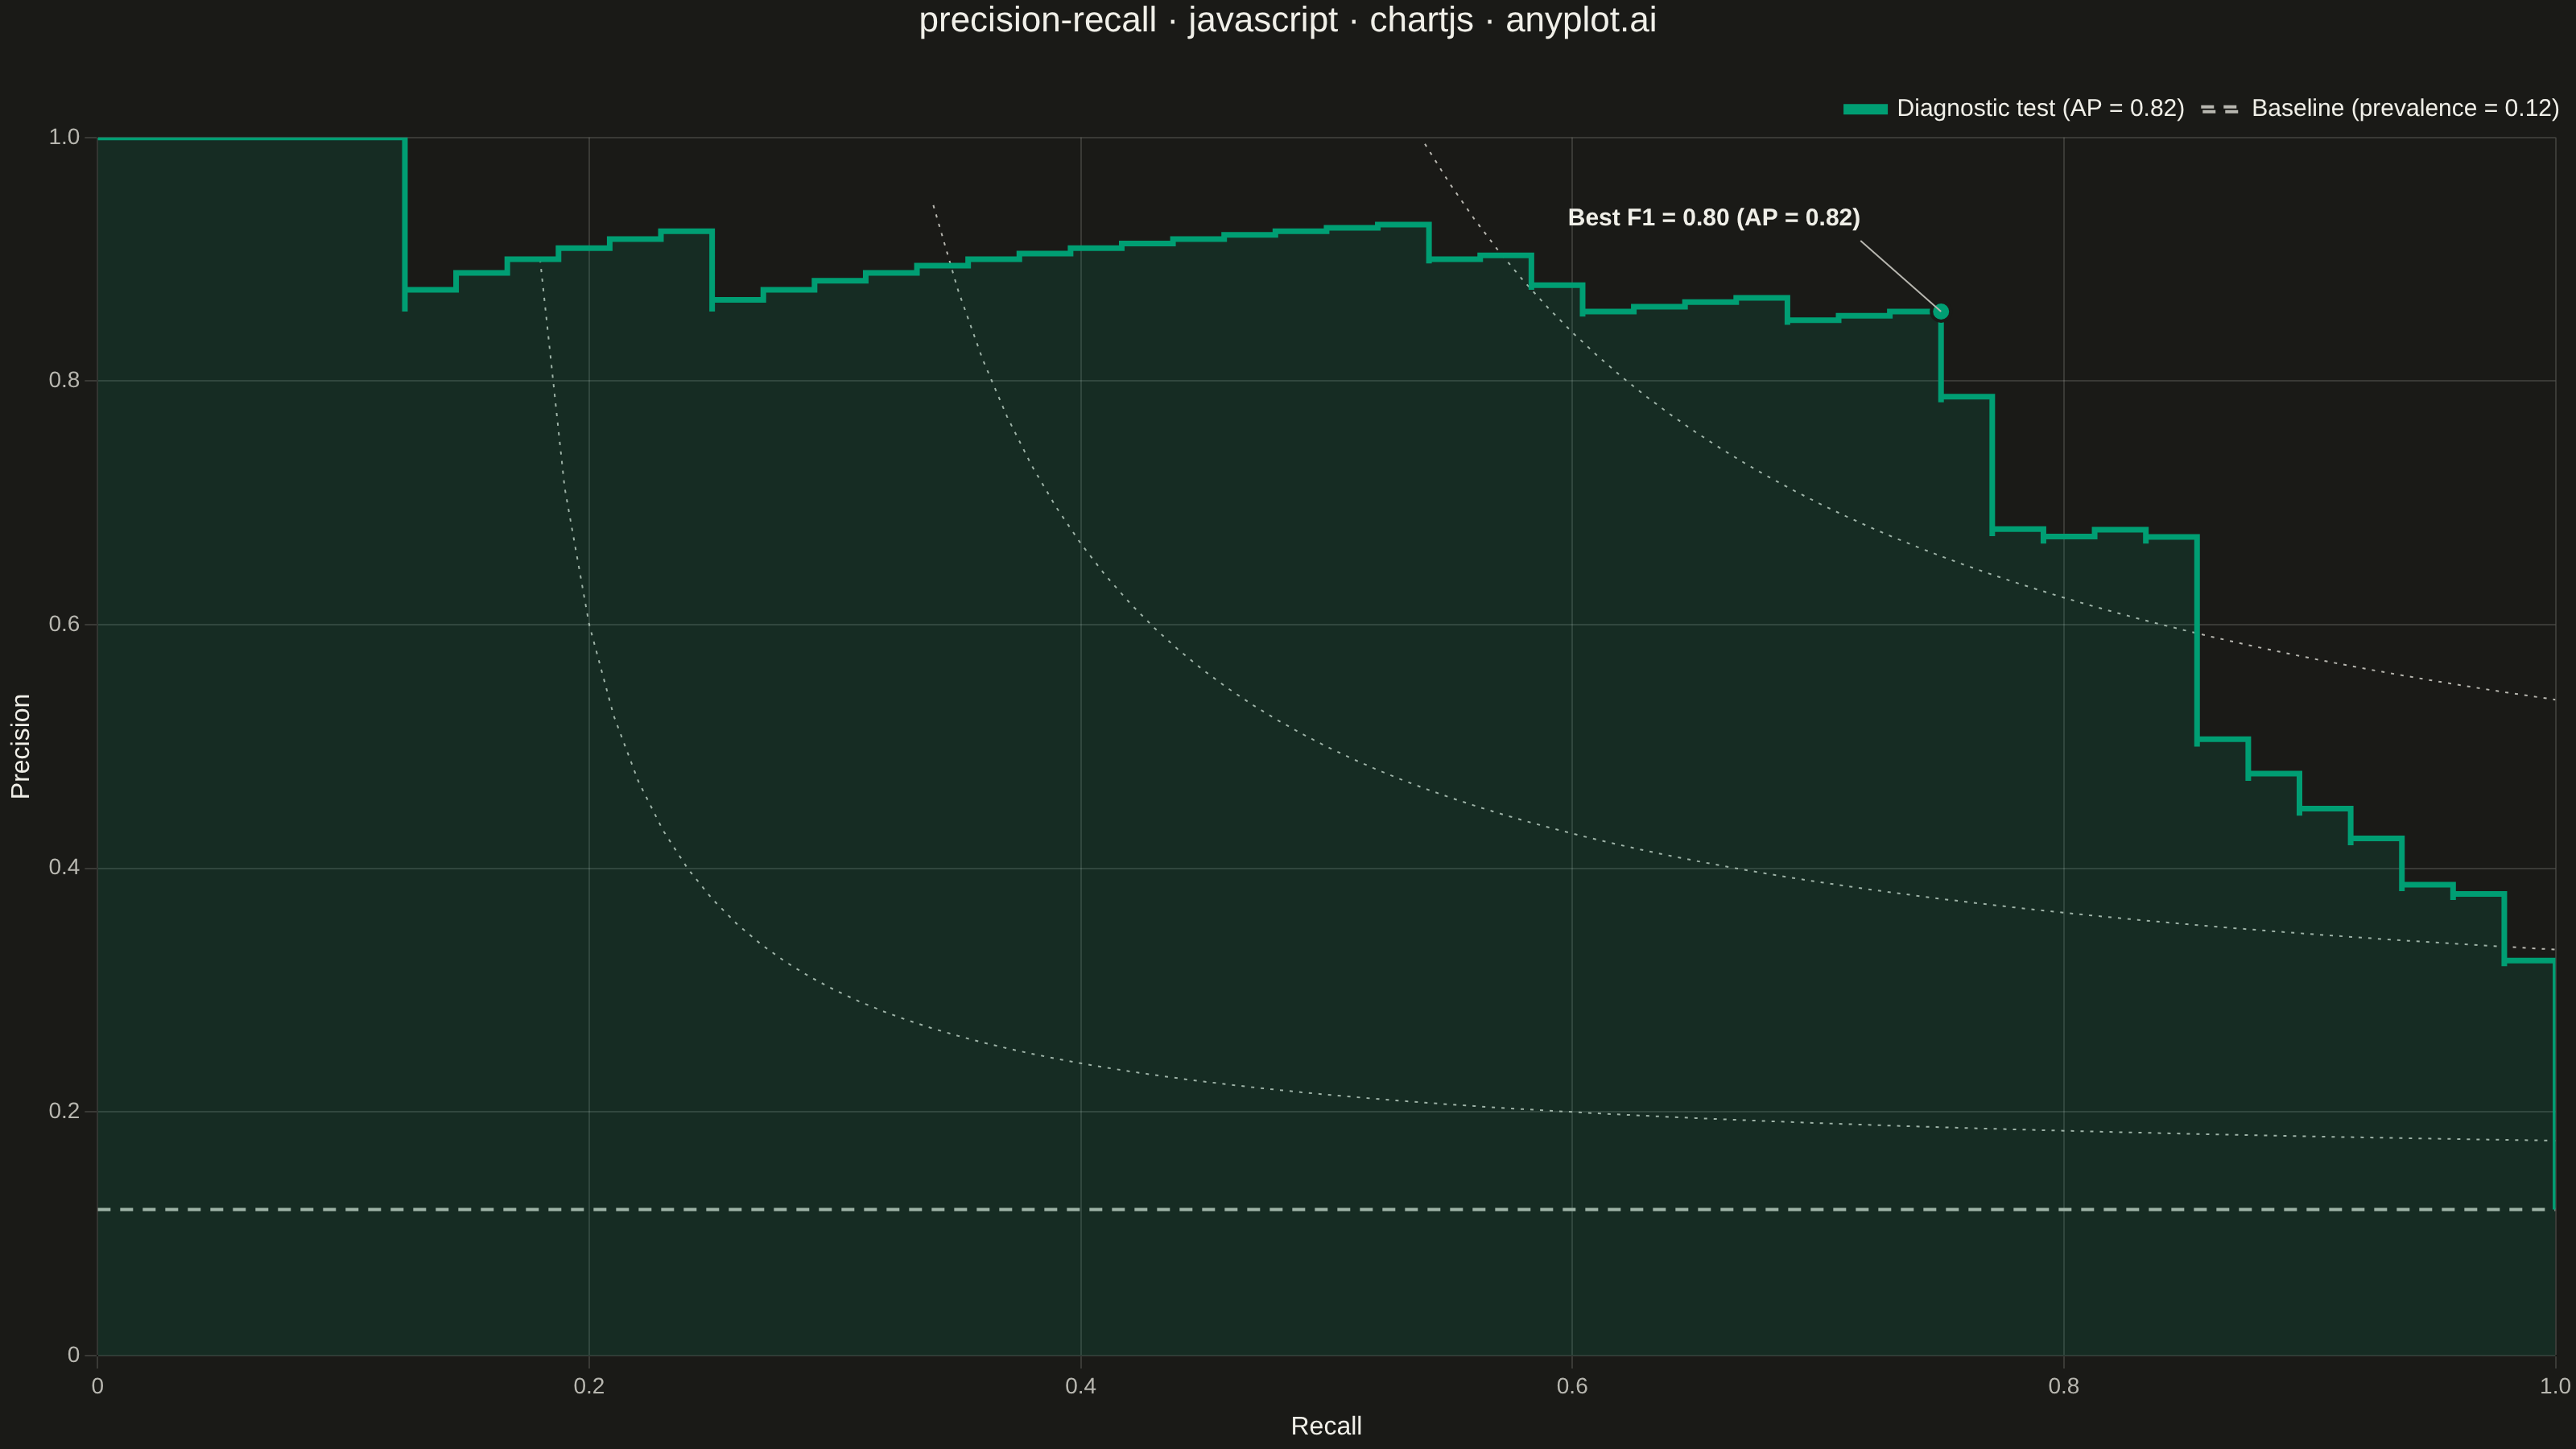
A Precision-Recall curve plots precision (positive predictive value) against recall (sensitivity) at various classification thresholds. This visualization is essential for evaluating binary classifiers on imbalanced datasets where accuracy alone is misleading. The area under the curve (Average Precision) summarizes classifier performance, with higher values indicating better performance.
// anyplot.ai
// precision-recall: Precision-Recall Curve
// Library: chartjs 4.4.7 | JavaScript 22.23.2
// Quality: 90/100 | Created: 2026-09-05

const t = window.ANYPLOT_TOKENS;

// --- Data: synthetic diagnostic-test scores for a rare condition -----------
function makeLcg(seed) {
  let state = seed;
  return function next() {
    state = (state * 9301 + 49297) % 233280;
    return state / 233280;
  };
}
const uniform = makeLcg(42);
function gaussian(mean, std) {
  const u1 = Math.max(uniform(), 1e-9);
  const u2 = uniform();
  const z = Math.sqrt(-2 * Math.log(u1)) * Math.cos(2 * Math.PI * u2);
  return mean + std * z;
}

const N_PATIENTS = 400;
const PREVALENCE = 0.12;
const nPositive = Math.round(N_PATIENTS * PREVALENCE);
const nNegative = N_PATIENTS - nPositive;

const yTrue = [];
const yScores = [];
for (let i = 0; i < nPositive; i++) {
  yTrue.push(1);
  yScores.push(Math.min(1, Math.max(0, gaussian(0.72, 0.16))));
}
for (let i = 0; i < nNegative; i++) {
  yTrue.push(0);
  yScores.push(Math.min(1, Math.max(0, gaussian(0.28, 0.18))));
}

// --- Precision-recall curve (descending-score thresholds, sklearn-style) ---
const order = yScores.map((_, i) => i).sort((a, b) => yScores[b] - yScores[a]);

let truePositives = 0;
let falsePositives = 0;
const precisionPoints = [1];
const recallPoints = [0];
for (const i of order) {
  if (yTrue[i] === 1) truePositives += 1;
  else falsePositives += 1;
  precisionPoints.push(truePositives / (truePositives + falsePositives));
  recallPoints.push(truePositives / nPositive);
}

let averagePrecision = 0;
for (let i = 1; i < recallPoints.length; i++) {
  averagePrecision += (recallPoints[i] - recallPoints[i - 1]) * precisionPoints[i];
}

const prCurve = recallPoints.map((r, i) => ({ x: r, y: precisionPoints[i] }));
const baselinePrecision = nPositive / N_PATIENTS;

// --- Knee point: the threshold with the highest F1 score, used for the callout
let kneeIndex = 1;
let bestF1 = -1;
for (let i = 1; i < prCurve.length; i++) {
  const { x: r, y: p } = prCurve[i];
  const f1 = p + r > 0 ? (2 * p * r) / (p + r) : 0;
  if (f1 > bestF1) {
    bestF1 = f1;
    kneeIndex = i;
  }
}
const kneePoint = prCurve[kneeIndex];

// --- Iso-F1 reference curves: precision as a function of recall for a fixed F1
function isoF1Curve(f1, steps = 100) {
  const points = [];
  for (let i = 0; i <= steps; i++) {
    const r = i / steps;
    if (2 * r - f1 <= 1e-6) continue;
    const p = (f1 * r) / (2 * r - f1);
    if (p > 0 && p <= 1) points.push({ x: r, y: p });
  }
  return points;
}
const isoF1Levels = [0.3, 0.5, 0.7];
const isoF1Datasets = isoF1Levels.map((f1) => ({
  label: `F1 = ${f1.toFixed(1)}`,
  data: isoF1Curve(f1),
  isoF1: true,
  borderColor: t.inkSoft,
  borderWidth: 1,
  borderDash: [2, 4],
  pointRadius: 0,
  fill: false,
}));

function hexToRgba(hex, alpha) {
  const clean = hex.replace("#", "");
  const r = parseInt(clean.substring(0, 2), 16);
  const g = parseInt(clean.substring(2, 4), 16);
  const b = parseInt(clean.substring(4, 6), 16);
  return `rgba(${r}, ${g}, ${b}, ${alpha})`;
}

// --- Mount -------------------------------------------------------------
const canvas = document.createElement("canvas");
document.getElementById("container").appendChild(canvas);

// --- Custom plugin: callout marking the best-F1 point on the curve ---------
const apCalloutPlugin = {
  id: "apCallout",
  afterDatasetsDraw(chart) {
    const { ctx, chartArea, scales } = chart;
    const x = scales.x.getPixelForValue(kneePoint.x);
    const y = scales.y.getPixelForValue(kneePoint.y);
    const onLeftHalf = kneePoint.x <= 0.5;
    const labelX = onLeftHalf ? x + 50 : x - 50;
    const labelY = Math.min(Math.max(y - 50, chartArea.top + 24), chartArea.bottom - 20);

    ctx.save();
    ctx.beginPath();
    ctx.arc(x, y, 6, 0, 2 * Math.PI);
    ctx.fillStyle = t.palette[0];
    ctx.fill();
    ctx.lineWidth = 2;
    ctx.strokeStyle = t.pageBg;
    ctx.stroke();

    ctx.beginPath();
    ctx.moveTo(x, y);
    ctx.lineTo(labelX, labelY + 6);
    ctx.strokeStyle = t.inkSoft;
    ctx.lineWidth = 1;
    ctx.stroke();

    ctx.font = "600 15px sans-serif";
    ctx.fillStyle = t.ink;
    ctx.textAlign = onLeftHalf ? "left" : "right";
    ctx.textBaseline = "bottom";
    ctx.fillText(`Best F1 = ${bestF1.toFixed(2)} (AP = ${averagePrecision.toFixed(2)})`, labelX, labelY);
    ctx.restore();
  },
};

// --- Chart -----------------------------------------------------------------
new Chart(canvas, {
  type: "line",
  data: {
    datasets: [
      {
        label: `Diagnostic test (AP = ${averagePrecision.toFixed(2)})`,
        data: prCurve,
        borderColor: t.palette[0],
        backgroundColor: hexToRgba(t.palette[0], 0.14),
        stepped: "after",
        borderWidth: 3.5,
        pointRadius: 0,
        fill: "origin",
      },
      ...isoF1Datasets,
      {
        label: `Baseline (prevalence = ${baselinePrecision.toFixed(2)})`,
        data: [
          { x: 0, y: baselinePrecision },
          { x: 1, y: baselinePrecision },
        ],
        borderColor: t.inkSoft,
        borderDash: [8, 6],
        borderWidth: 2,
        pointRadius: 0,
        fill: false,
      },
    ],
  },
  plugins: [apCalloutPlugin],
  options: {
    responsive: true,
    maintainAspectRatio: false,
    animation: false,
    plugins: {
      title: {
        display: true,
        text: "precision-recall · javascript · chartjs · anyplot.ai",
        color: t.ink,
        font: { size: 22, weight: "500" },
        padding: { bottom: 24 },
      },
      legend: {
        position: "top",
        align: "end",
        labels: {
          color: t.ink,
          font: { size: 15 },
          boxWidth: 24,
          boxHeight: 3,
          filter: (item, data) => !data.datasets[item.datasetIndex].isoF1,
        },
      },
    },
    scales: {
      x: {
        type: "linear",
        min: 0,
        max: 1,
        title: { display: true, text: "Recall", color: t.ink, font: { size: 16 } },
        ticks: { color: t.inkSoft, font: { size: 14 }, stepSize: 0.2 },
        grid: { color: t.grid },
      },
      y: {
        min: 0,
        max: 1,
        title: { display: true, text: "Precision", color: t.ink, font: { size: 16 } },
        ticks: { color: t.inkSoft, font: { size: 14 }, stepSize: 0.2 },
        grid: { color: t.grid },
      },
    },
  },
});
Runnable source as JSON, for any HTTP client: https://api.anyplot.ai/specs/precision-recall/chartjs/code. Any spec id and library id listed in llms-full.txt fit the same URL shape; every URL below is complete and callable.
{
  "spec_id": "precision-recall",
  "language": "javascript",
  "library": "chartjs",
  "page": "https://anyplot.ai/precision-recall/javascript/chartjs",
  "hub": "https://anyplot.ai/precision-recall",
  "code_json": "https://api.anyplot.ai/specs/precision-recall/chartjs/code",
  "spec_json": "https://api.anyplot.ai/specs/precision-recall",
  "render_light_png": "https://storage.googleapis.com/anyplot-images/plots/precision-recall/javascript/chartjs/plot-light.png",
  "render_dark_png": "https://storage.googleapis.com/anyplot-images/plots/precision-recall/javascript/chartjs/plot-dark.png",
  "interactive_light_html": "https://storage.googleapis.com/anyplot-images/plots/precision-recall/javascript/chartjs/plot-light.html",
  "interactive_dark_html": "https://storage.googleapis.com/anyplot-images/plots/precision-recall/javascript/chartjs/plot-dark.html",
  "quality_score": 90.0,
  "license": "MIT",
  "guide": "https://anyplot.ai/llms.txt"
}
Part of Precision-Recall Curve on anyplot.ai.