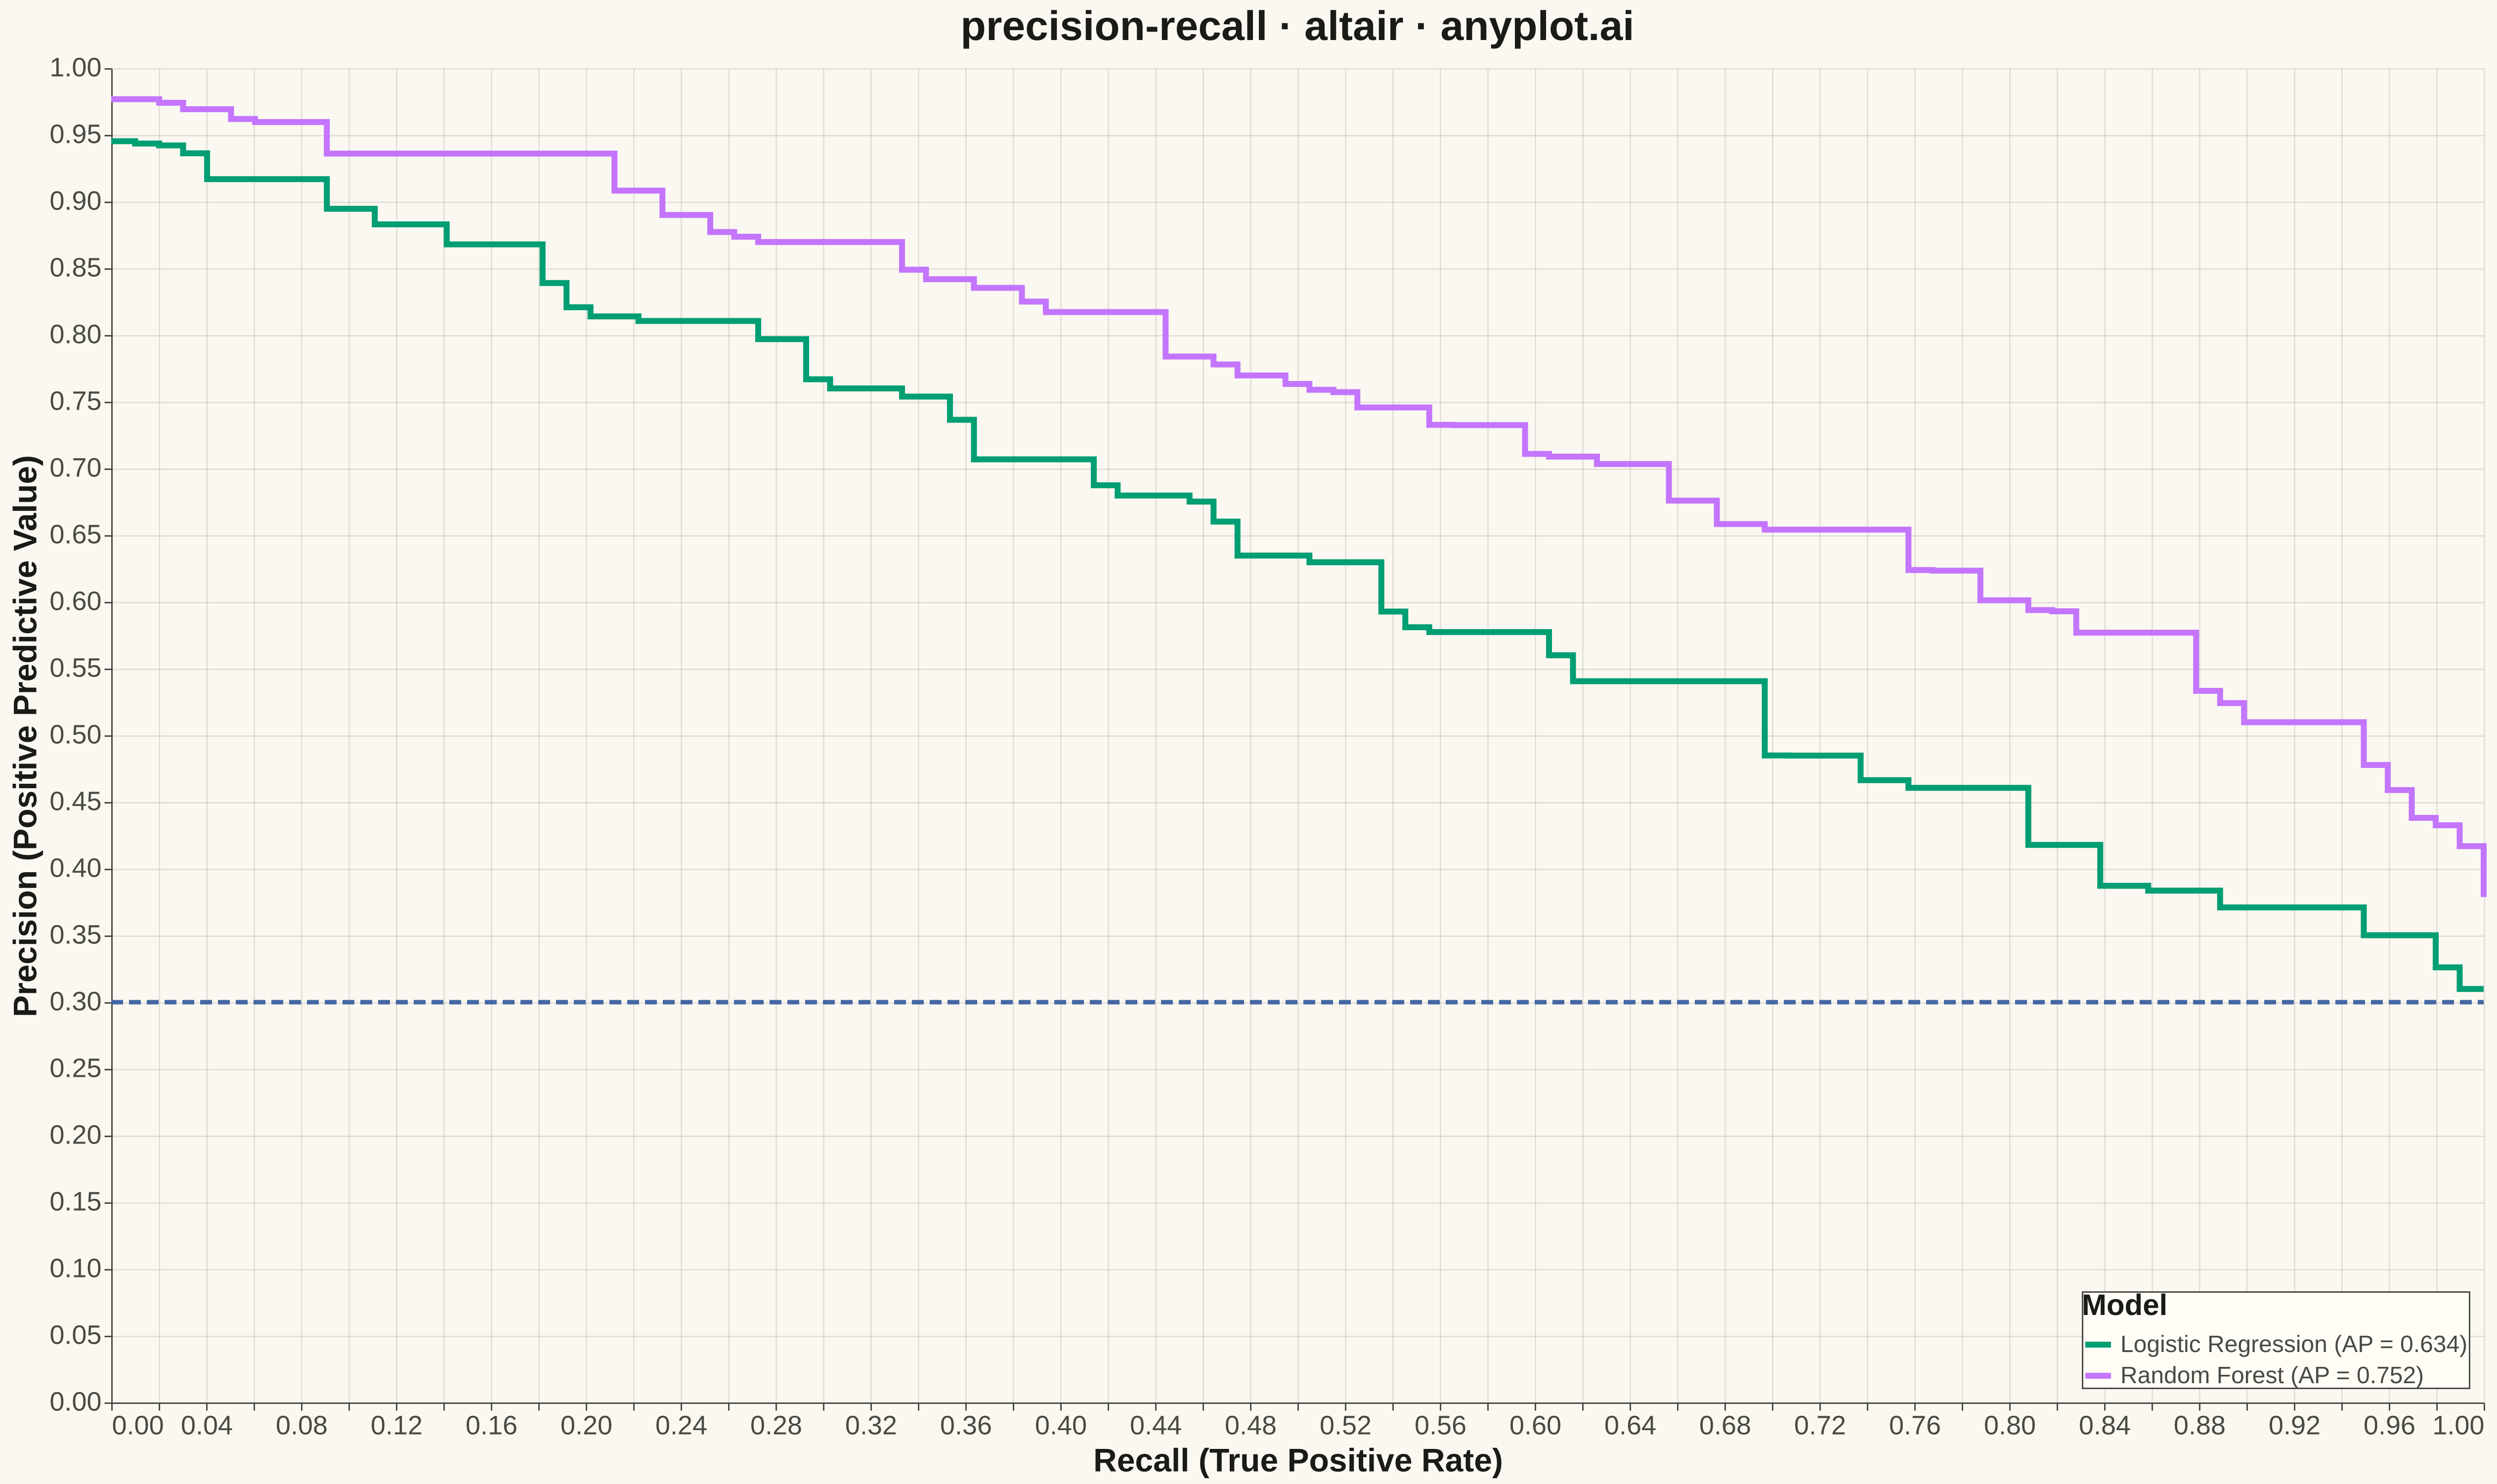
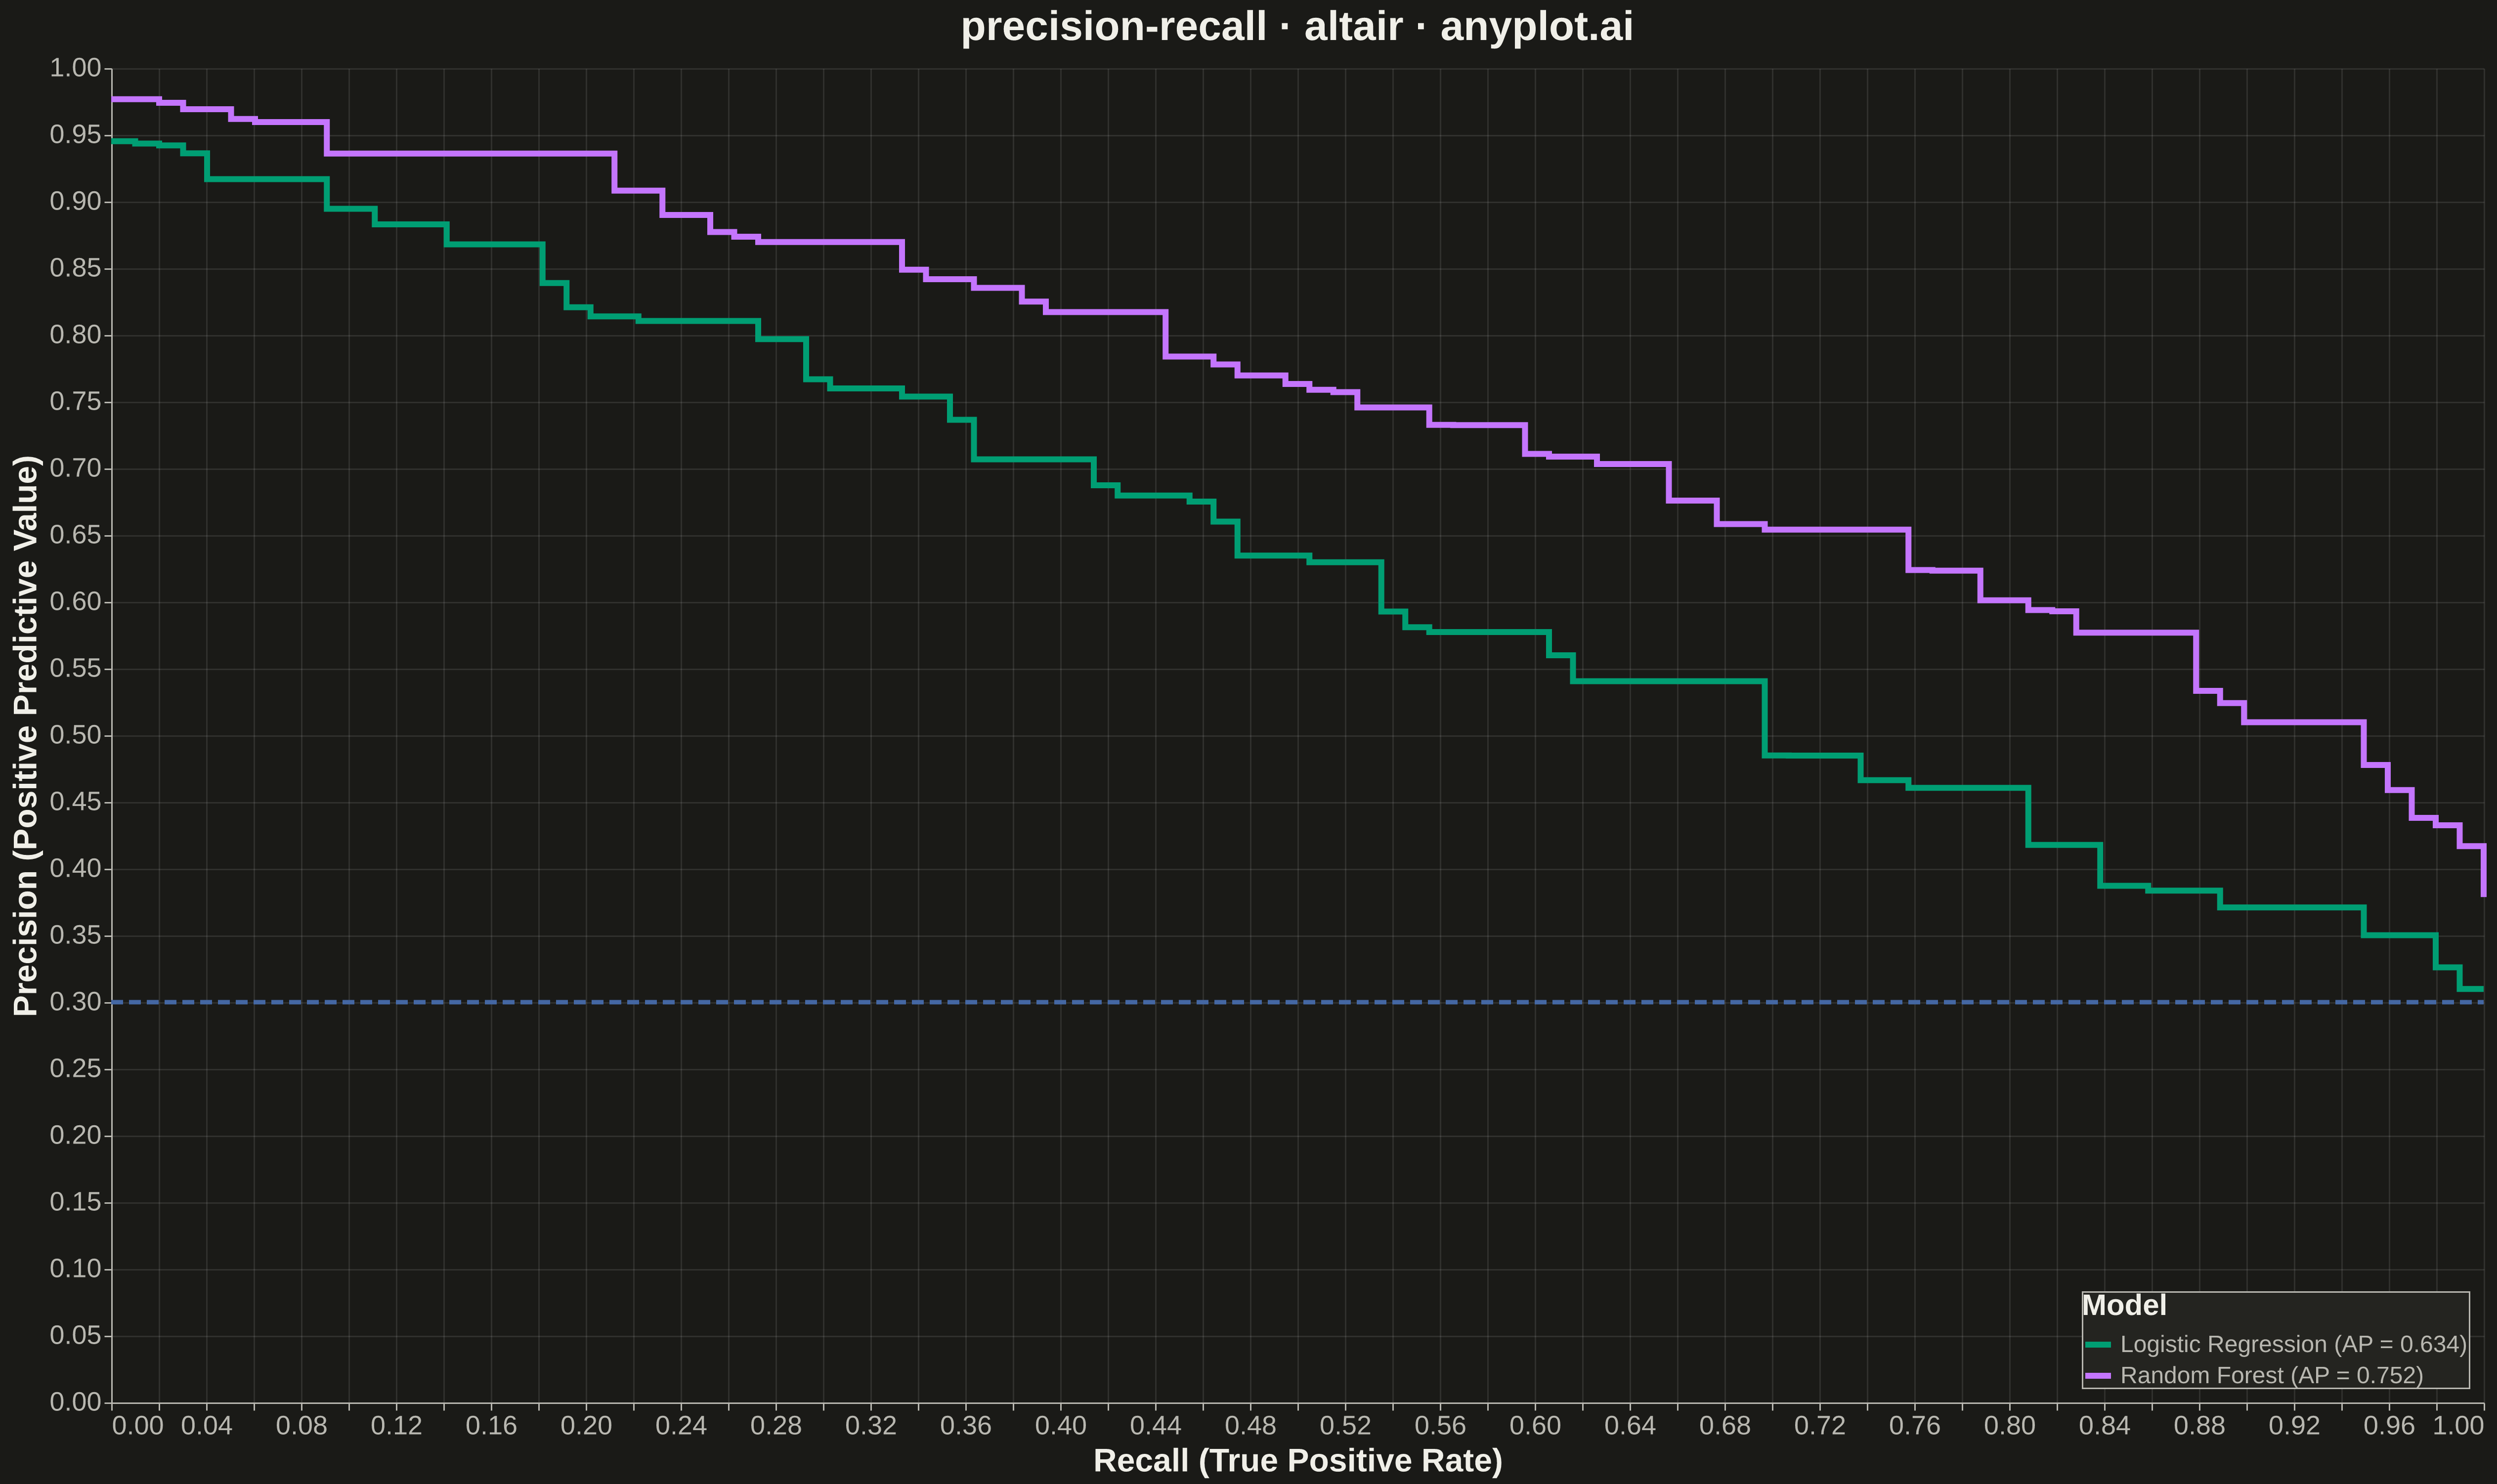
A Precision-Recall curve plots precision (positive predictive value) against recall (sensitivity) at various classification thresholds. This visualization is essential for evaluating binary classifiers on imbalanced datasets where accuracy alone is misleading. The area under the curve (Average Precision) summarizes classifier performance, with higher values indicating better performance.
""" anyplot.ai
precision-recall: Precision-Recall Curve
Library: altair 6.1.0 | Python 3.13.13
Quality: 90/100 | Updated: 2026-05-10
"""

import os
import sys


if __name__ == "__main__":
    sys.path = [p for p in sys.path if "precision-recall" not in p]

import altair as alt
import numpy as np
import pandas as pd


THEME = os.getenv("ANYPLOT_THEME", "light")
PAGE_BG = "#FAF8F1" if THEME == "light" else "#1A1A17"
ELEVATED_BG = "#FFFDF6" if THEME == "light" else "#242420"
INK = "#1A1A17" if THEME == "light" else "#F0EFE8"
INK_SOFT = "#4A4A44" if THEME == "light" else "#B8B7B0"

# Okabe-Ito palette
IMPRINT = ["#009E73", "#C475FD", "#4467A3"]

np.random.seed(42)

n_points = 100
recall_vals = np.linspace(1, 0, n_points)

lr_precision = 0.3 + 0.65 * (1 - recall_vals) + np.random.normal(0, 0.02, n_points)
lr_precision = np.clip(lr_precision, 0, 1)
lr_precision = np.maximum.accumulate(lr_precision)
lr_ap = np.trapezoid(lr_precision, recall_vals[::-1])

rf_precision = 0.4 + 0.58 * (1 - recall_vals) ** 0.7 + np.random.normal(0, 0.015, n_points)
rf_precision = np.clip(rf_precision, 0, 1)
rf_precision = np.maximum.accumulate(rf_precision)
rf_ap = np.trapezoid(rf_precision, recall_vals[::-1])

baseline = 0.30

lr_df = pd.DataFrame(
    {"Recall": recall_vals, "Precision": lr_precision, "Model": f"Logistic Regression (AP = {lr_ap:.3f})"}
)

rf_df = pd.DataFrame({"Recall": recall_vals, "Precision": rf_precision, "Model": f"Random Forest (AP = {rf_ap:.3f})"})

curve_df = pd.concat([lr_df, rf_df], ignore_index=True)

baseline_df = pd.DataFrame(
    {"Recall": [0.0, 1.0], "Precision": [baseline, baseline], "Model": f"Random Classifier (baseline = {baseline:.2f})"}
)

pr_curves = (
    alt.Chart(curve_df)
    .mark_line(strokeWidth=4, interpolate="step-after")
    .encode(
        x=alt.X("Recall:Q", title="Recall (True Positive Rate)", scale=alt.Scale(domain=[0, 1])),
        y=alt.Y("Precision:Q", title="Precision (Positive Predictive Value)", scale=alt.Scale(domain=[0, 1])),
        color=alt.Color(
            "Model:N",
            scale=alt.Scale(
                domain=[f"Logistic Regression (AP = {lr_ap:.3f})", f"Random Forest (AP = {rf_ap:.3f})"],
                range=[IMPRINT[0], IMPRINT[1]],
            ),
            legend=alt.Legend(
                title="Model",
                titleFontSize=20,
                labelFontSize=16,
                labelLimit=400,
                orient="bottom-right",
                direction="vertical",
                offset=10,
                symbolStrokeWidth=4,
                symbolSize=300,
                fillColor=ELEVATED_BG,
                strokeColor=INK_SOFT,
                labelColor=INK_SOFT,
                titleColor=INK,
            ),
        ),
        strokeDash=alt.StrokeDash(
            "Model:N",
            scale=alt.Scale(
                domain=[f"Logistic Regression (AP = {lr_ap:.3f})", f"Random Forest (AP = {rf_ap:.3f})"],
                range=[[0], [0]],
            ),
            legend=None,
        ),
    )
)

baseline_line = (
    alt.Chart(baseline_df)
    .mark_line(strokeWidth=3, strokeDash=[8, 4])
    .encode(x=alt.X("Recall:Q"), y=alt.Y("Precision:Q"), color=alt.ColorValue(IMPRINT[2]))
)

chart = (
    alt.layer(pr_curves, baseline_line)
    .properties(
        width=1600,
        height=900,
        background=PAGE_BG,
        title=alt.Title("precision-recall · altair · anyplot.ai", fontSize=28, anchor="middle", color=INK),
    )
    .configure_axis(
        labelFontSize=18,
        titleFontSize=22,
        labelColor=INK_SOFT,
        titleColor=INK,
        gridColor=INK,
        gridOpacity=0.10,
        domainColor=INK_SOFT,
        tickColor=INK_SOFT,
    )
    .configure_view(fill=PAGE_BG, stroke=INK_SOFT, strokeWidth=0)
    .configure_legend(fillColor=ELEVATED_BG, strokeColor=INK_SOFT, labelColor=INK_SOFT, titleColor=INK)
)

chart.save(f"plot-{THEME}.png", scale_factor=3.0)
chart.save(f"plot-{THEME}.html")
Runnable source as JSON, for any HTTP client: https://api.anyplot.ai/specs/precision-recall/altair/code. Any spec id and library id listed in llms-full.txt fit the same URL shape; every URL below is complete and callable.
{
  "spec_id": "precision-recall",
  "language": "python",
  "library": "altair",
  "page": "https://anyplot.ai/precision-recall/python/altair",
  "hub": "https://anyplot.ai/precision-recall",
  "code_json": "https://api.anyplot.ai/specs/precision-recall/altair/code",
  "spec_json": "https://api.anyplot.ai/specs/precision-recall",
  "render_light_png": "https://storage.googleapis.com/anyplot-images/plots/precision-recall/python/altair/plot-light.png",
  "render_dark_png": "https://storage.googleapis.com/anyplot-images/plots/precision-recall/python/altair/plot-dark.png",
  "interactive_light_html": "https://storage.googleapis.com/anyplot-images/plots/precision-recall/python/altair/plot-light.html",
  "interactive_dark_html": "https://storage.googleapis.com/anyplot-images/plots/precision-recall/python/altair/plot-dark.html",
  "quality_score": 90.0,
  "license": "MIT",
  "guide": "https://anyplot.ai/llms.txt"
}
Part of Precision-Recall Curve on anyplot.ai.