The same plot in 14 other libraries — JavaScript: Chart.js, D3.js, Apache ECharts, Highcharts; Python: Altair, Bokeh, lets-plot, Matplotlib, Plotly, plotnine, Pygal, Seaborn; R: ggplot2; Julia: Makie.jl. Compare all 15 side by side: Precision-Recall Curve in Python, R, Julia and JavaScript.
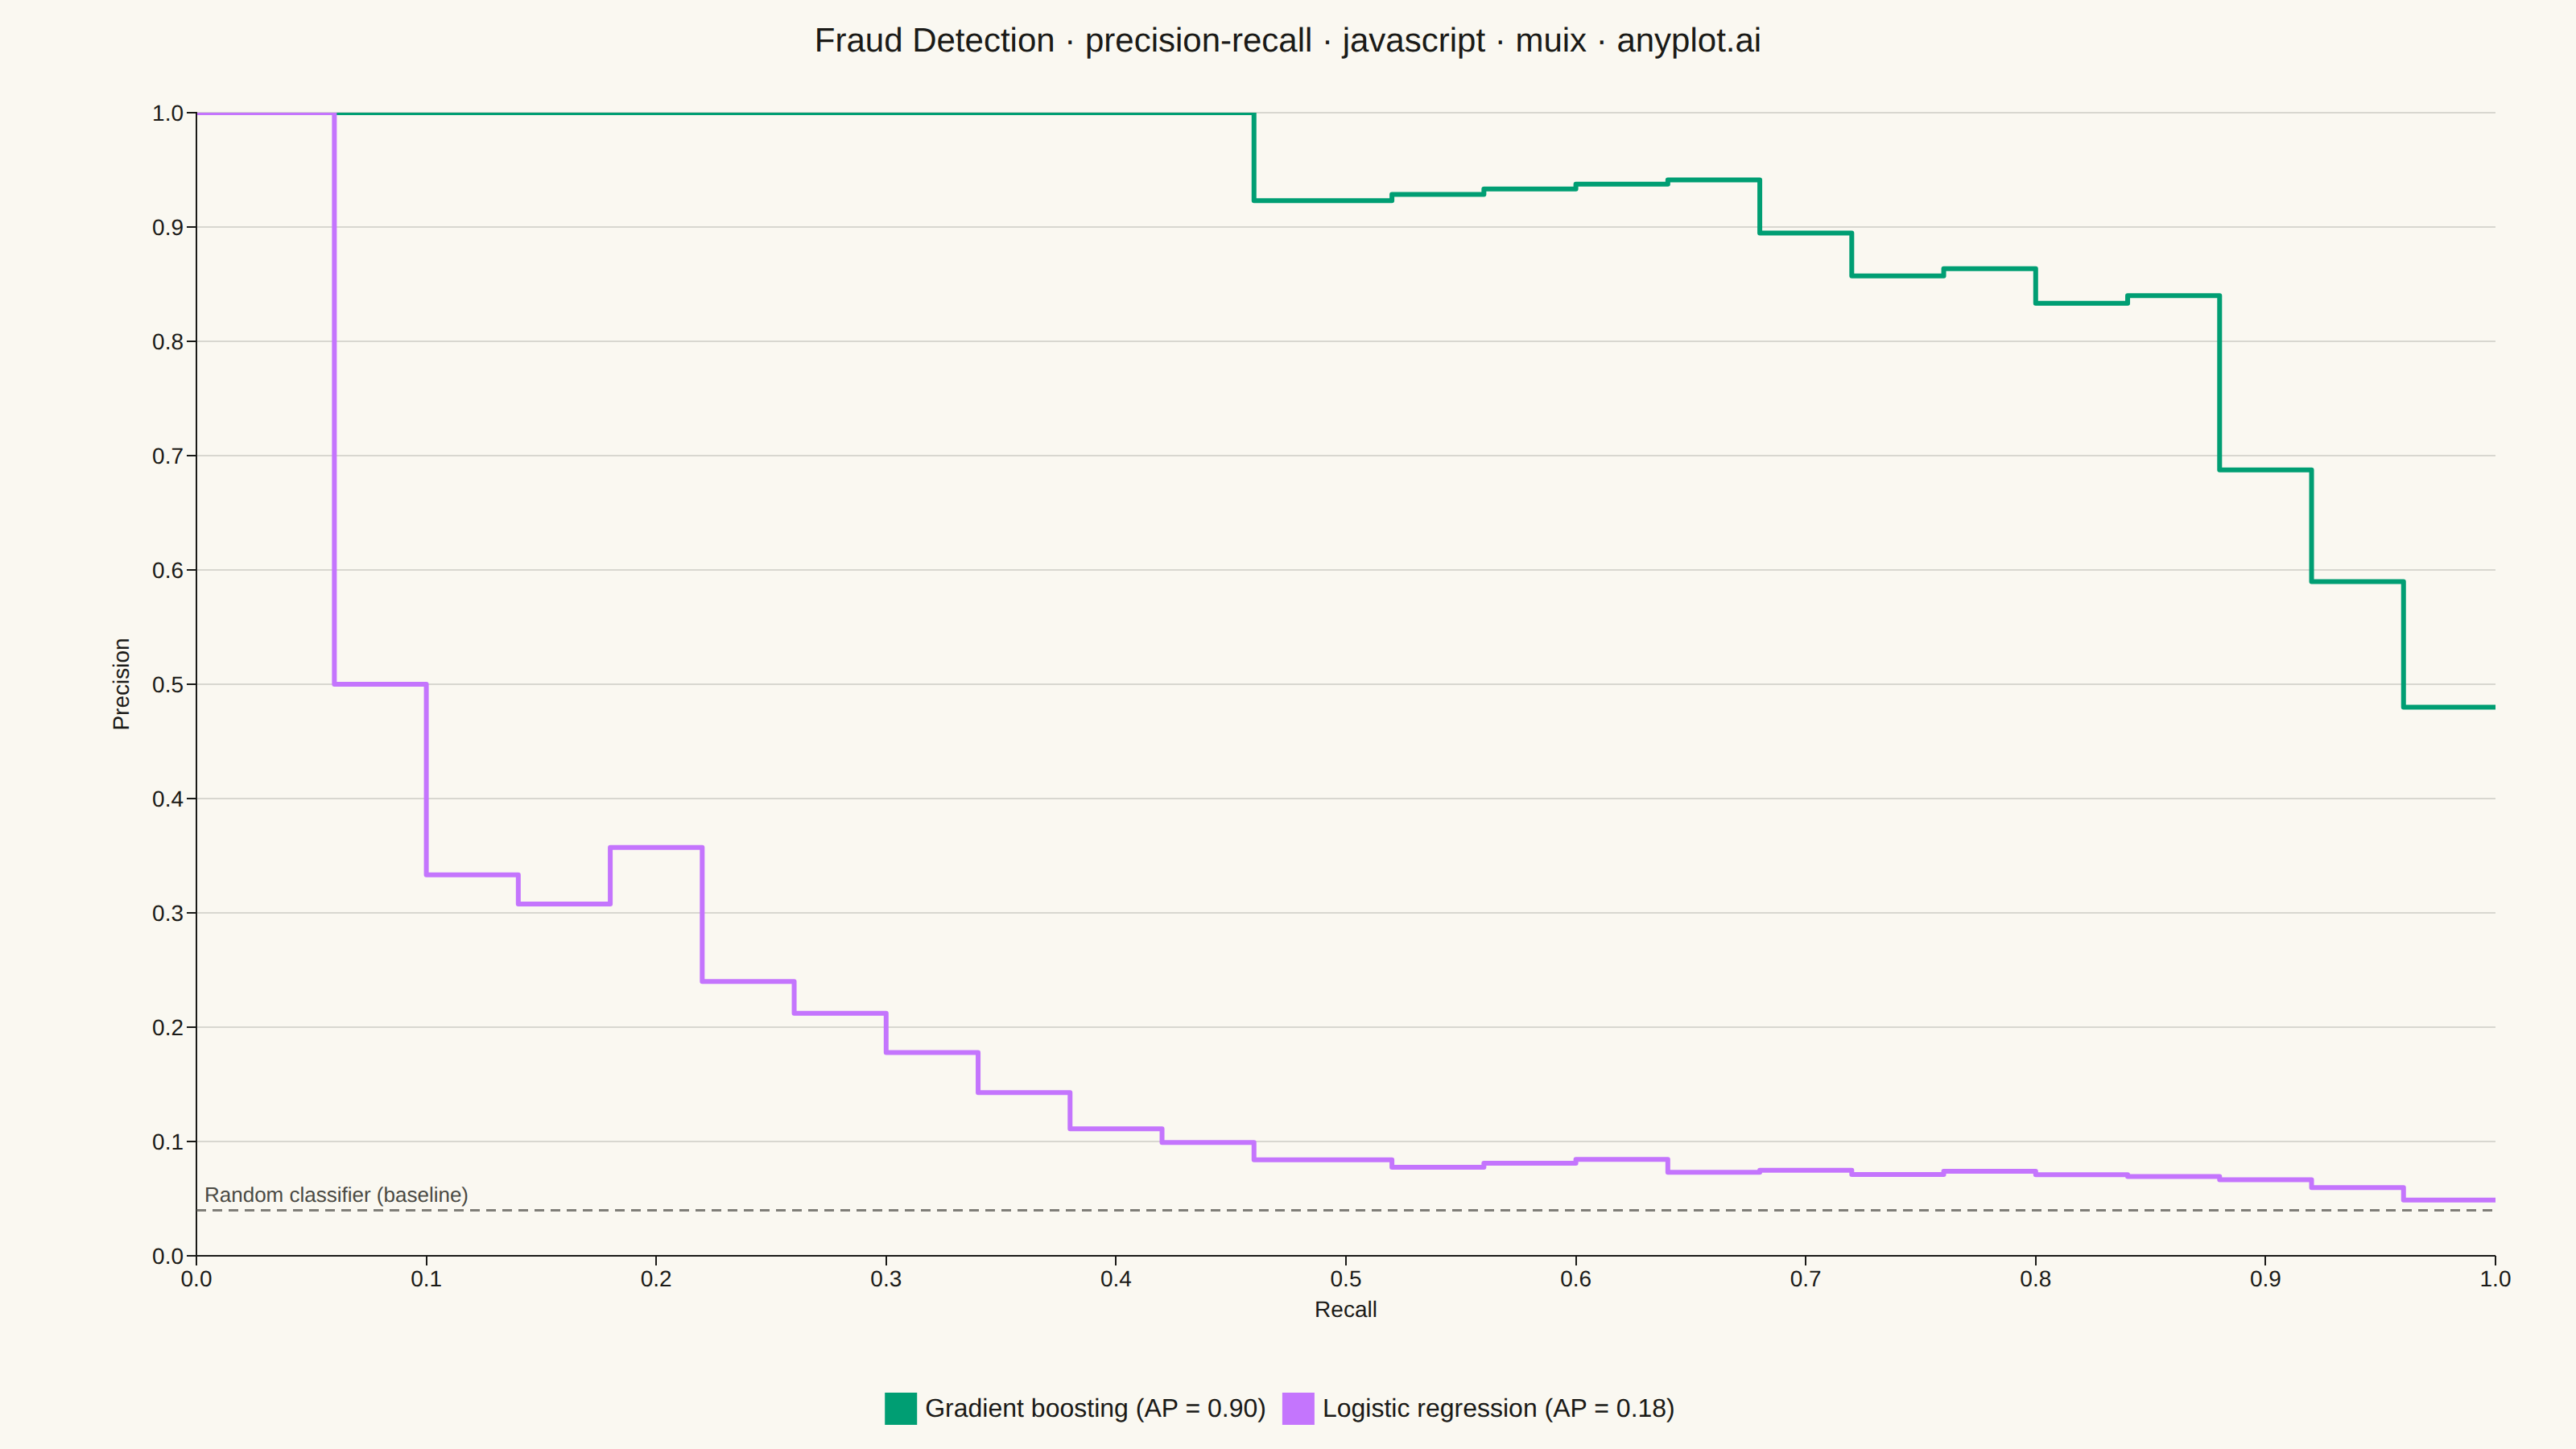
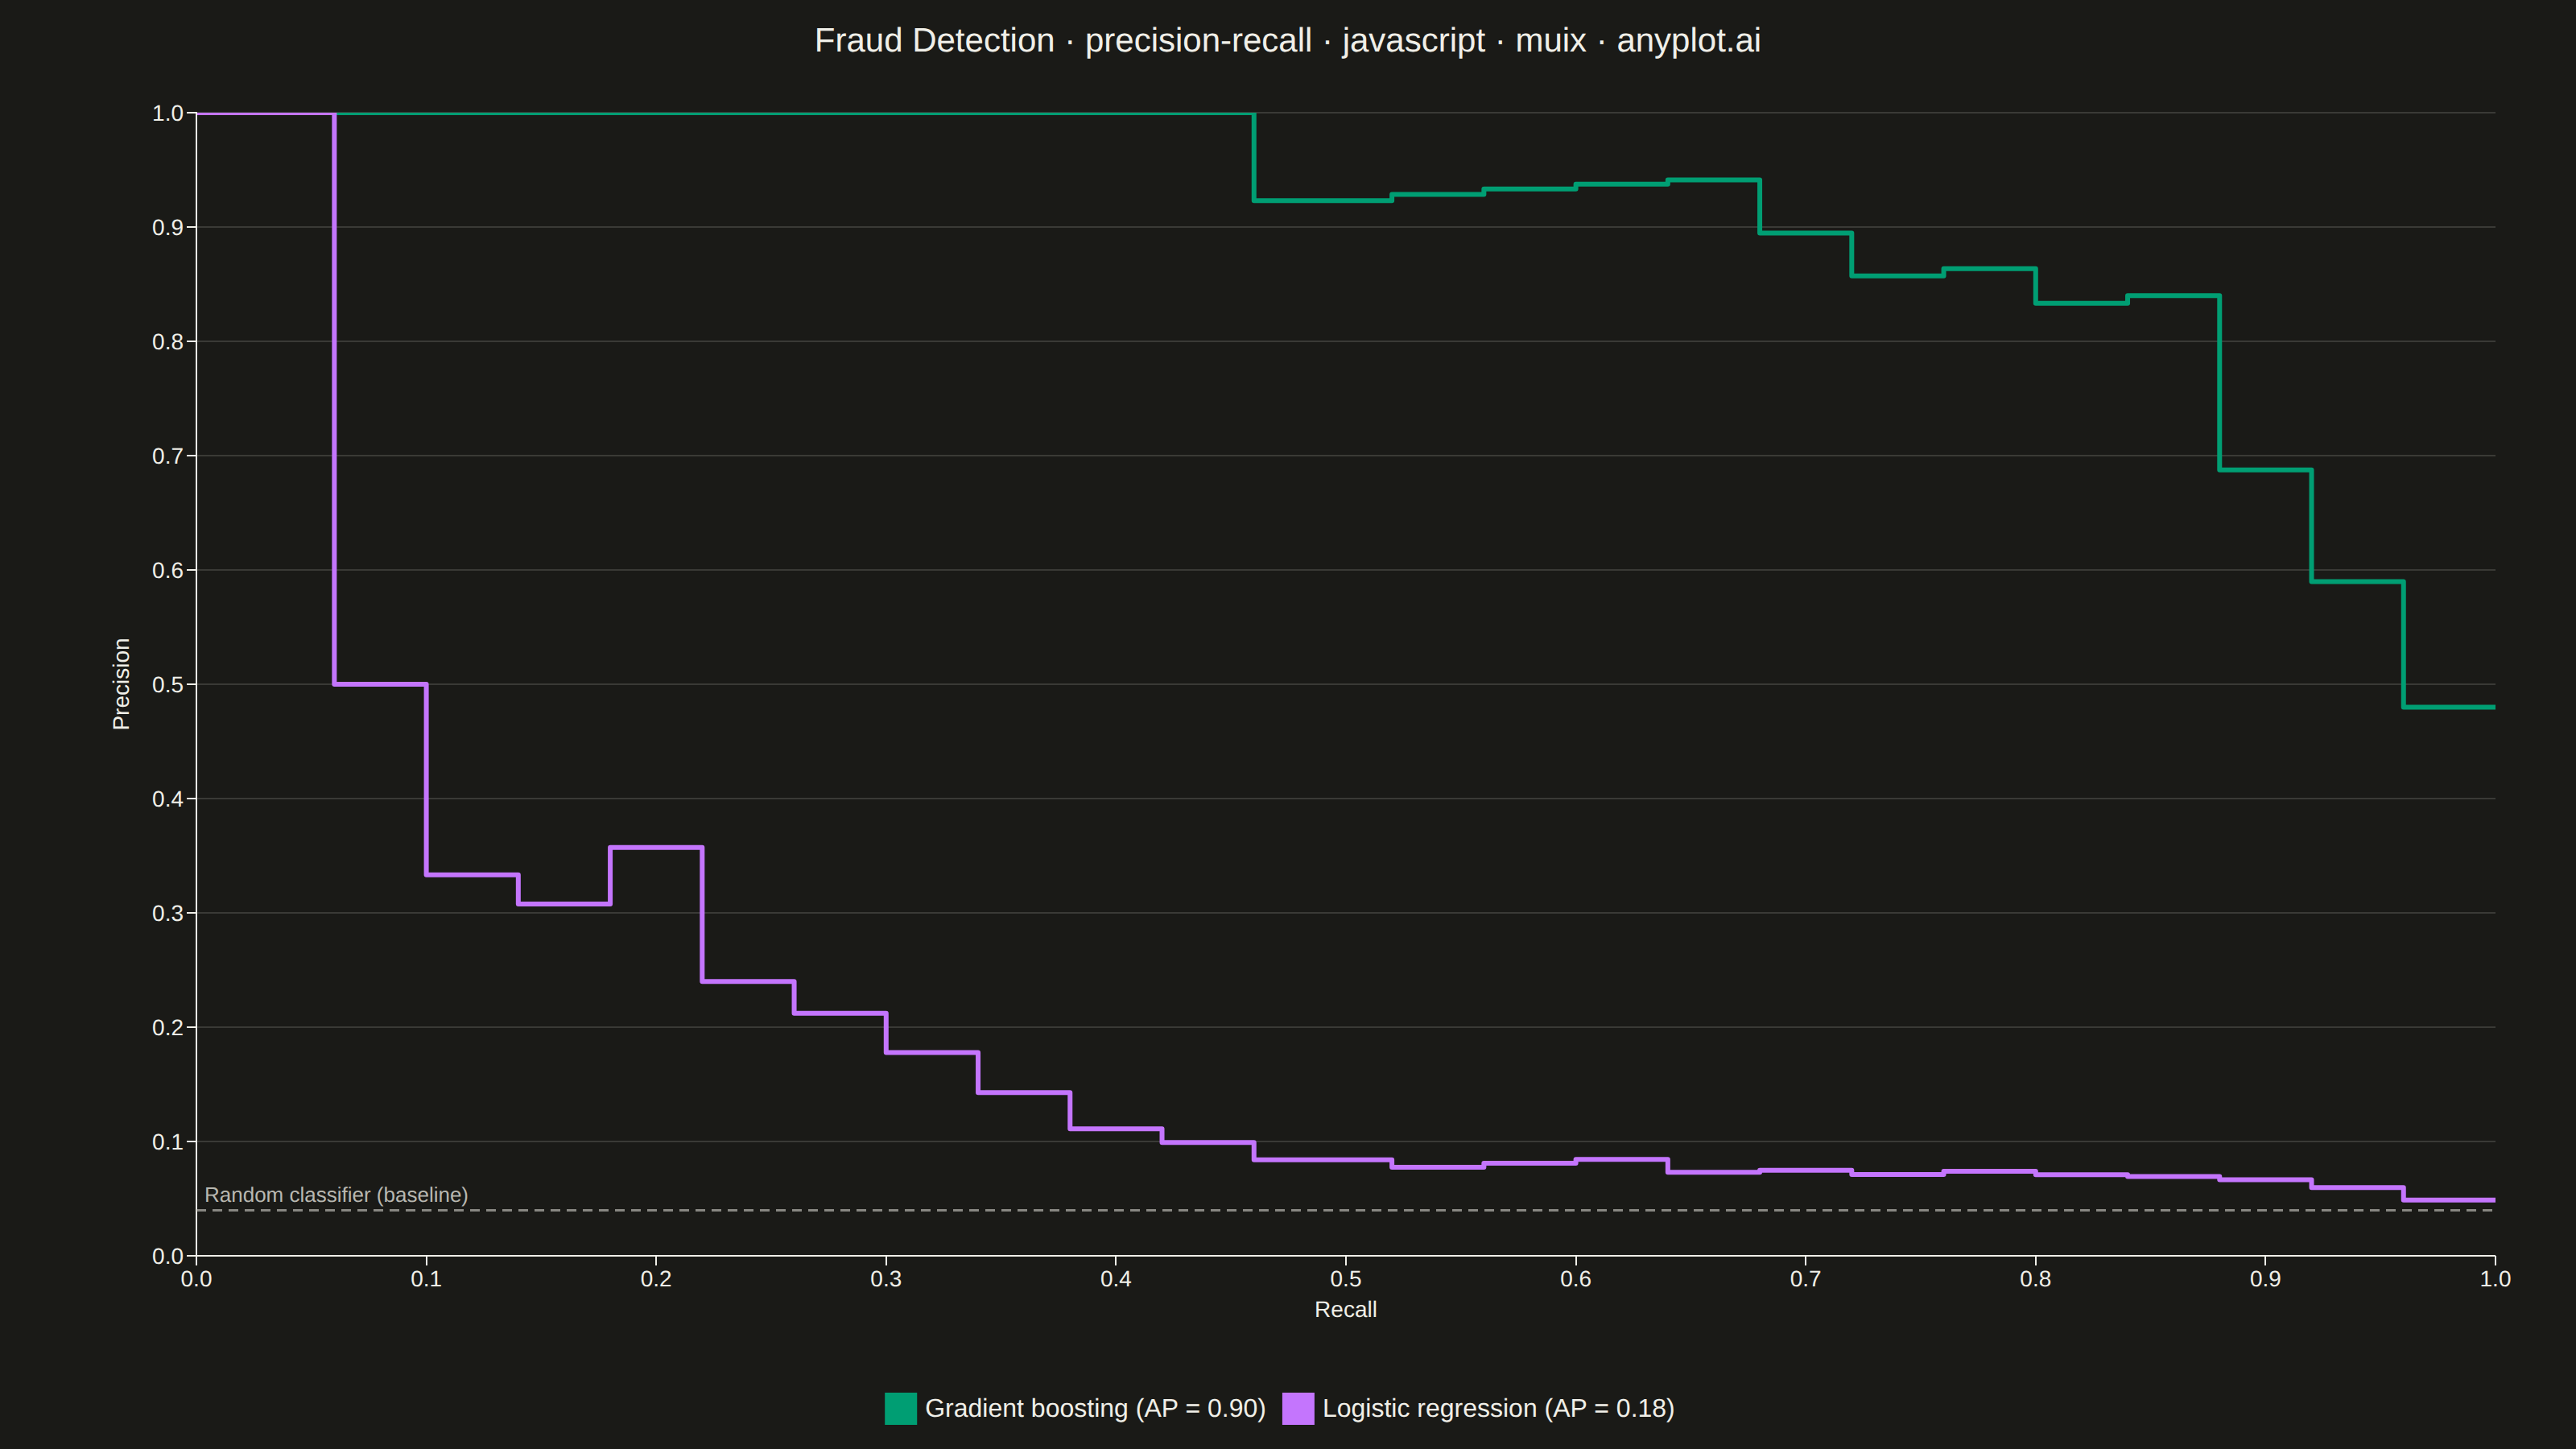
A Precision-Recall curve plots precision (positive predictive value) against recall (sensitivity) at various classification thresholds. This visualization is essential for evaluating binary classifiers on imbalanced datasets where accuracy alone is misleading. The area under the curve (Average Precision) summarizes classifier performance, with higher values indicating better performance.
// anyplot.ai
// precision-recall: Precision-Recall Curve
// Library: muix 7.29.1 | JavaScript 22.23.2
// Quality: 89/100 | Created: 2026-09-05
//# anyplot-orientation: landscape
// anyplot.ai
// precision-recall: Precision-Recall Curve
// Library: MUI X Charts | React | Node 22
// License: @mui/x-charts — MIT (community). Pro/Premium are out of scope.
// Quality: pending | Created: 2026-09-05

import { LineChart } from "@mui/x-charts/LineChart";
import { ChartsReferenceLine } from "@mui/x-charts/ChartsReferenceLine";

const t = window.ANYPLOT_TOKENS;

// --- Deterministic PRNG (LCG) + Box-Muller normal sampling -----------------
function makeRng(seed: number) {
  let state = seed >>> 0;
  return () => {
    state = (state * 1664525 + 1013904223) >>> 0;
    return state / 4294967296;
  };
}

function randNormal(rng: () => number) {
  const u1 = Math.max(rng(), 1e-9);
  const u2 = rng();
  return Math.sqrt(-2 * Math.log(u1)) * Math.cos(2 * Math.PI * u2);
}

const sigmoid = (x: number) => 1 / (1 + Math.exp(-x));

// --- Data: fraud-detection evaluation set (rare positive class) ------------
const rng = makeRng(42);
const sampleCount = 600;
const positiveRate = 0.06;

const yTrue = Array.from({ length: sampleCount }, () => (rng() < positiveRate ? 1 : 0));

// Two classifiers scored on the same transactions — a stronger gradient-boosted
// model vs. a weaker logistic-regression baseline, each mapped through a
// sigmoid to look like predict_proba() output.
const scoresGradientBoosting = yTrue.map((label) =>
  sigmoid(label === 1 ? 2.1 + randNormal(rng) : -1.3 + randNormal(rng)),
);
const scoresLogisticRegression = yTrue.map((label) =>
  sigmoid(label === 1 ? 0.9 + randNormal(rng) * 1.3 : -0.3 + randNormal(rng) * 1.3),
);

// --- Precision-recall curve math --------------------------------------------
type CurvePoint = { recall: number; precision: number };

function precisionRecallCurve(labels: number[], scores: number[]): CurvePoint[] {
  const order = labels.map((_, i) => i).sort((a, b) => scores[b] - scores[a]);
  const totalPositives = labels.reduce((sum, v) => sum + v, 0);

  const points: CurvePoint[] = [{ recall: 0, precision: 1 }];
  let truePositives = 0;
  let falsePositives = 0;
  let i = 0;
  while (i < order.length) {
    const score = scores[order[i]];
    let j = i;
    while (j < order.length && scores[order[j]] === score) {
      if (labels[order[j]] === 1) truePositives += 1;
      else falsePositives += 1;
      j += 1;
    }
    points.push({
      recall: truePositives / totalPositives,
      precision: truePositives / (truePositives + falsePositives),
    });
    i = j;
  }
  return points;
}

// Average Precision: AP = sum_n (R_n - R_{n-1}) * P_n
function averagePrecision(points: CurvePoint[]): number {
  let ap = 0;
  for (let i = 1; i < points.length; i += 1) {
    ap += (points[i].recall - points[i - 1].recall) * points[i].precision;
  }
  return ap;
}

// Right-continuous step lookup: precision held constant until the next
// (higher) recall breakpoint — matches the "steps-post" convention used to
// draw PR curves.
function precisionAtRecall(points: CurvePoint[], recall: number): number {
  for (const point of points) {
    if (point.recall >= recall - 1e-9) return point.precision;
  }
  return points[points.length - 1].precision;
}

const curveGradientBoosting = precisionRecallCurve(yTrue, scoresGradientBoosting);
const curveLogisticRegression = precisionRecallCurve(yTrue, scoresLogisticRegression);
const apGradientBoosting = averagePrecision(curveGradientBoosting);
const apLogisticRegression = averagePrecision(curveLogisticRegression);
const baselinePrecision = yTrue.reduce((sum, v) => sum + v, 0) / sampleCount;

// Resample both curves onto a shared recall grid so they can share one xAxis.
const gridSteps = 50;
const recallGrid = Array.from({ length: gridSteps + 1 }, (_, i) => Math.round((i / gridSteps) * 100) / 100);
const precisionGradientBoosting = recallGrid.map((r) => precisionAtRecall(curveGradientBoosting, r));
const precisionLogisticRegression = recallGrid.map((r) => precisionAtRecall(curveLogisticRegression, r));

// Explicit tick positions (0.0, 0.1, …, 1.0) — the default continuous-scale
// tick generator ignores our 51-point display grid and produces far denser,
// overlap-prone ticks, so we pin them ourselves.
const axisTicks = Array.from({ length: 11 }, (_, i) => Math.round(i * 10) / 100);

// --- Chart (default-exported component — the harness mounts it) -------------
export default function Chart() {
  return (
    <div style={{ width: "100%", height: "100%", position: "relative" }}>
      {/* Title rendered in the chart's top margin space */}
      <div
        style={{
          position: "absolute",
          top: 14,
          left: 0,
          right: 0,
          textAlign: "center",
          zIndex: 1,
          fontSize: 21,
          fontWeight: 500,
          color: t.ink,
          pointerEvents: "none",
          fontFamily: "'Roboto', 'Helvetica', 'Arial', sans-serif",
        }}
      >
        Fraud Detection · precision-recall · javascript · muix · anyplot.ai
      </div>

      <LineChart
        width={window.ANYPLOT_SIZE.width}
        height={window.ANYPLOT_SIZE.height}
        skipAnimation
        colors={[t.palette[0], t.palette[1]]}
        xAxis={[
          {
            data: recallGrid,
            scaleType: "linear",
            min: 0,
            max: 1,
            label: "Recall",
            valueFormatter: (v: number) => v.toFixed(1),
            tickInterval: axisTicks,
          },
        ]}
        yAxis={[
          {
            min: 0,
            max: 1,
            label: "Precision",
            valueFormatter: (v: number) => v.toFixed(1),
          },
        ]}
        series={[
          {
            id: "gradient-boosting",
            data: precisionGradientBoosting,
            label: `Gradient boosting (AP = ${apGradientBoosting.toFixed(2)})`,
            curve: "stepAfter",
            showMark: false,
          },
          {
            id: "logistic-regression",
            data: precisionLogisticRegression,
            label: `Logistic regression (AP = ${apLogisticRegression.toFixed(2)})`,
            curve: "stepAfter",
            showMark: false,
          },
        ]}
        grid={{ horizontal: true, vertical: false }}
        sx={{
          "& .MuiChartsAxis-label": {
            fontSize: "16px !important",
          },
          "& .MuiChartsAxis-tickLabel": {
            fontSize: "14px !important",
          },
          // Nudge the y-axis label further from its tick labels — the rotated
          // "Precision" title otherwise sits close enough to touch the "0.5"
          // tick label at this font size (x-axis label is untouched: only the
          // directionY axis root carries this selector).
          "& .MuiChartsAxis-directionY .MuiChartsAxis-label": {
            transform: "translateX(-14px)",
          },
          "& .MuiChartsLegend-label": {
            fontSize: "15px !important",
          },
          "& .MuiLineElement-root": {
            strokeWidth: "3px",
          },
          "& .MuiChartsGrid-horizontalLine": {
            stroke: t.grid,
          },
        }}
        slotProps={{
          legend: {
            direction: "row",
            position: { vertical: "bottom", horizontal: "middle" },
          },
        }}
        margin={{ top: 70, right: 50, bottom: 120, left: 122 }}
      >
        <ChartsReferenceLine
          y={baselinePrecision}
          label="Random classifier (baseline)"
          labelAlign="start"
          lineStyle={{
            stroke: t.inkSoft,
            strokeDasharray: "6 4",
            strokeWidth: 1.5,
            strokeOpacity: 0.7,
          }}
          labelStyle={{
            fill: t.inkSoft,
            fontSize: 13,
          }}
        />
      </LineChart>
    </div>
  );
}
Runnable source as JSON, for any HTTP client: https://api.anyplot.ai/specs/precision-recall/muix/code. Any spec id and library id listed in llms-full.txt fit the same URL shape; every URL below is complete and callable.
{
  "spec_id": "precision-recall",
  "language": "javascript",
  "library": "muix",
  "page": "https://anyplot.ai/precision-recall/javascript/muix",
  "hub": "https://anyplot.ai/precision-recall",
  "code_json": "https://api.anyplot.ai/specs/precision-recall/muix/code",
  "spec_json": "https://api.anyplot.ai/specs/precision-recall",
  "render_light_png": "https://storage.googleapis.com/anyplot-images/plots/precision-recall/javascript/muix/plot-light.png",
  "render_dark_png": "https://storage.googleapis.com/anyplot-images/plots/precision-recall/javascript/muix/plot-dark.png",
  "interactive_light_html": "https://storage.googleapis.com/anyplot-images/plots/precision-recall/javascript/muix/plot-light.html",
  "interactive_dark_html": "https://storage.googleapis.com/anyplot-images/plots/precision-recall/javascript/muix/plot-dark.html",
  "quality_score": 89.0,
  "license": "MIT",
  "guide": "https://anyplot.ai/llms.txt"
}
Part of Precision-Recall Curve on anyplot.ai.