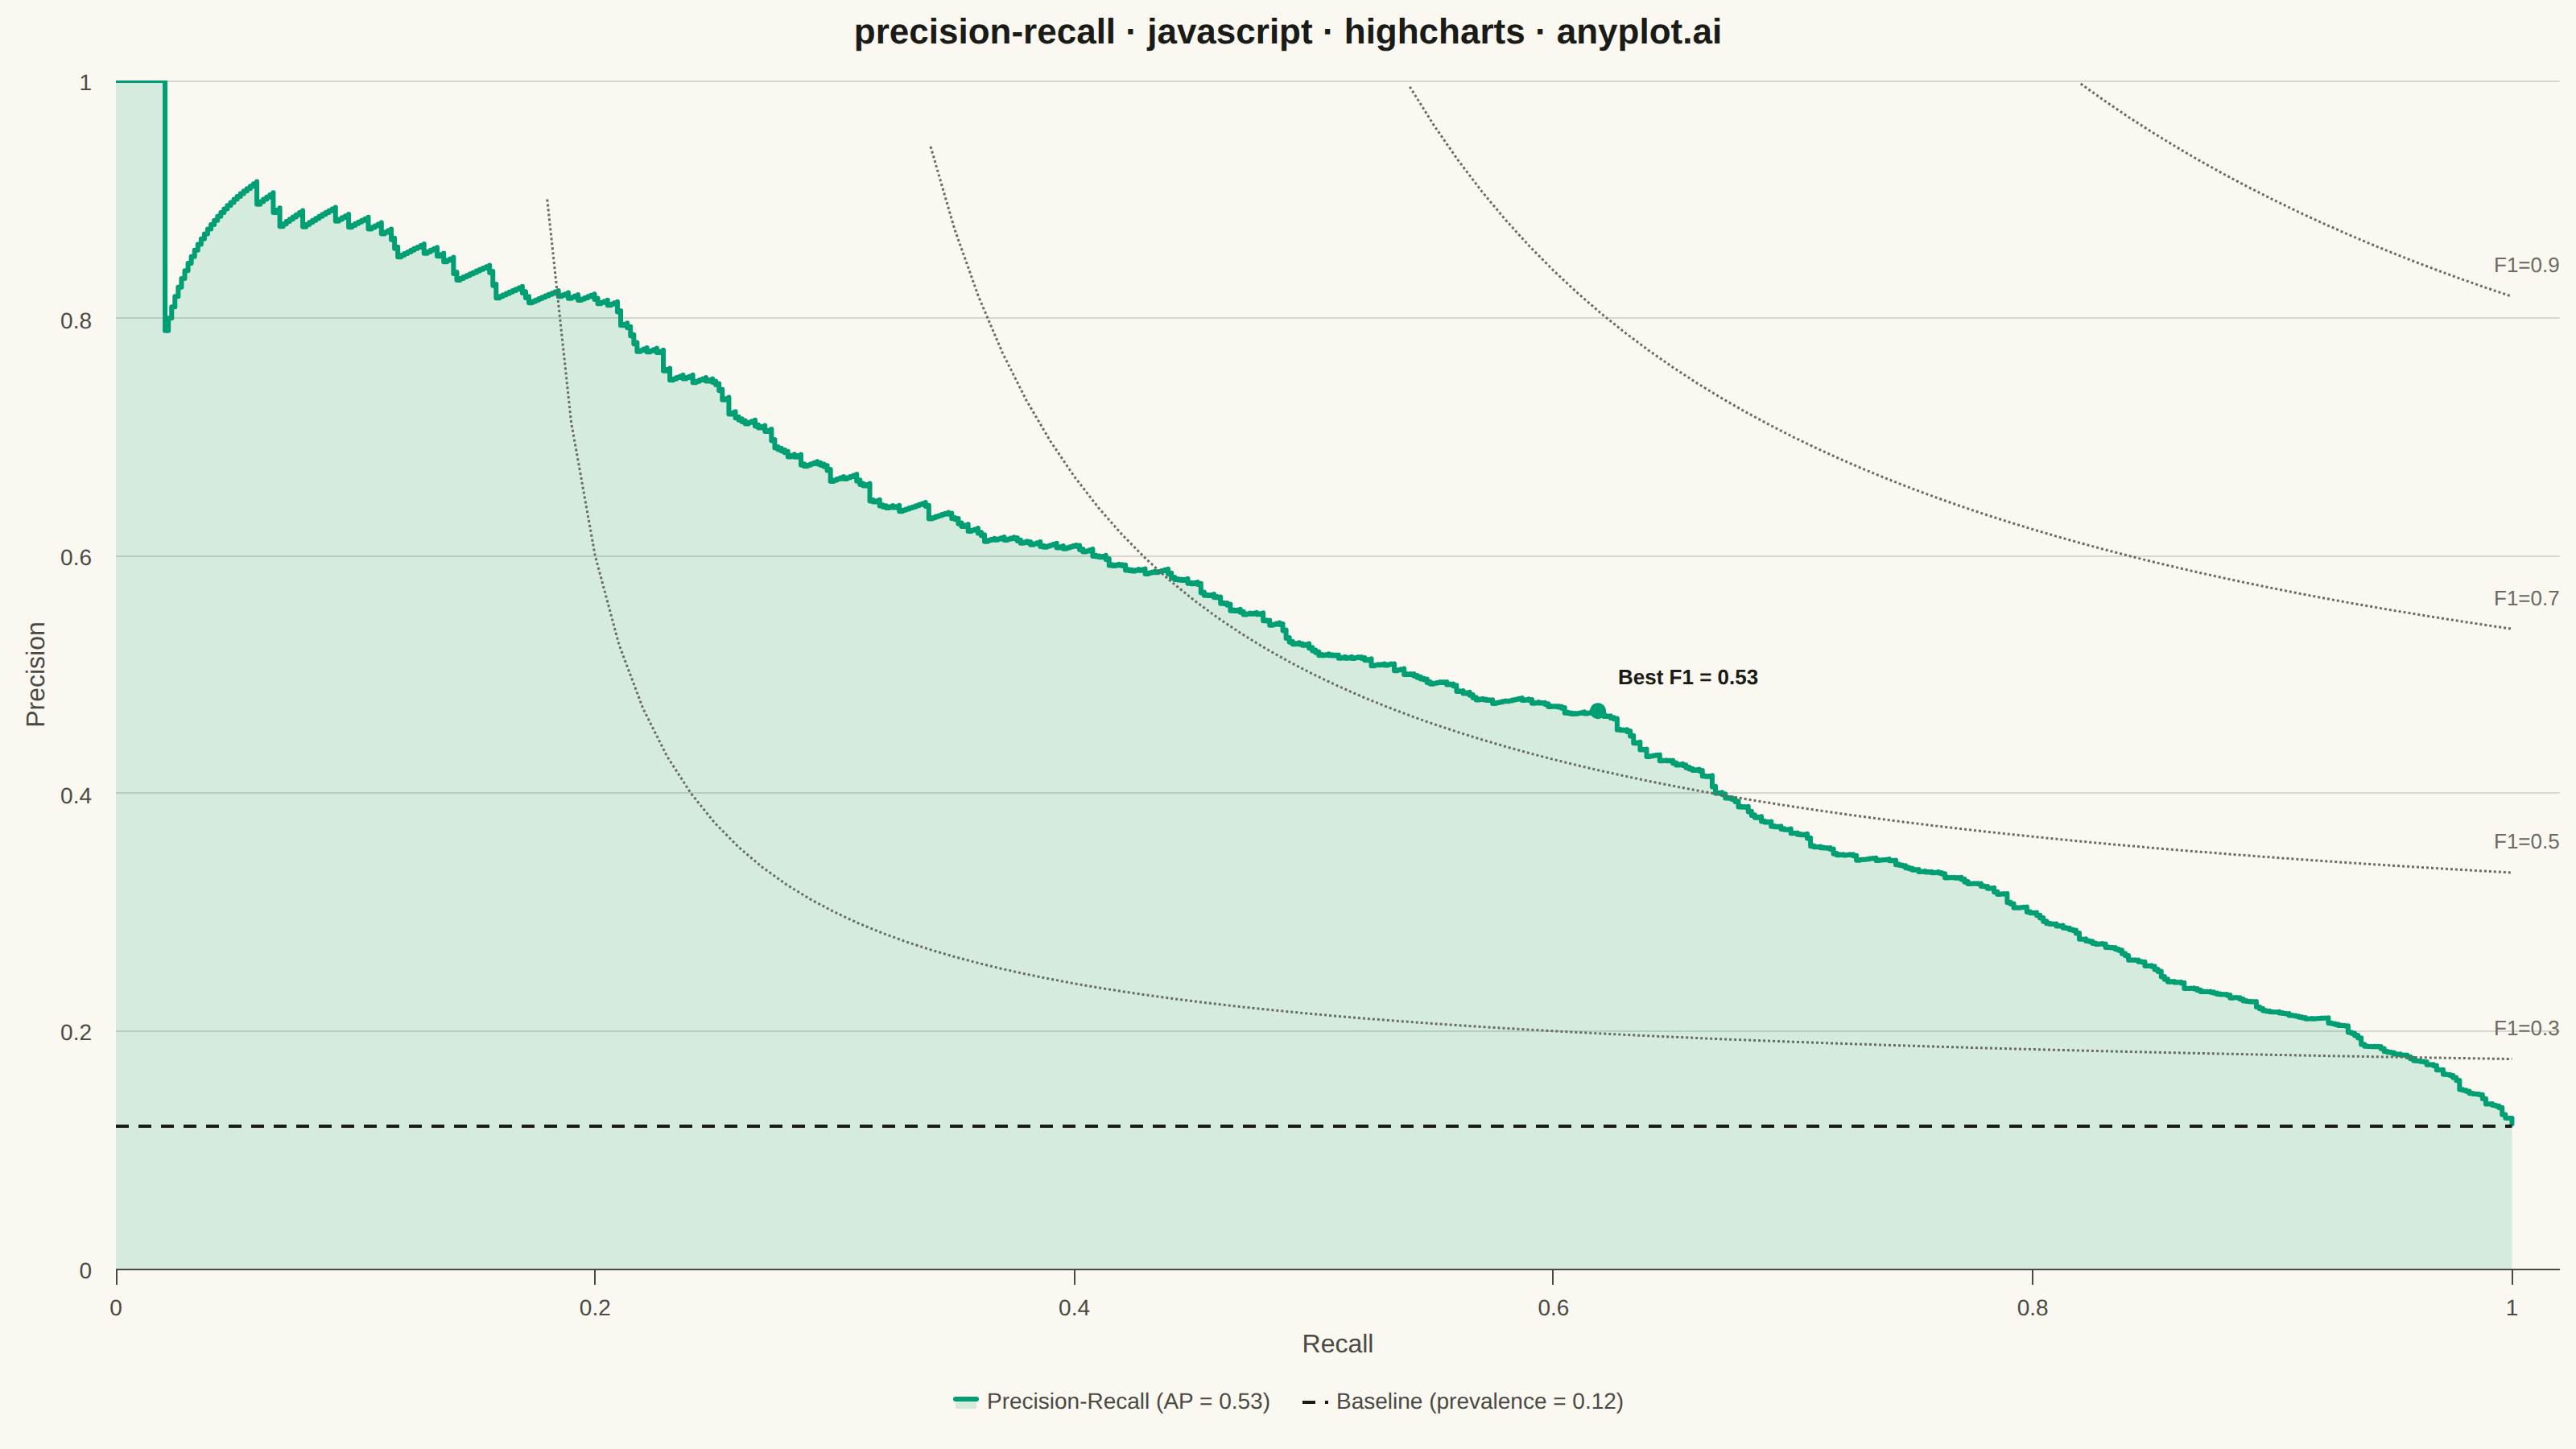
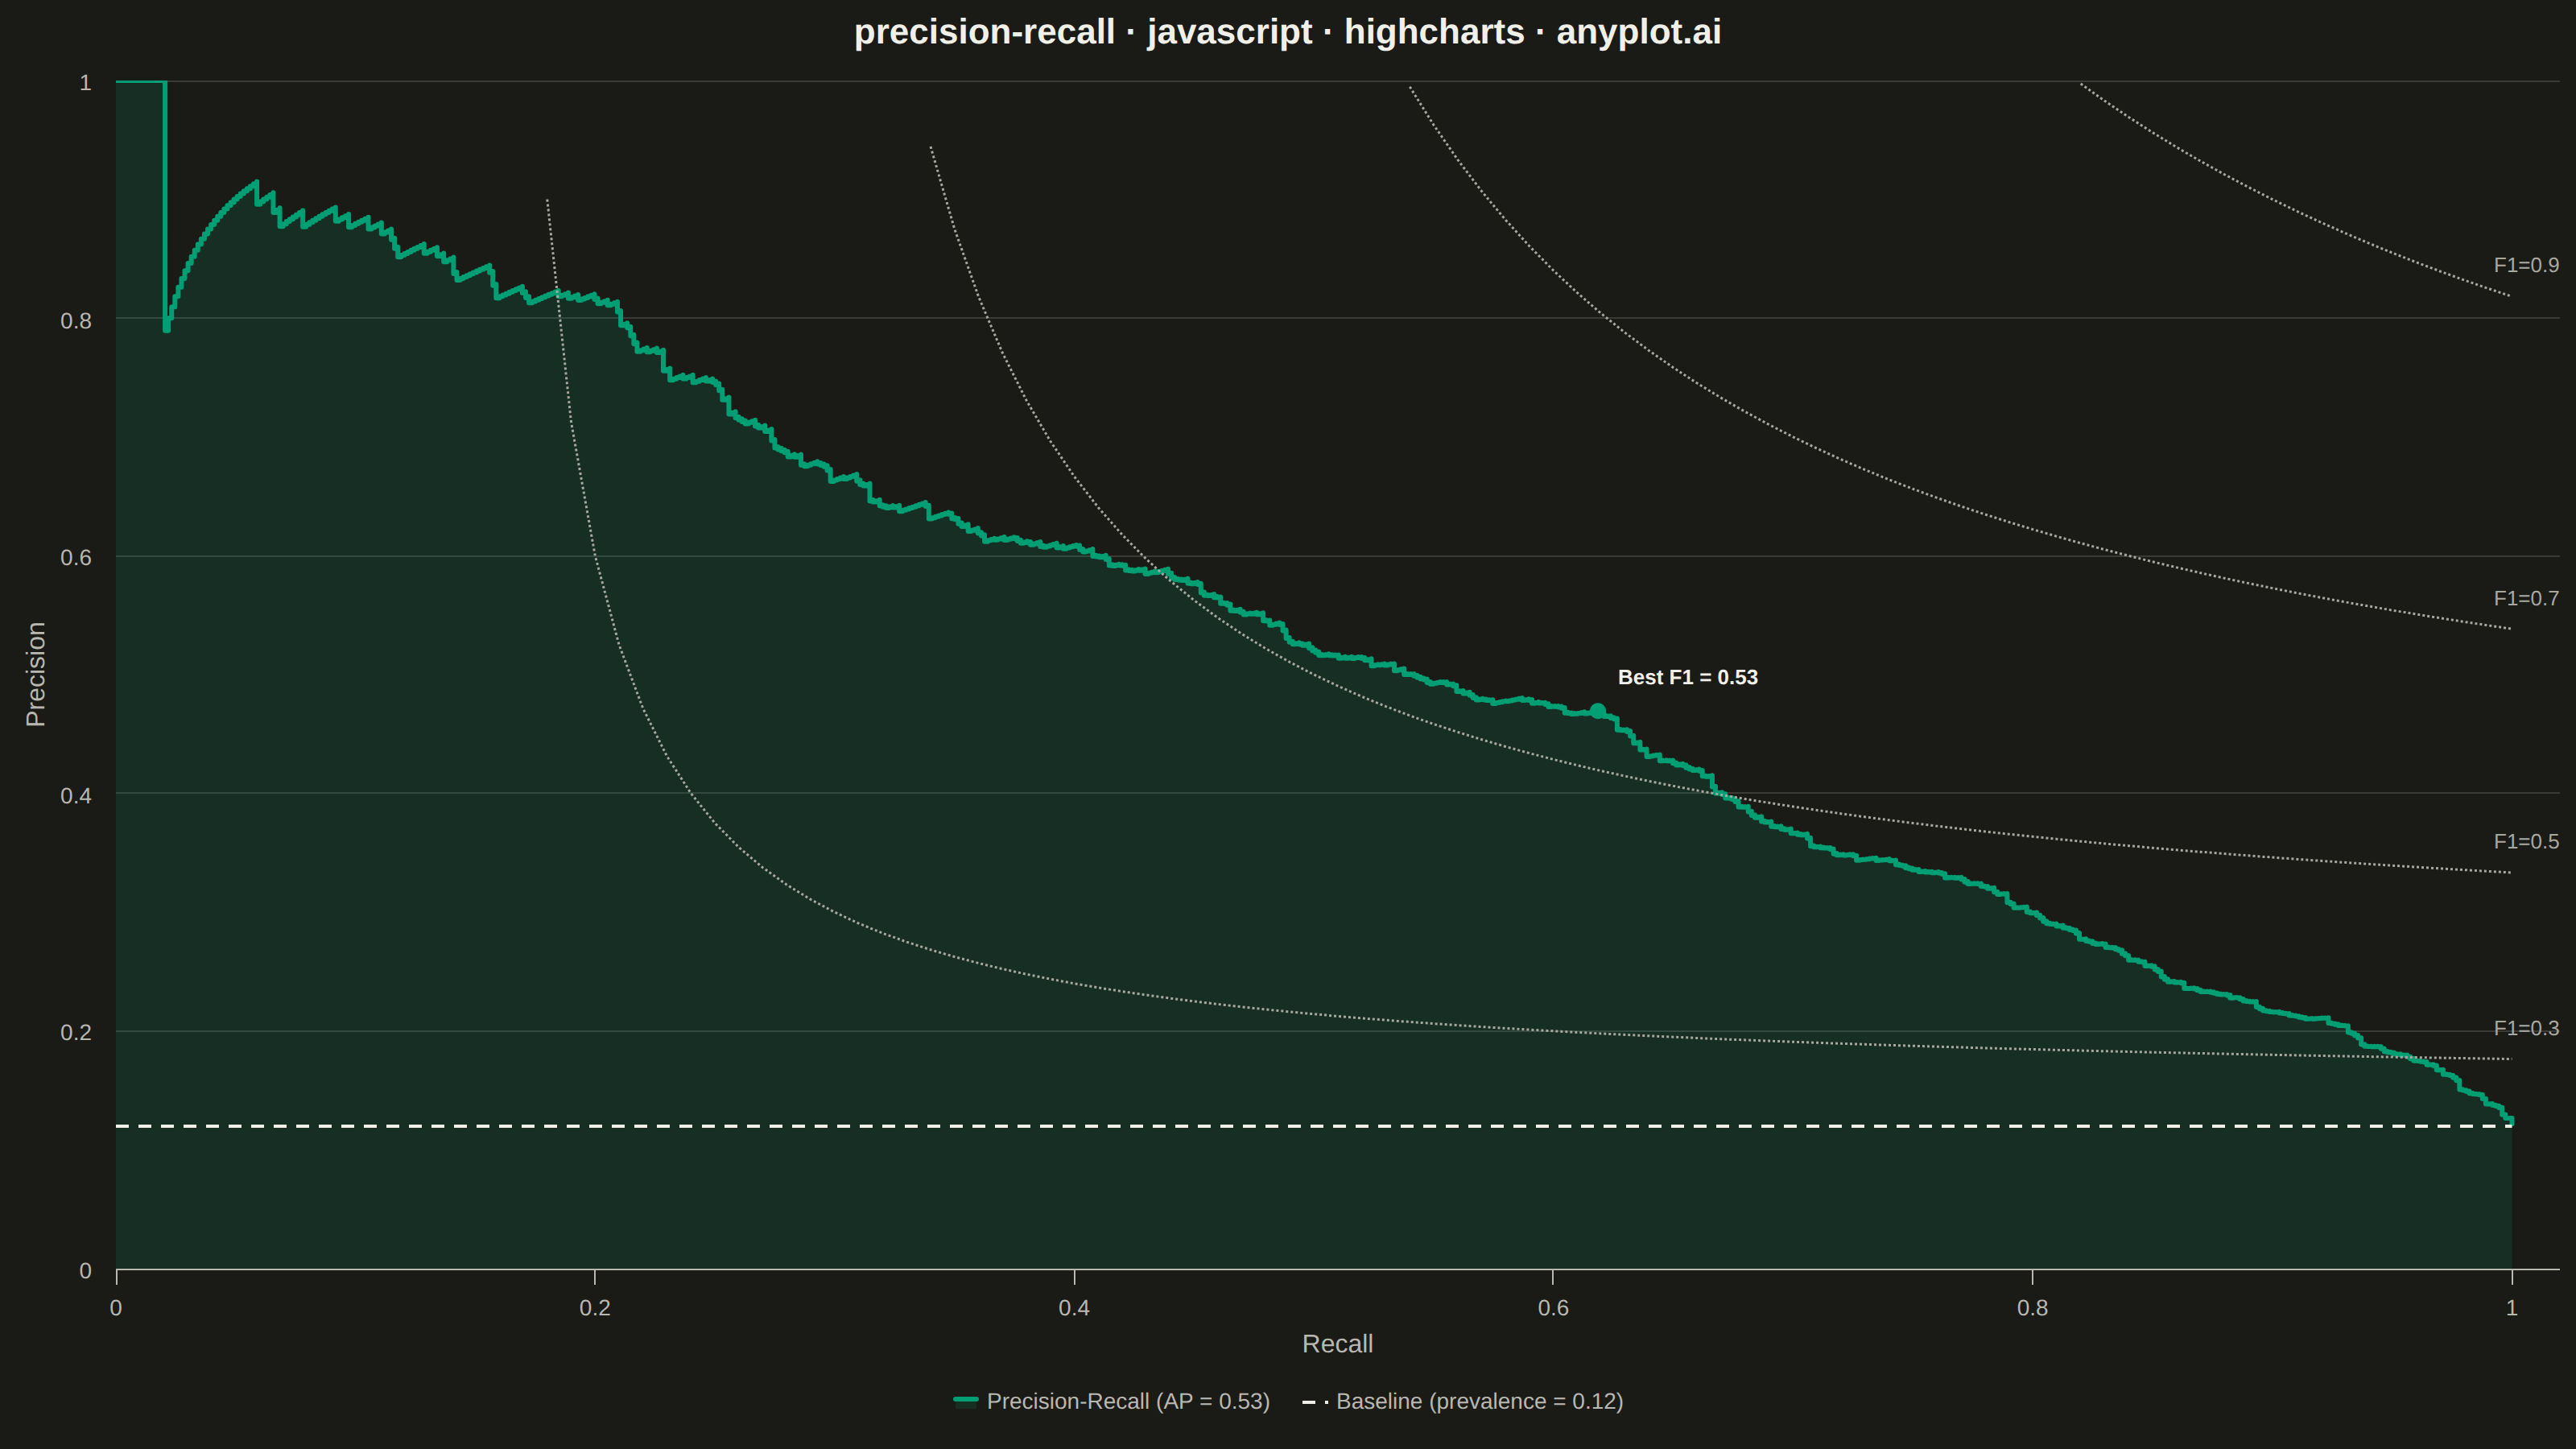
The same plot in 14 other libraries — JavaScript: Chart.js, D3.js, Apache ECharts, MUI X Charts; Python: Altair, Bokeh, lets-plot, Matplotlib, Plotly, plotnine, Pygal, Seaborn; R: ggplot2; Julia: Makie.jl. Compare all 15 side by side: Precision-Recall Curve in Python, R, Julia and JavaScript.
A Precision-Recall curve plots precision (positive predictive value) against recall (sensitivity) at various classification thresholds. This visualization is essential for evaluating binary classifiers on imbalanced datasets where accuracy alone is misleading. The area under the curve (Average Precision) summarizes classifier performance, with higher values indicating better performance.
// anyplot.ai
// precision-recall: Precision-Recall Curve
// Library: highcharts 12.6.0 | JavaScript 22.23.2
// Quality: 94/100 | Created: 2026-09-05

const t = window.ANYPLOT_TOKENS;
const muted = window.ANYPLOT_THEME === "dark" ? "#A8A79F" : "#6B6A63";

// --- Data: synthetic fraud-detection classifier scores (in-memory, deterministic) ---
let seed = 42;
function lcgRandom() {
  seed = (Math.imul(seed, 1664525) + 1013904223) >>> 0;
  return seed / 4294967296;
}
function gaussian() {
  const u1 = Math.max(lcgRandom(), 1e-9);
  const u2 = lcgRandom();
  return Math.sqrt(-2 * Math.log(u1)) * Math.cos(2 * Math.PI * u2);
}

const nSamples = 6000;
const positiveRate = 0.12;
const yTrue = [];
const yScores = [];
for (let i = 0; i < nSamples; i += 1) {
  const isPositive = lcgRandom() < positiveRate;
  yTrue.push(isPositive ? 1 : 0);
  const score = isPositive ? 0.62 + 0.2 * gaussian() : 0.32 + 0.2 * gaussian();
  yScores.push(Math.min(Math.max(score, 0), 1));
}

// --- Precision-recall curve (mirrors sklearn's threshold-sweep algorithm) --
const positives = yTrue.reduce((sum, label) => sum + label, 0);
const order = yScores
  .map((_, i) => i)
  .sort((a, b) => yScores[b] - yScores[a]);

const prPoints = [{ recall: 0, precision: 1 }];
let truePositives = 0;
let falsePositives = 0;
for (let i = 0; i < order.length; i += 1) {
  const idx = order[i];
  if (yTrue[idx] === 1) truePositives += 1;
  else falsePositives += 1;
  const isLastAtThreshold =
    i === order.length - 1 || yScores[order[i + 1]] !== yScores[idx];
  if (isLastAtThreshold) {
    prPoints.push({
      recall: truePositives / positives,
      precision: truePositives / (truePositives + falsePositives),
    });
  }
}

let averagePrecision = 0;
for (let i = 1; i < prPoints.length; i += 1) {
  averagePrecision +=
    (prPoints[i].recall - prPoints[i - 1].recall) * prPoints[i].precision;
}

// --- Best-F1 operating point (callout on the curve itself) -------------------
let bestF1Idx = 1;
let bestF1 = 0;
for (let i = 1; i < prPoints.length; i += 1) {
  const { recall, precision } = prPoints[i];
  const f1 = recall + precision > 0 ? (2 * recall * precision) / (recall + precision) : 0;
  if (f1 > bestF1) {
    bestF1 = f1;
    bestF1Idx = i;
  }
}

// --- Iso-F1 reference curves (spec note: contour lines for F1 reference) ---
const isoF1Values = [0.3, 0.5, 0.7, 0.9];
const isoF1Series = isoF1Values.map((f1) => {
  const points = [];
  for (let i = 1; i <= 100; i += 1) {
    const recall = i / 100;
    const denom = 2 * recall - f1;
    if (denom <= 0) continue;
    const precision = (f1 * recall) / denom;
    if (precision > 0 && precision <= 1) points.push([recall, precision]);
  }
  return {
    type: "line",
    name: `F1 = ${f1}`,
    data: points,
    color: muted,
    dashStyle: "ShortDot",
    lineWidth: 1.5,
    marker: { enabled: false },
    enableMouseTracking: false,
    showInLegend: false,
    dataLabels: {
      enabled: true,
      allowOverlap: true,
      align: "left",
      x: 6,
      y: -8,
      style: { color: muted, fontSize: "13px", fontWeight: "normal", textOutline: "none" },
      formatter() {
        return this.point.index === this.series.data.length - 1 ? `F1=${f1}` : null;
      },
    },
  };
});

// --- Chart -------------------------------------------------------------------
Highcharts.chart("container", {
  chart: {
    type: "line",
    backgroundColor: "transparent",
    animation: false,
    style: { fontFamily: "inherit" },
  },
  credits: { enabled: false },
  colors: t.palette,
  title: {
    text: "precision-recall · javascript · highcharts · anyplot.ai",
    style: { color: t.ink, fontSize: "22px", fontWeight: "600" },
  },
  xAxis: {
    title: { text: "Recall", style: { color: t.inkSoft, fontSize: "16px" } },
    min: 0,
    max: 1.02,
    tickInterval: 0.2,
    gridLineWidth: 0,
    lineColor: t.inkSoft,
    tickColor: t.inkSoft,
    labels: { style: { color: t.inkSoft, fontSize: "14px" } },
  },
  yAxis: {
    title: { text: "Precision", style: { color: t.inkSoft, fontSize: "16px" } },
    min: 0,
    max: 1.0,
    tickInterval: 0.2,
    endOnTick: false,
    gridLineColor: t.grid,
    lineColor: t.inkSoft,
    tickColor: t.inkSoft,
    labels: { style: { color: t.inkSoft, fontSize: "14px" } },
  },
  legend: {
    itemStyle: { color: t.inkSoft, fontSize: "14px" },
    itemHoverStyle: { color: t.ink },
  },
  plotOptions: {
    series: { animation: false },
  },
  series: [
    {
      type: "area",
      name: `Precision-Recall (AP = ${averagePrecision.toFixed(2)})`,
      data: prPoints.map((p, i) =>
        i === bestF1Idx
          ? {
              x: p.recall,
              y: p.precision,
              marker: { enabled: true, radius: 5, fillColor: t.palette[0] },
              dataLabels: {
                enabled: true,
                format: `Best F1 = ${bestF1.toFixed(2)}`,
                align: "left",
                x: 8,
                y: -10,
                style: { color: t.ink, fontSize: "13px", fontWeight: "600", textOutline: "none" },
              },
            }
          : { x: p.recall, y: p.precision },
      ),
      step: "left",
      color: t.palette[0],
      lineWidth: 3,
      fillOpacity: 0.15,
      marker: { enabled: false },
      dataLabels: { enabled: false },
    },
    {
      type: "line",
      name: `Baseline (prevalence = ${positiveRate.toFixed(2)})`,
      data: [
        [0, positiveRate],
        [1, positiveRate],
      ],
      color: t.ink,
      dashStyle: "Dash",
      lineWidth: 2,
      marker: { enabled: false },
      enableMouseTracking: false,
    },
    ...isoF1Series,
  ],
});
Runnable source as JSON, for any HTTP client: https://api.anyplot.ai/specs/precision-recall/highcharts/code. Any spec id and library id listed in llms-full.txt fit the same URL shape; every URL below is complete and callable.
{
  "spec_id": "precision-recall",
  "language": "javascript",
  "library": "highcharts",
  "page": "https://anyplot.ai/precision-recall/javascript/highcharts",
  "hub": "https://anyplot.ai/precision-recall",
  "code_json": "https://api.anyplot.ai/specs/precision-recall/highcharts/code",
  "spec_json": "https://api.anyplot.ai/specs/precision-recall",
  "render_light_png": "https://storage.googleapis.com/anyplot-images/plots/precision-recall/javascript/highcharts/plot-light.png",
  "render_dark_png": "https://storage.googleapis.com/anyplot-images/plots/precision-recall/javascript/highcharts/plot-dark.png",
  "interactive_light_html": "https://storage.googleapis.com/anyplot-images/plots/precision-recall/javascript/highcharts/plot-light.html",
  "interactive_dark_html": "https://storage.googleapis.com/anyplot-images/plots/precision-recall/javascript/highcharts/plot-dark.html",
  "quality_score": 94.0,
  "license": "MIT",
  "guide": "https://anyplot.ai/llms.txt"
}
Part of Precision-Recall Curve on anyplot.ai.