The same plot in 14 other libraries — Python: Altair, Bokeh, lets-plot, Matplotlib, Plotly, plotnine, Pygal, Seaborn; R: ggplot2; JavaScript: Chart.js, D3.js, Apache ECharts, Highcharts, MUI X Charts. Compare all 15 side by side: Precision-Recall Curve in Python, R, Julia and JavaScript.
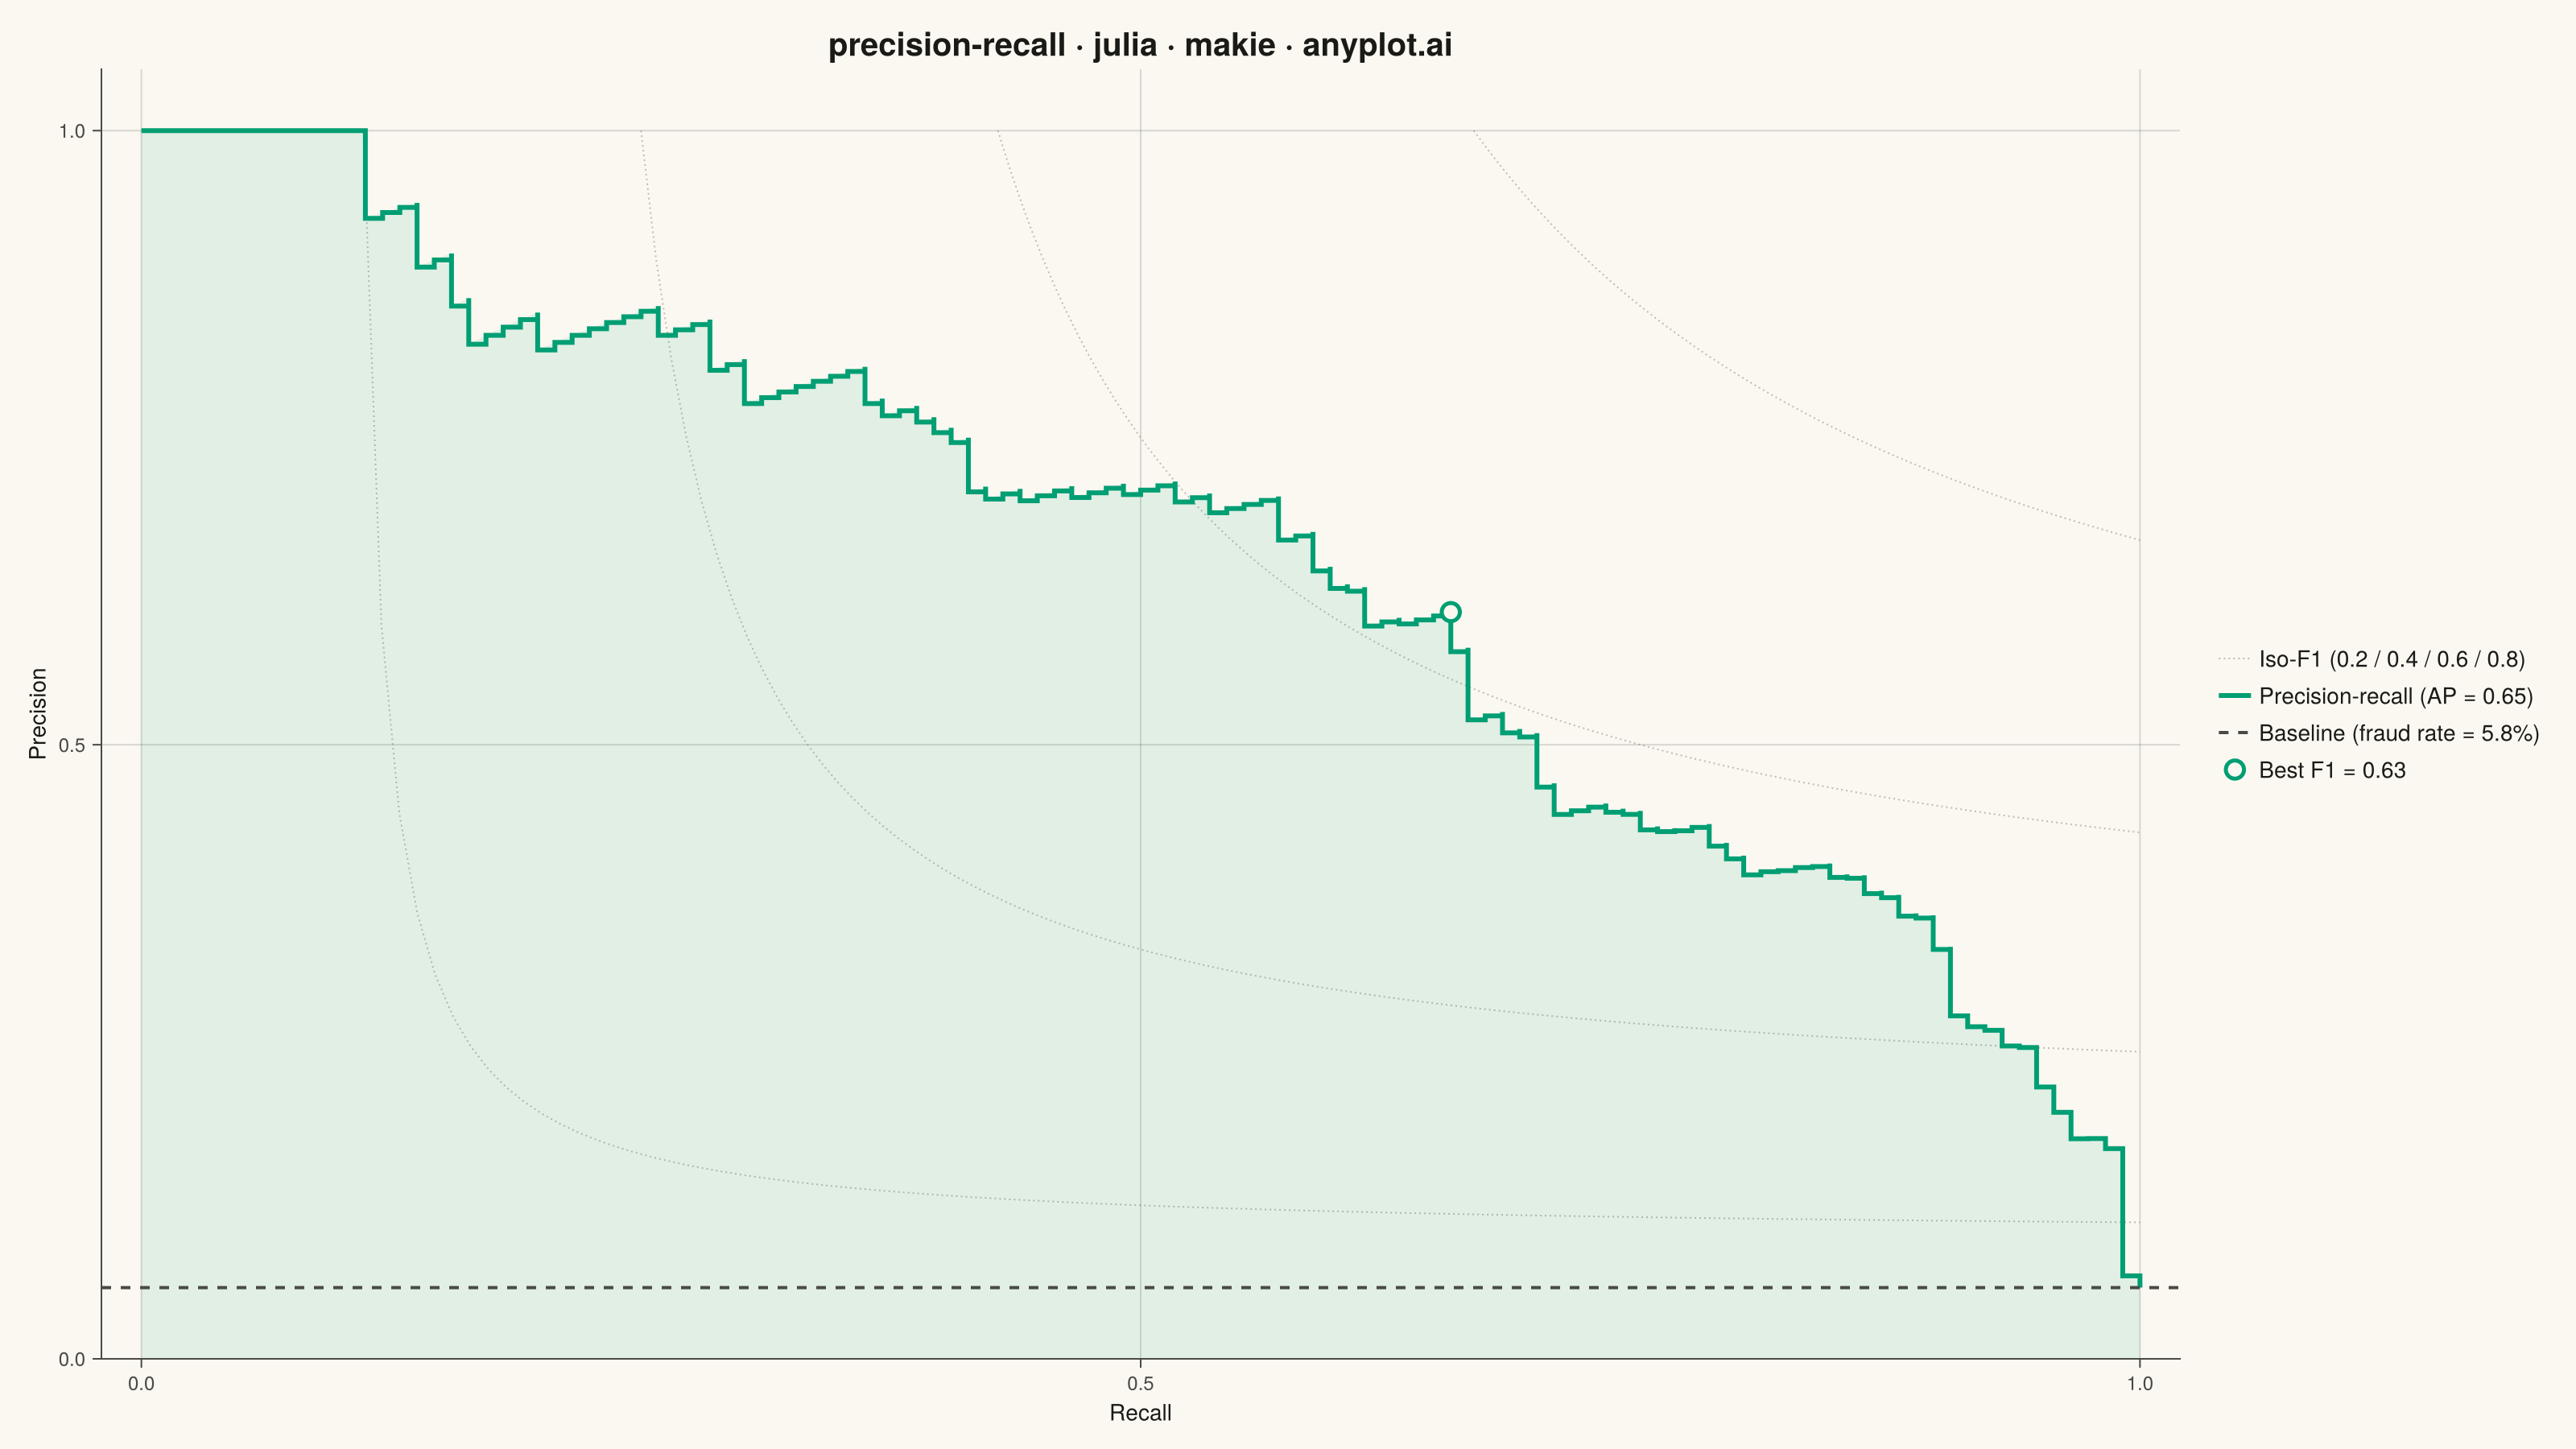
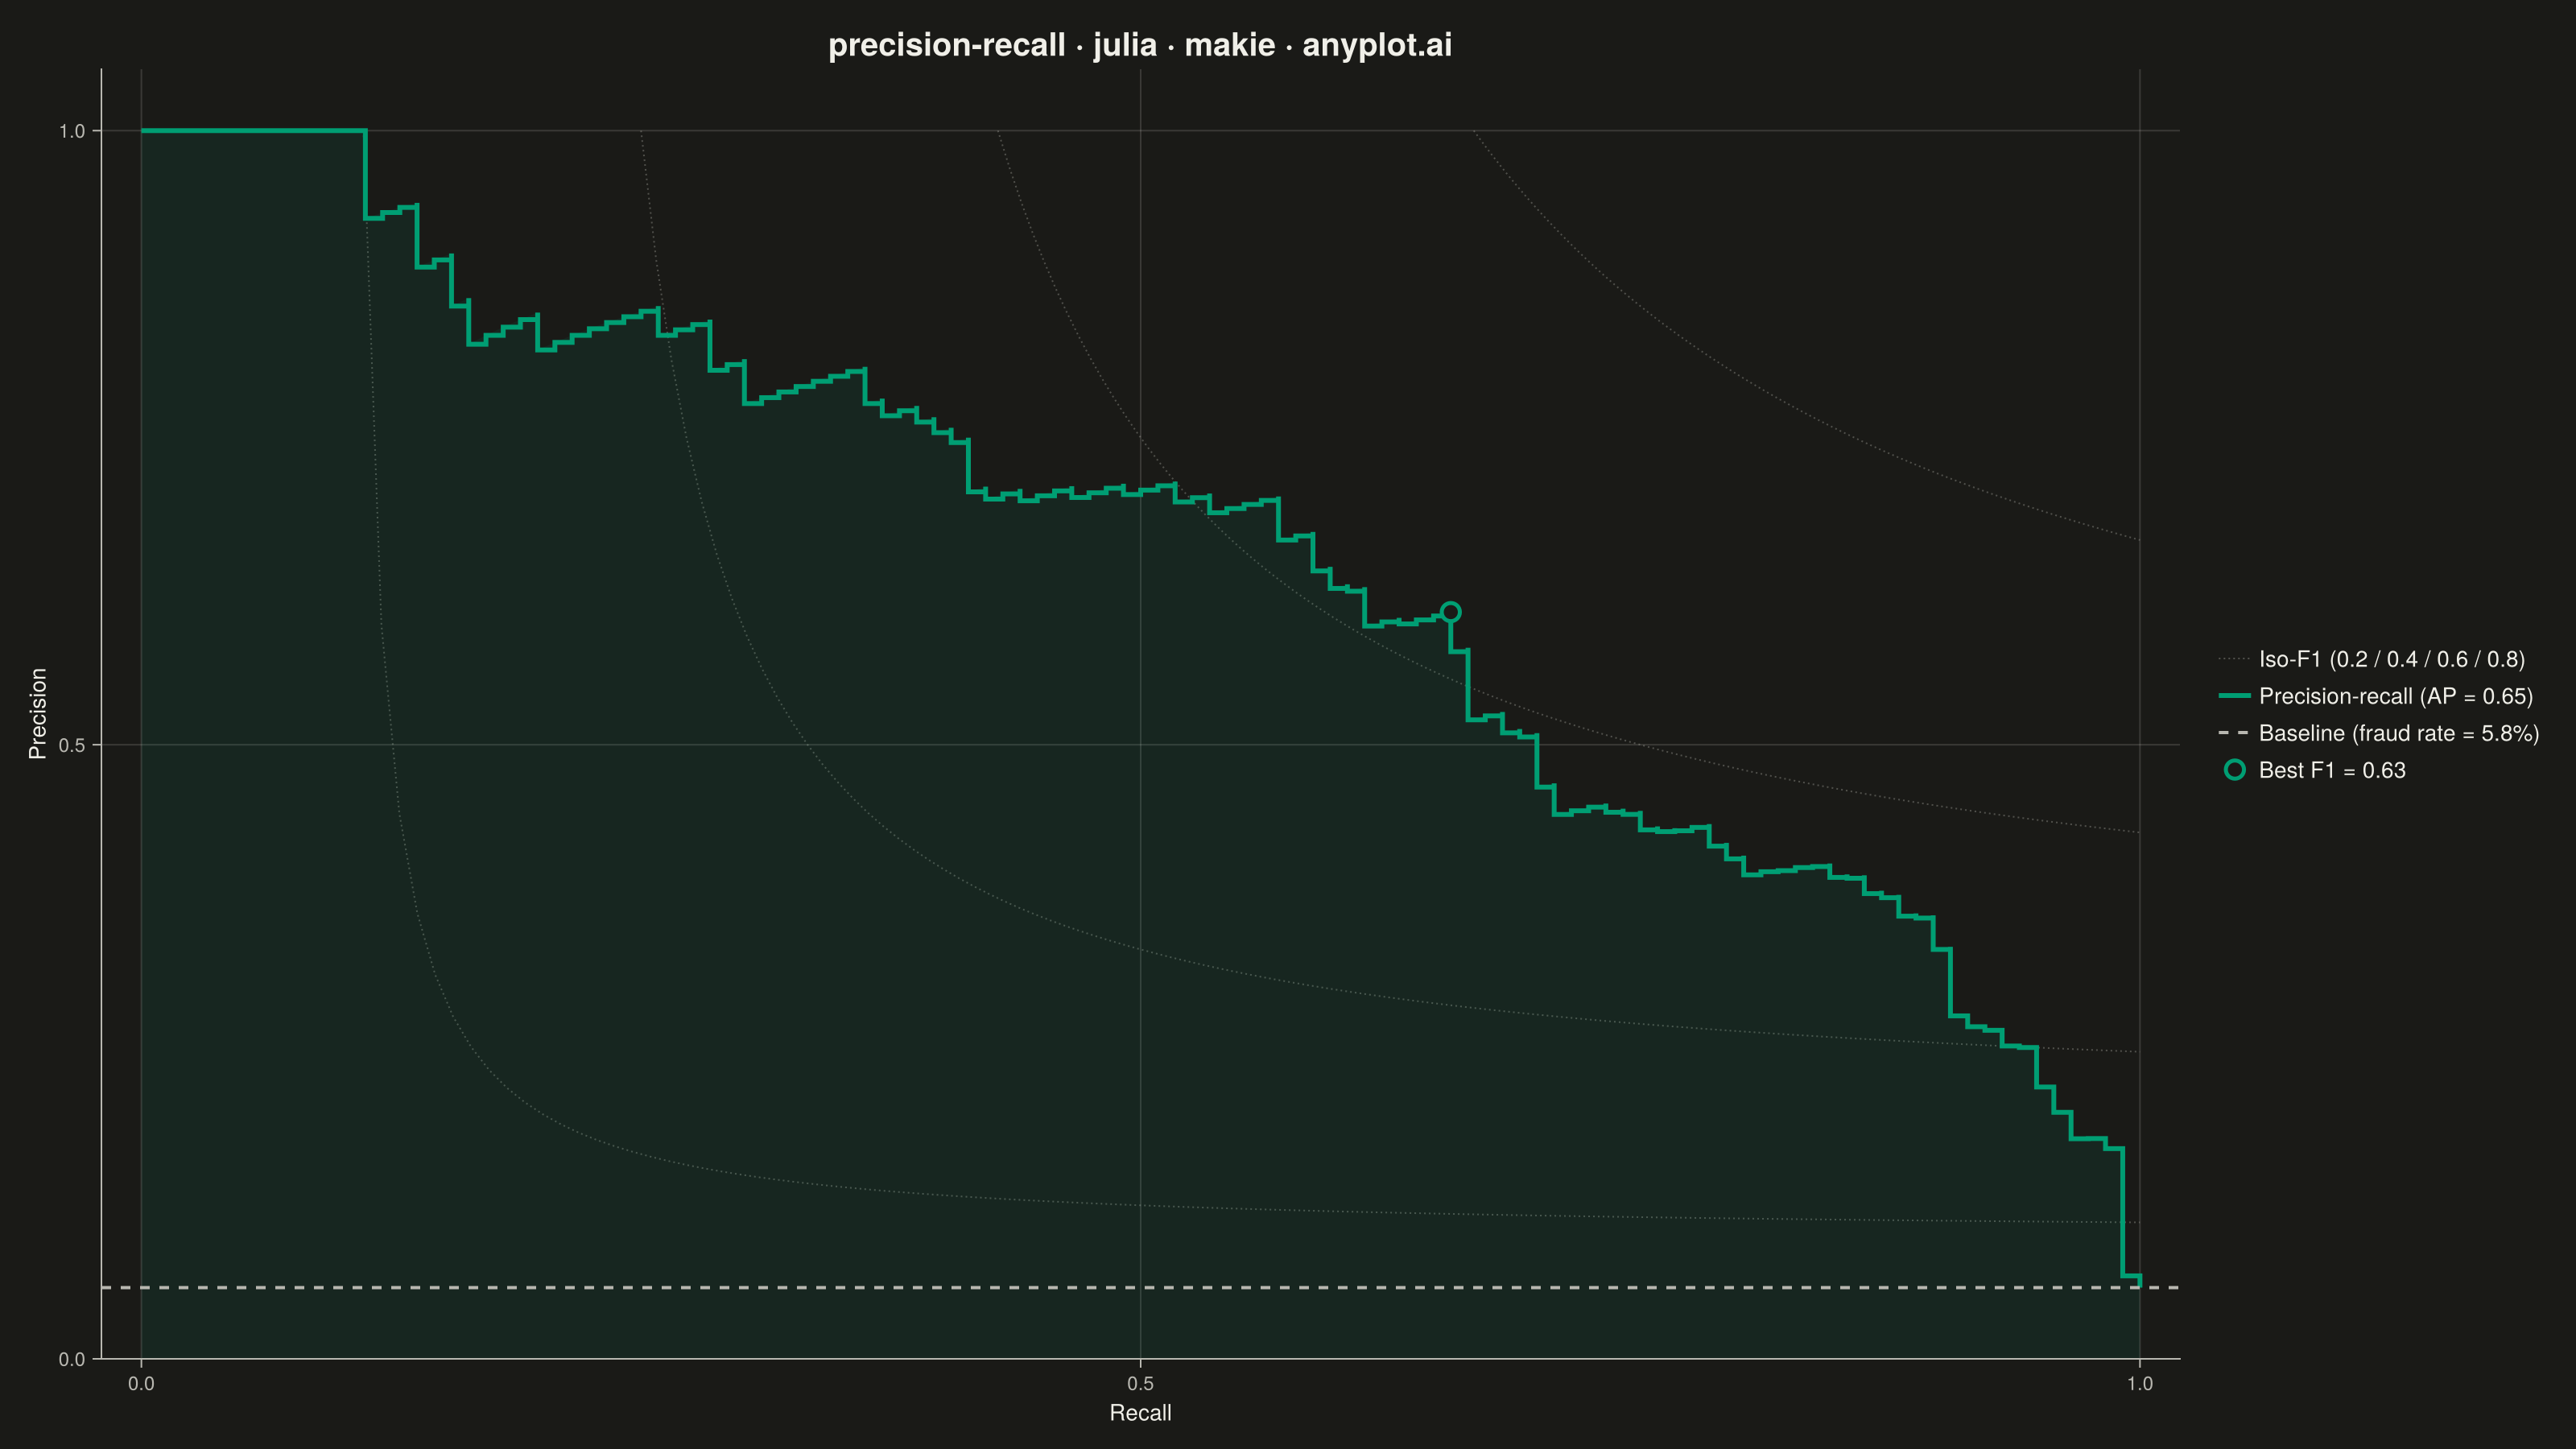
A Precision-Recall curve plots precision (positive predictive value) against recall (sensitivity) at various classification thresholds. This visualization is essential for evaluating binary classifiers on imbalanced datasets where accuracy alone is misleading. The area under the curve (Average Precision) summarizes classifier performance, with higher values indicating better performance.
# anyplot.ai
# precision-recall: Precision-Recall Curve
# Library: makie 0.21.9 | Julia 1.11.9
# Quality: 93/100 | Created: 2026-09-05

using CairoMakie
using Colors
using Random

Random.seed!(42)

# --- Theme tokens -----------------------------------------------------------
const THEME    = get(ENV, "ANYPLOT_THEME", "light")
const PAGE_BG  = THEME == "light" ? colorant"#FAF8F1" : colorant"#1A1A17"
const INK      = THEME == "light" ? colorant"#1A1A17" : colorant"#F0EFE8"
const INK_SOFT = THEME == "light" ? colorant"#4A4A44" : colorant"#B8B7B0"
const IMPRINT_PALETTE = [
    colorant"#009E73", colorant"#C475FD", colorant"#4467A3", colorant"#BD8233",
    colorant"#AE3030", colorant"#2ABCCD", colorant"#954477", colorant"#99B314",
]

# --- Data ---------------------------------------------------------------
# Fraud-detection scenario: rare positive class (fraudulent transactions)
# scored by a classifier's predicted probability.
n_transactions = 2000
positive_rate = 0.06
is_fraud = Int.(rand(n_transactions) .< positive_rate)

# Simulated classifier scores: fraud cases carry a stronger latent signal,
# on top of noise that creates realistic overlap with legitimate cases.
latent_signal = 2.6 .* is_fraud .+ 1.2 .* randn(n_transactions)
risk_score = 1 ./ (1 .+ exp.(-latent_signal))

# --- Precision / recall at every threshold (descending score order) --------
order = sortperm(risk_score; rev = true)
sorted_labels = is_fraud[order]

n_positives = sum(is_fraud)
true_positives = cumsum(sorted_labels)
predicted_positives = collect(1:n_transactions)

precision = true_positives ./ predicted_positives
recall = true_positives ./ n_positives

# Prepend the (recall=0, precision=1) anchor point (standard PR-curve convention)
recall_curve = vcat(0.0, recall)
precision_curve = vcat(1.0, precision)

average_precision = sum(
    (recall_curve[i] - recall_curve[i - 1]) * precision_curve[i]
    for i in 2:length(recall_curve)
)
baseline = n_positives / n_transactions

# Operating point that maximizes F1 = 2PR/(P+R) — the single most useful
# threshold for a practitioner, highlighted as a focal point on the curve.
f1_scores = [p + r > 0 ? 2 * p * r / (p + r) : 0.0 for (p, r) in zip(precision, recall)]
best_idx = argmax(f1_scores)
best_f1 = f1_scores[best_idx]
best_recall = recall[best_idx]
best_precision = precision[best_idx]

# --- Plot ---------------------------------------------------------------
fig = Figure(
    resolution      = (1600, 900),
    fontsize        = 14,
    backgroundcolor = PAGE_BG,
)

ax = Axis(
    fig[1, 1];
    title              = "precision-recall · julia · makie · anyplot.ai",
    titlesize          = 20,
    titlecolor         = INK,
    xlabel             = "Recall",
    ylabel             = "Precision",
    xlabelsize         = 14,
    ylabelsize         = 14,
    xlabelcolor        = INK,
    ylabelcolor        = INK,
    xticklabelsize     = 12,
    yticklabelsize     = 12,
    xticklabelcolor    = INK_SOFT,
    yticklabelcolor    = INK_SOFT,
    xtickcolor         = INK_SOFT,
    ytickcolor         = INK_SOFT,
    backgroundcolor    = PAGE_BG,
    topspinevisible    = false,
    rightspinevisible  = false,
    leftspinecolor     = INK_SOFT,
    bottomspinecolor   = INK_SOFT,
    xgridcolor         = RGBAf(INK.r, INK.g, INK.b, 0.15),
    ygridcolor         = RGBAf(INK.r, INK.g, INK.b, 0.15),
    xminorgridvisible  = false,
    yminorgridvisible  = false,
)
xlims!(ax, -0.02, 1.02)
ylims!(ax, 0.0, 1.05)

# Iso-F1 reference contours (spec Notes: "consider showing iso-F1 curves"),
# drawn first as light background context so the data curve stays on top.
f1_levels = (0.2, 0.4, 0.6, 0.8)
for (i, f1) in enumerate(f1_levels)
    r_min = f1 / (2 - f1)
    r_grid = collect(range(r_min, 1.0; length = 100))
    p_grid = f1 .* r_grid ./ (2 .* r_grid .- f1)
    lines!(
        ax, r_grid, p_grid;
        color = (INK_SOFT, 0.35),
        linestyle = :dot,
        linewidth = 1.0,
        label = i == 1 ? "Iso-F1 (0.2 / 0.4 / 0.6 / 0.8)" : nothing,
    )
end

# Light fill under the curve reinforces the Average Precision area visually.
band!(
    ax, recall_curve, zeros(length(recall_curve)), precision_curve;
    color = (IMPRINT_PALETTE[1], 0.10),
)

stairs!(
    ax, recall_curve, precision_curve;
    step = :post,
    color = IMPRINT_PALETTE[1],
    linewidth = 3.0,
    label = "Precision-recall (AP = $(round(average_precision, digits = 2)))",
)
hlines!(
    ax, [baseline];
    color = INK_SOFT,
    linestyle = :dash,
    linewidth = 2.0,
    label = "Baseline (fraud rate = $(round(100 * baseline, digits = 1))%)",
)

# Best-F1 operating point — a halo marker in brand green keeps the data
# storytelling anchored on the single most actionable threshold.
scatter!(
    ax, [best_recall], [best_precision];
    color = PAGE_BG,
    strokecolor = IMPRINT_PALETTE[1],
    strokewidth = 2.5,
    markersize = 16,
    marker = :circle,
    label = "Best F1 = $(round(best_f1, digits = 2))",
)

Legend(
    fig[1, 2], ax;
    backgroundcolor = PAGE_BG,
    labelcolor = INK,
    framevisible = false,
)

# --- Save -----------------------------------------------------------------
save("plot-$(THEME).png", fig; px_per_unit = 2)
Runnable source as JSON, for any HTTP client: https://api.anyplot.ai/specs/precision-recall/makie/code. Any spec id and library id listed in llms-full.txt fit the same URL shape; every URL below is complete and callable.
{
  "spec_id": "precision-recall",
  "language": "julia",
  "library": "makie",
  "page": "https://anyplot.ai/precision-recall/julia/makie",
  "hub": "https://anyplot.ai/precision-recall",
  "code_json": "https://api.anyplot.ai/specs/precision-recall/makie/code",
  "spec_json": "https://api.anyplot.ai/specs/precision-recall",
  "render_light_png": "https://storage.googleapis.com/anyplot-images/plots/precision-recall/julia/makie/plot-light.png",
  "render_dark_png": "https://storage.googleapis.com/anyplot-images/plots/precision-recall/julia/makie/plot-dark.png",
  "quality_score": 93.0,
  "license": "MIT",
  "guide": "https://anyplot.ai/llms.txt"
}
Part of Precision-Recall Curve on anyplot.ai.