The same plot in 14 other libraries — JavaScript: Chart.js, D3.js, Highcharts, MUI X Charts; Python: Altair, Bokeh, lets-plot, Matplotlib, Plotly, plotnine, Pygal, Seaborn; R: ggplot2; Julia: Makie.jl. Compare all 15 side by side: Precision-Recall Curve in Python, R, Julia and JavaScript.
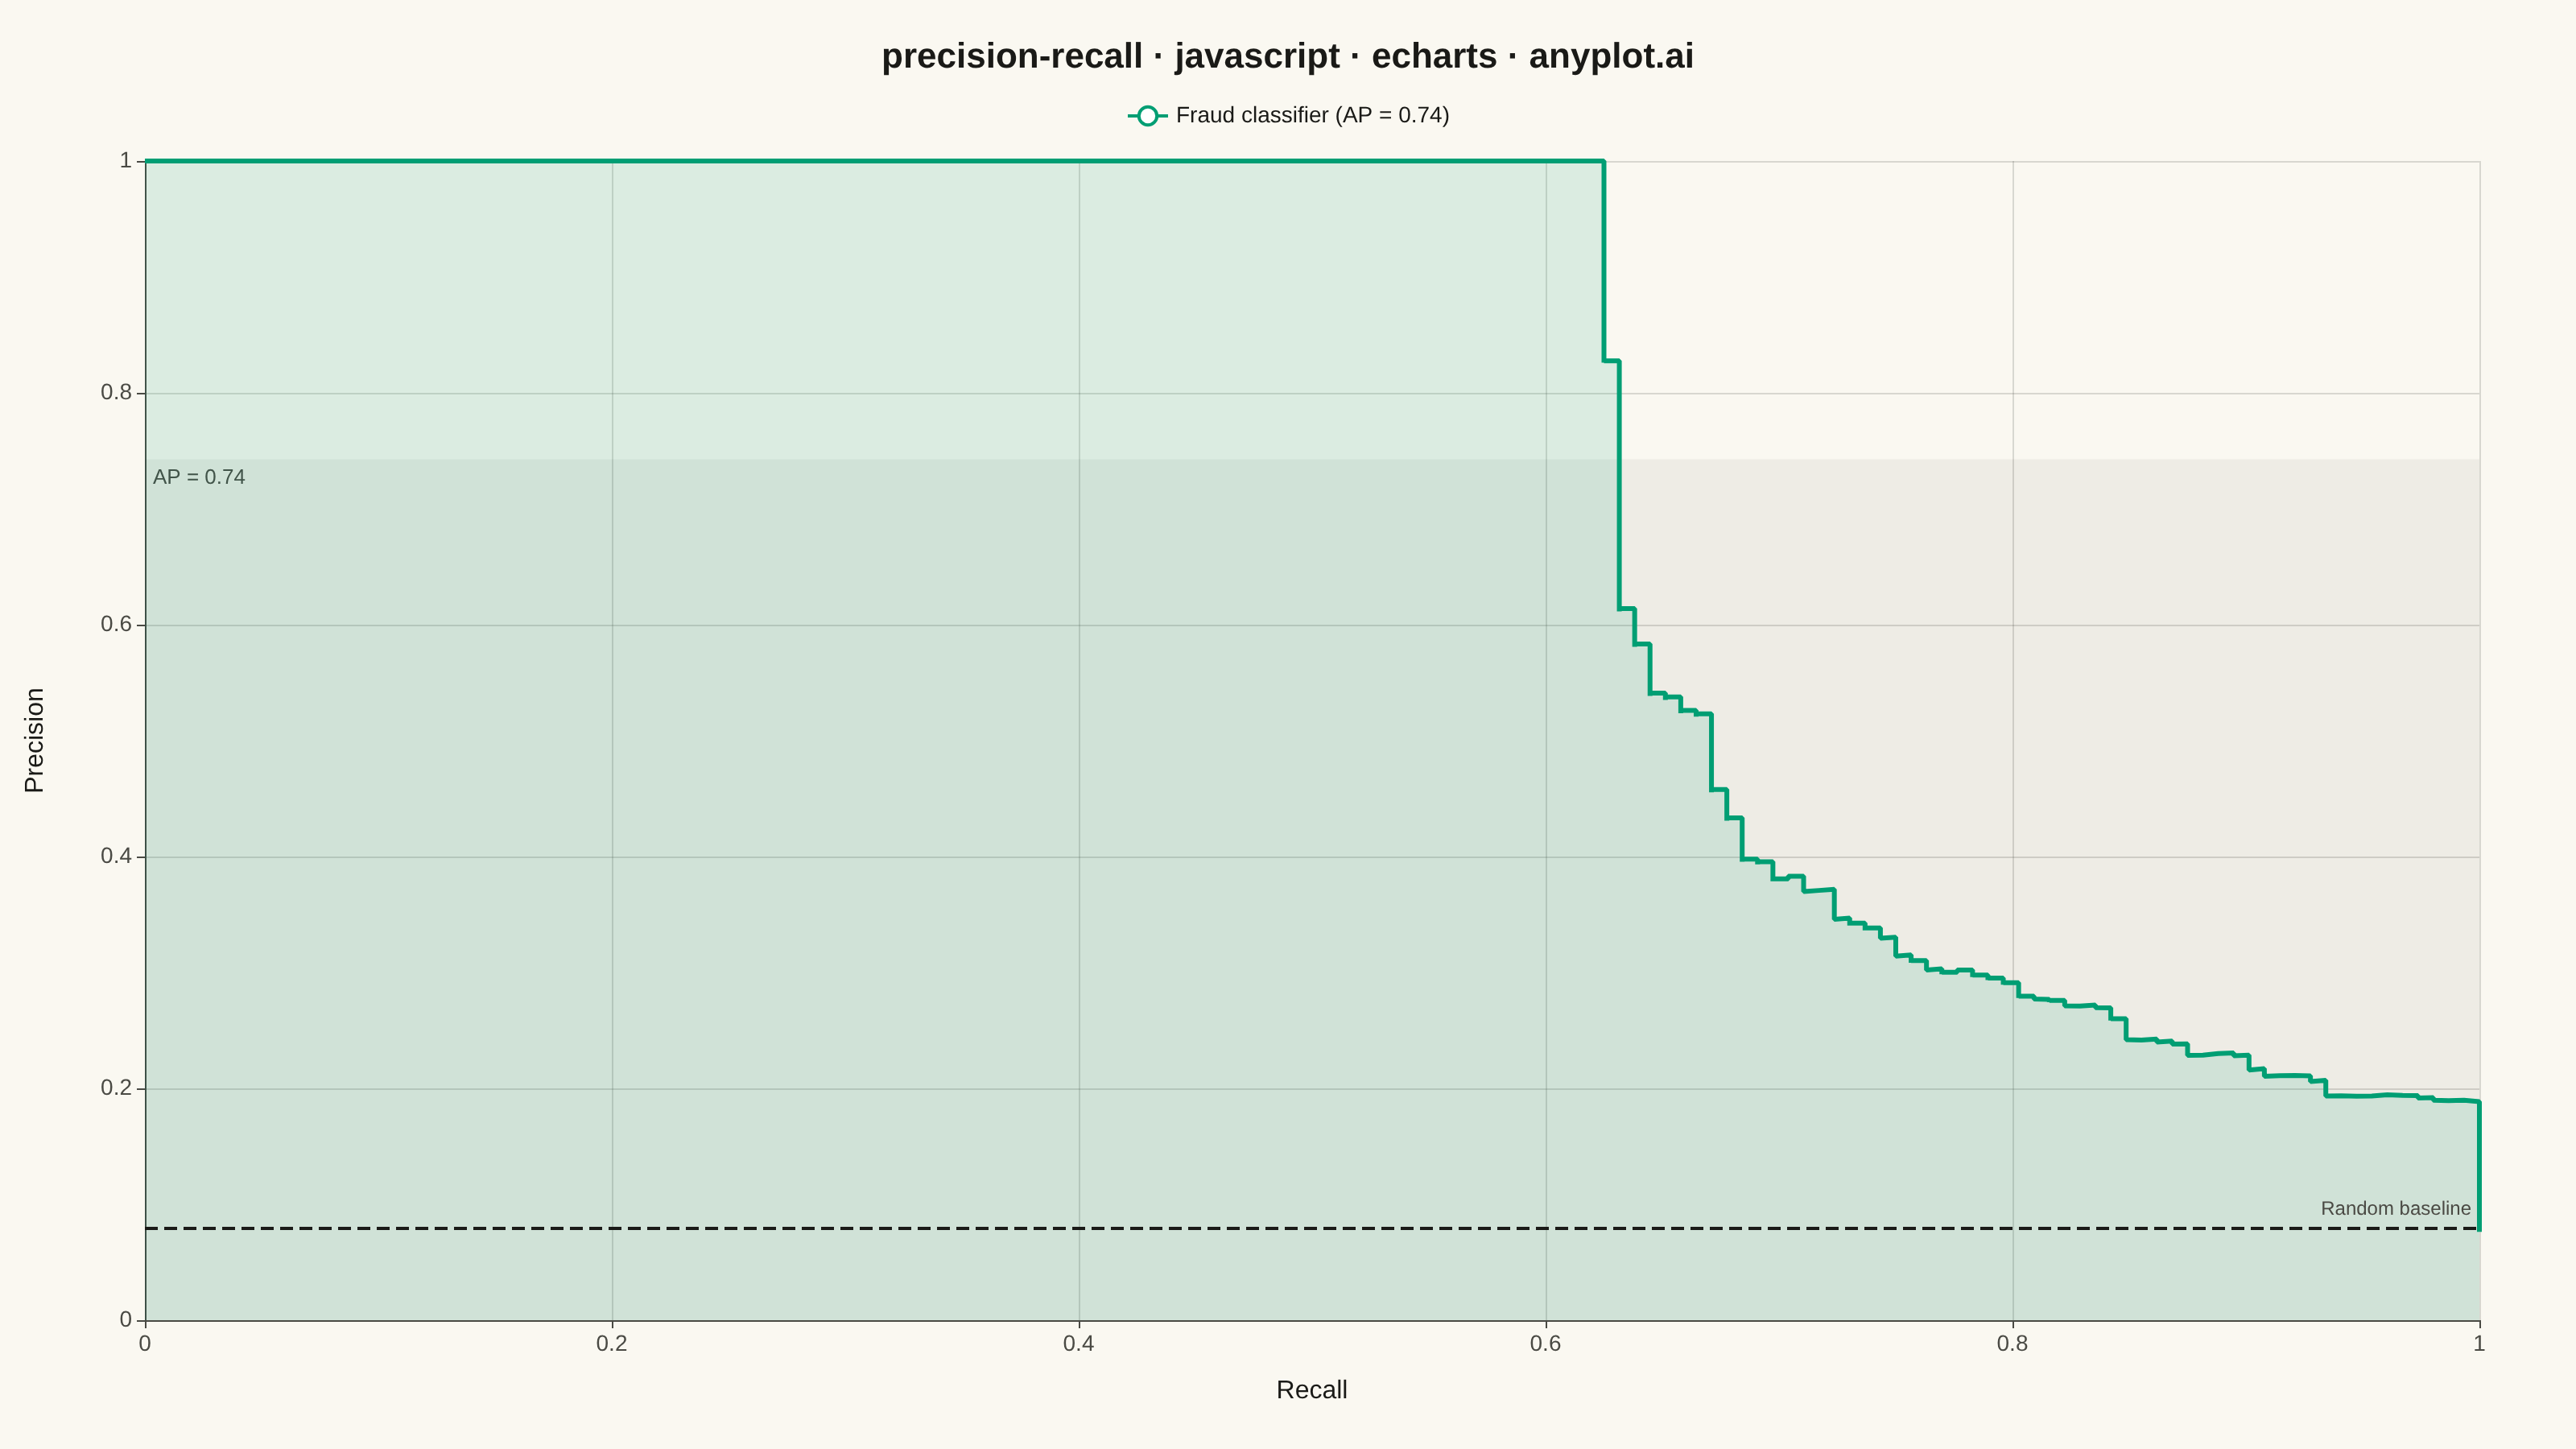
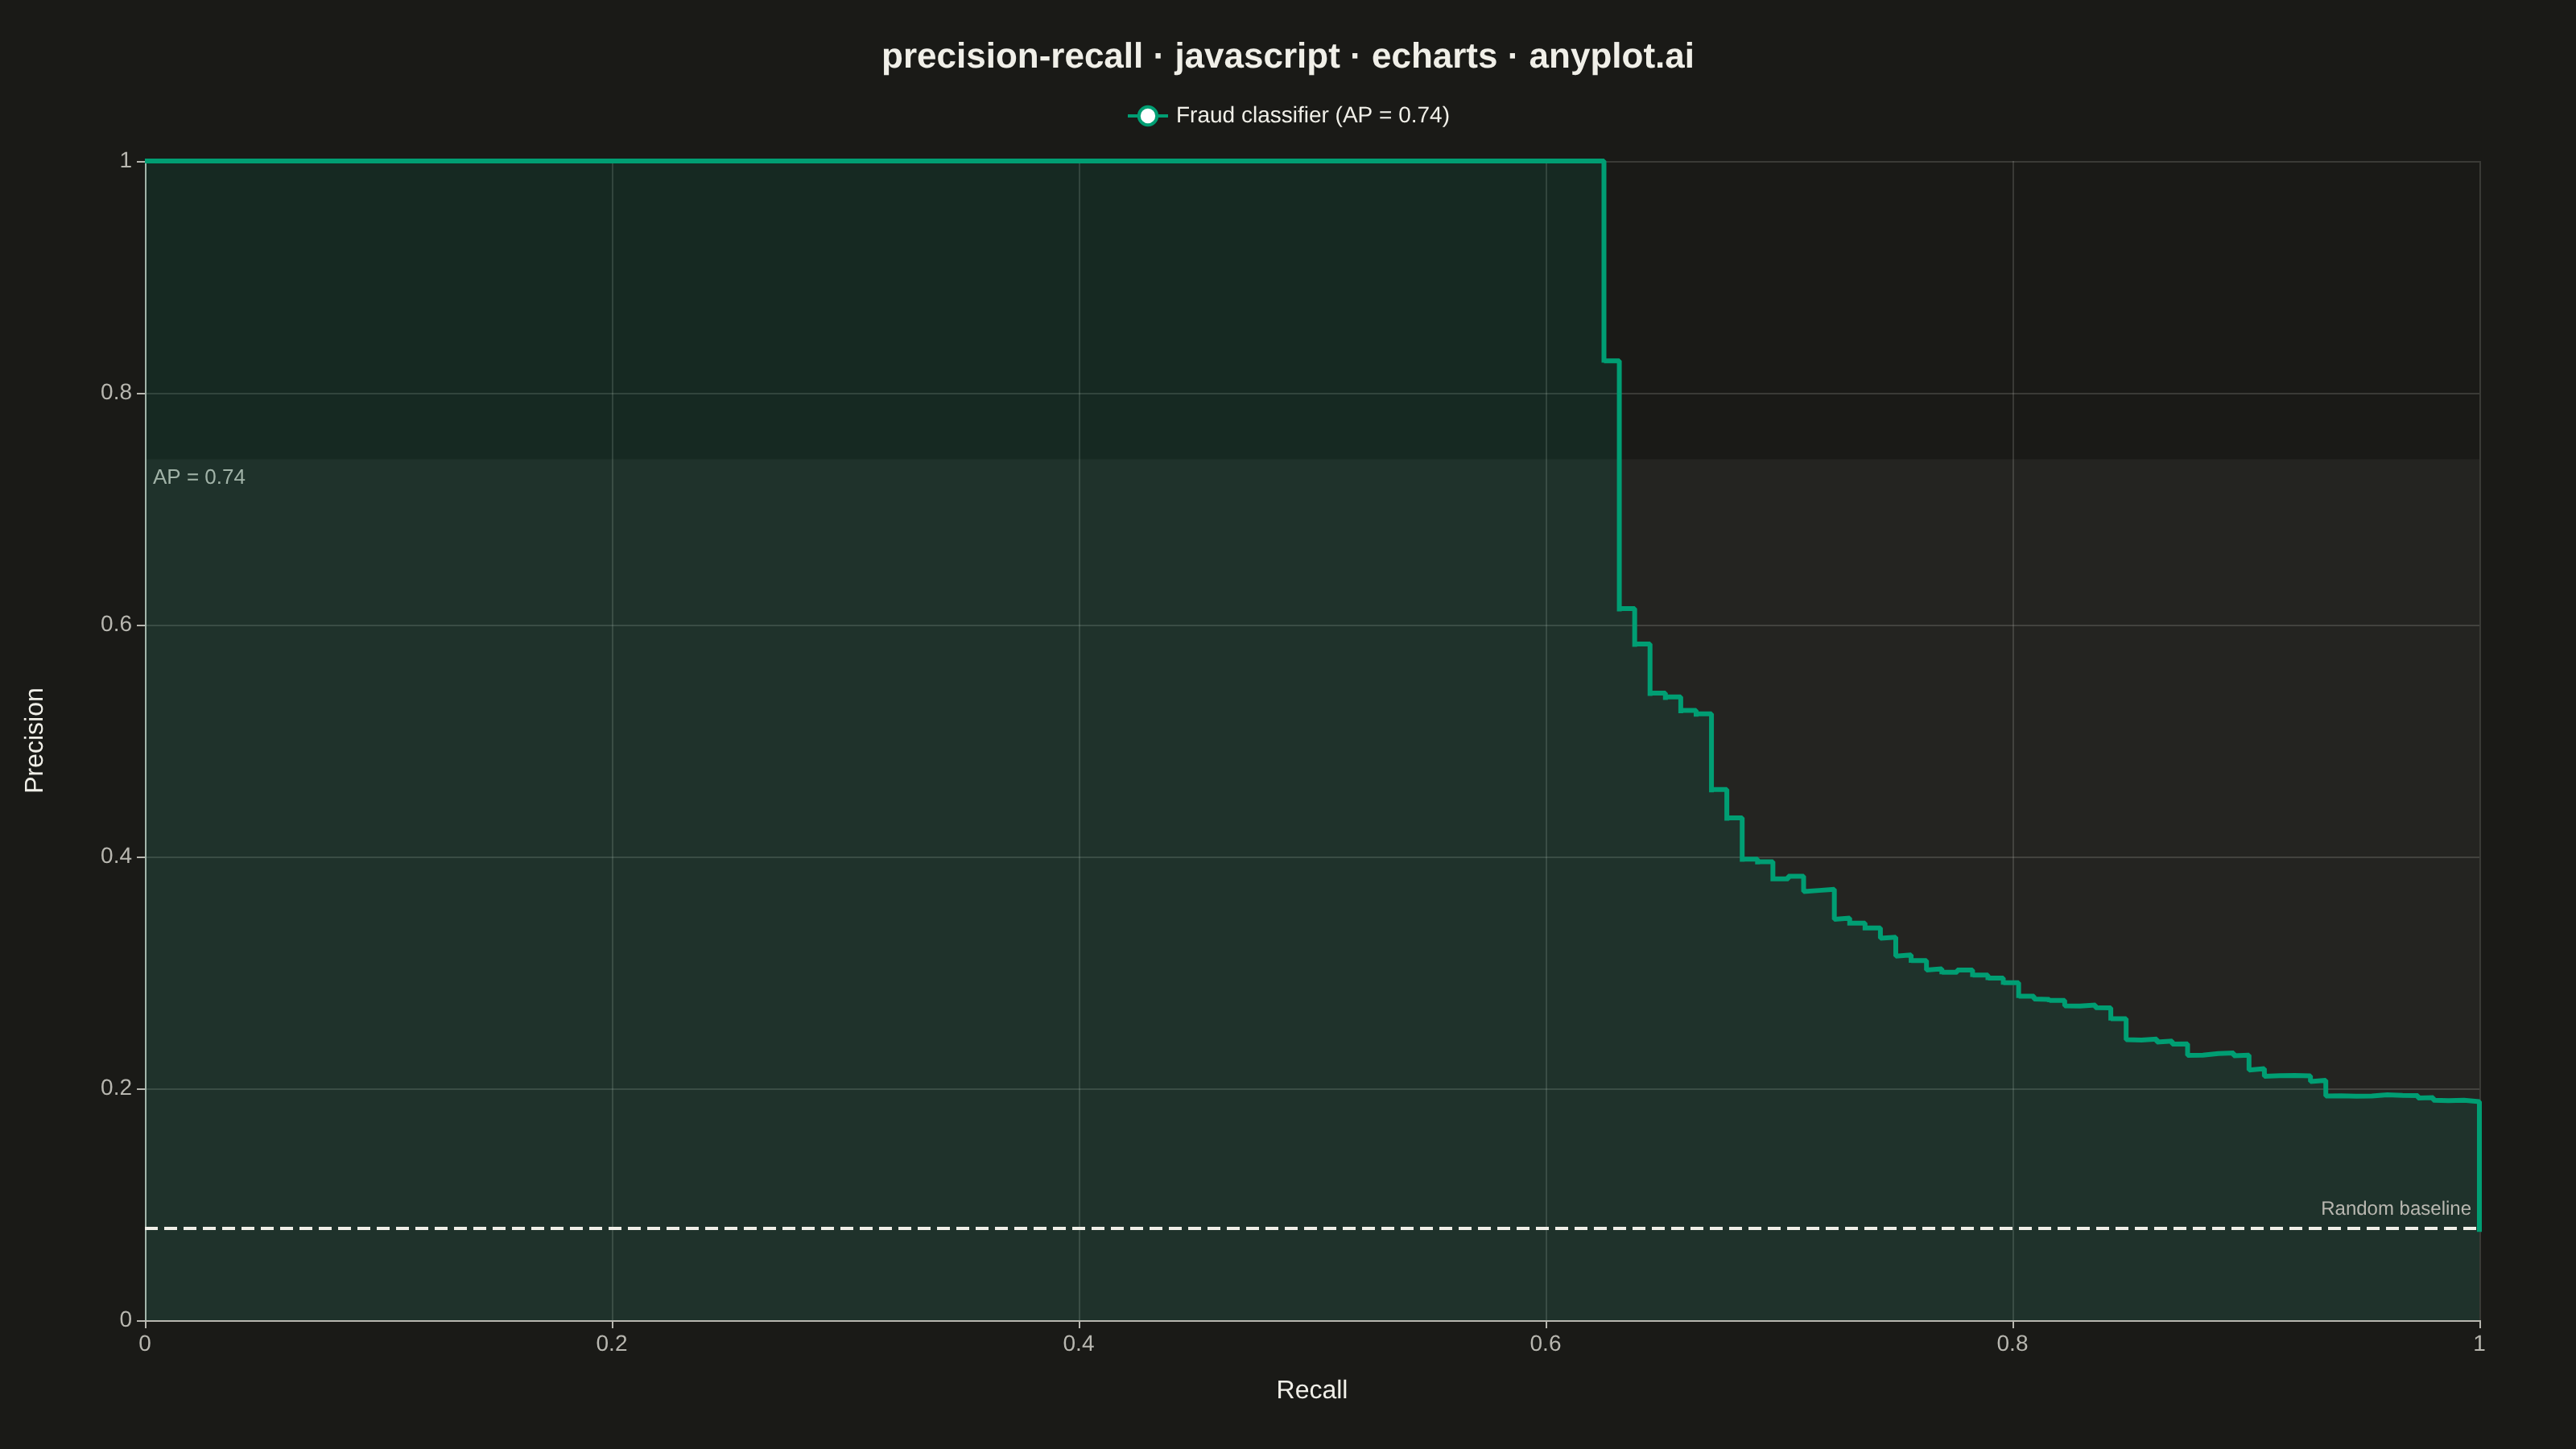
A Precision-Recall curve plots precision (positive predictive value) against recall (sensitivity) at various classification thresholds. This visualization is essential for evaluating binary classifiers on imbalanced datasets where accuracy alone is misleading. The area under the curve (Average Precision) summarizes classifier performance, with higher values indicating better performance.
// anyplot.ai
// precision-recall: Precision-Recall Curve
// Library: echarts 6.1.0 | JavaScript 22.23.2
// Quality: 86/100 | Created: 2026-09-05

const t = window.ANYPLOT_TOKENS;

// --- Data (in-memory, deterministic) ---------------------------------------
// Fraud-detection scenario: rare positive class (fraud) among transactions.
// A tiny fixed-seed LCG stands in for a classifier's predict_proba() scores.
function lcg(seed) {
  let state = seed;
  return () => {
    state = (state * 1664525 + 1013904223) % 4294967296;
    return state / 4294967296;
  };
}
const rand = lcg(42);

const nSamples = 2000;
const fraudRate = 0.08;
const yTrue = [];
const yScores = [];
for (let i = 0; i < nSamples; i++) {
  const isFraud = rand() < fraudRate;
  yTrue.push(isFraud ? 1 : 0);
  // Fraud scores skew high, legitimate scores skew low, both noisy.
  const base = isFraud ? 0.72 : 0.28;
  const noise = (rand() - 0.5) * 0.7;
  const score = Math.min(1, Math.max(0, base + noise));
  yScores.push(score);
}

const positiveCount = yTrue.reduce((sum, v) => sum + v, 0);
const baselinePrecision = positiveCount / nSamples;

// Sort by descending score, then sweep thresholds accumulating precision/recall.
const order = yScores
  .map((score, idx) => idx)
  .sort((a, b) => yScores[b] - yScores[a]);

const points = [{ recall: 0, precision: 1 }];
let truePositives = 0;
let falsePositives = 0;
for (const idx of order) {
  if (yTrue[idx] === 1) {
    truePositives += 1;
  } else {
    falsePositives += 1;
  }
  const precision = truePositives / (truePositives + falsePositives);
  const recall = truePositives / positiveCount;
  points.push({ recall, precision });
}

// Average Precision: sum of precision * change in recall (step function).
let averagePrecision = 0;
for (let i = 1; i < points.length; i++) {
  const deltaRecall = points[i].recall - points[i - 1].recall;
  averagePrecision += points[i].precision * deltaRecall;
}

const curveData = points.map((p) => [p.recall, p.precision]);

// --- Init -------------------------------------------------------------------
const chart = echarts.init(document.getElementById("container"));

// --- Option -----------------------------------------------------------------
chart.setOption({
  animation: false,
  color: t.palette,
  backgroundColor: "transparent",
  title: {
    text: "precision-recall · javascript · echarts · anyplot.ai",
    left: "center",
    top: 20,
    textStyle: { color: t.ink, fontSize: 22 },
  },
  grid: { left: 90, right: 60, top: 100, bottom: 80 },
  legend: {
    data: [`Fraud classifier (AP = ${averagePrecision.toFixed(2)})`],
    top: 60,
    textStyle: { color: t.ink, fontSize: 14 },
  },
  xAxis: {
    type: "value",
    name: "Recall",
    nameLocation: "middle",
    nameGap: 36,
    nameTextStyle: { color: t.ink, fontSize: 16 },
    min: 0,
    max: 1,
    axisLabel: { color: t.inkSoft, fontSize: 14 },
    axisLine: { lineStyle: { color: t.inkSoft } },
    splitLine: { lineStyle: { color: t.grid } },
  },
  yAxis: {
    type: "value",
    name: "Precision",
    nameLocation: "middle",
    nameGap: 60,
    nameTextStyle: { color: t.ink, fontSize: 16 },
    min: 0,
    max: 1,
    axisLabel: { color: t.inkSoft, fontSize: 14 },
    axisLine: { lineStyle: { color: t.inkSoft } },
    splitLine: { lineStyle: { color: t.grid } },
  },
  series: [
    {
      name: `Fraud classifier (AP = ${averagePrecision.toFixed(2)})`,
      type: "line",
      step: "start",
      data: curveData,
      showSymbol: false,
      itemStyle: { color: t.palette[0] },
      lineStyle: { width: 3, color: t.palette[0] },
      areaStyle: { color: t.palette[0], opacity: 0.12 },
      // Shade the region up to the AP level so the summary metric reads
      // directly off the chart, not just from the legend.
      markArea: {
        silent: true,
        itemStyle: { color: t.ink, opacity: 0.05 },
        label: { position: "insideTopLeft", color: t.inkSoft, fontSize: 13 },
        data: [
          [
            { xAxis: 0, yAxis: 0, label: { formatter: `AP = ${averagePrecision.toFixed(2)}` } },
            { xAxis: 1, yAxis: averagePrecision },
          ],
        ],
      },
      // Imprint "neutral" semantic anchor (random-classifier reference) —
      // theme-adaptive ink, idiomatic markLine instead of a second series.
      markLine: {
        silent: true,
        symbol: "none",
        lineStyle: { color: t.ink, type: "dashed", width: 2 },
        label: { formatter: "Random baseline", color: t.inkSoft, fontSize: 12, position: "insideEndTop" },
        data: [{ yAxis: baselinePrecision }],
      },
    },
  ],
});
Runnable source as JSON, for any HTTP client: https://api.anyplot.ai/specs/precision-recall/echarts/code. Any spec id and library id listed in llms-full.txt fit the same URL shape; every URL below is complete and callable.
{
  "spec_id": "precision-recall",
  "language": "javascript",
  "library": "echarts",
  "page": "https://anyplot.ai/precision-recall/javascript/echarts",
  "hub": "https://anyplot.ai/precision-recall",
  "code_json": "https://api.anyplot.ai/specs/precision-recall/echarts/code",
  "spec_json": "https://api.anyplot.ai/specs/precision-recall",
  "render_light_png": "https://storage.googleapis.com/anyplot-images/plots/precision-recall/javascript/echarts/plot-light.png",
  "render_dark_png": "https://storage.googleapis.com/anyplot-images/plots/precision-recall/javascript/echarts/plot-dark.png",
  "interactive_light_html": "https://storage.googleapis.com/anyplot-images/plots/precision-recall/javascript/echarts/plot-light.html",
  "interactive_dark_html": "https://storage.googleapis.com/anyplot-images/plots/precision-recall/javascript/echarts/plot-dark.html",
  "quality_score": 86.0,
  "license": "MIT",
  "guide": "https://anyplot.ai/llms.txt"
}
Part of Precision-Recall Curve on anyplot.ai.