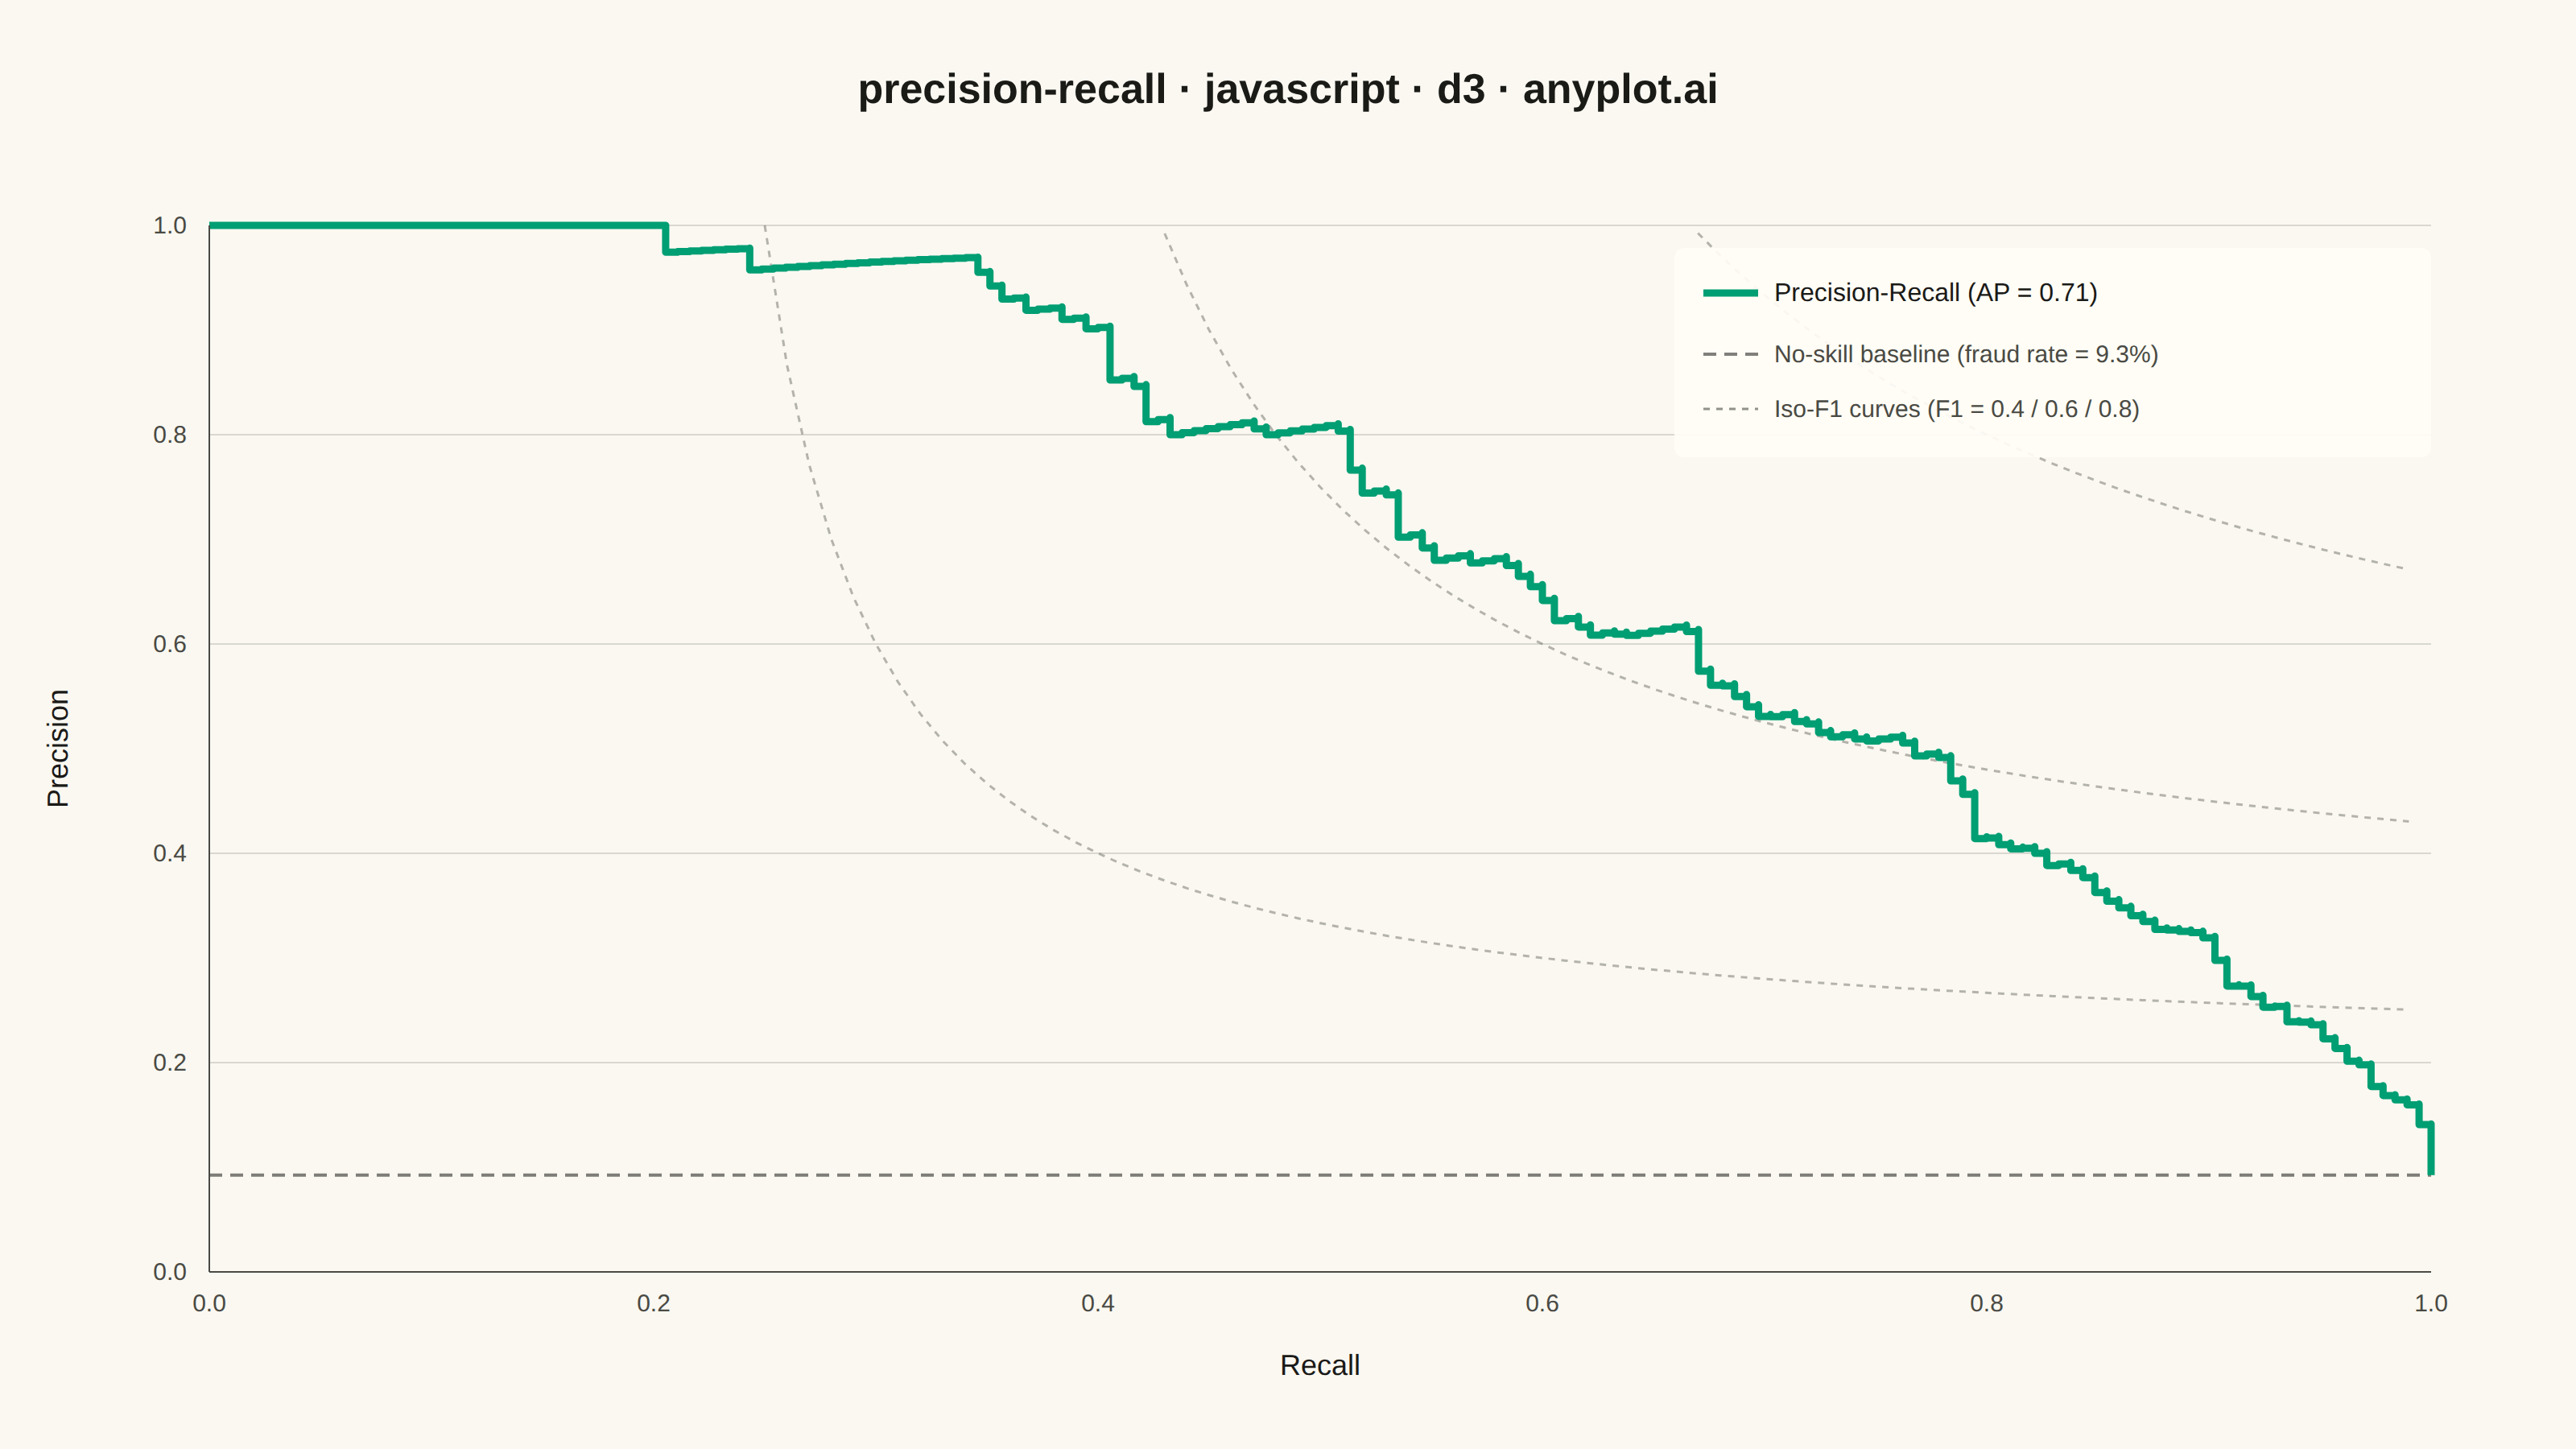
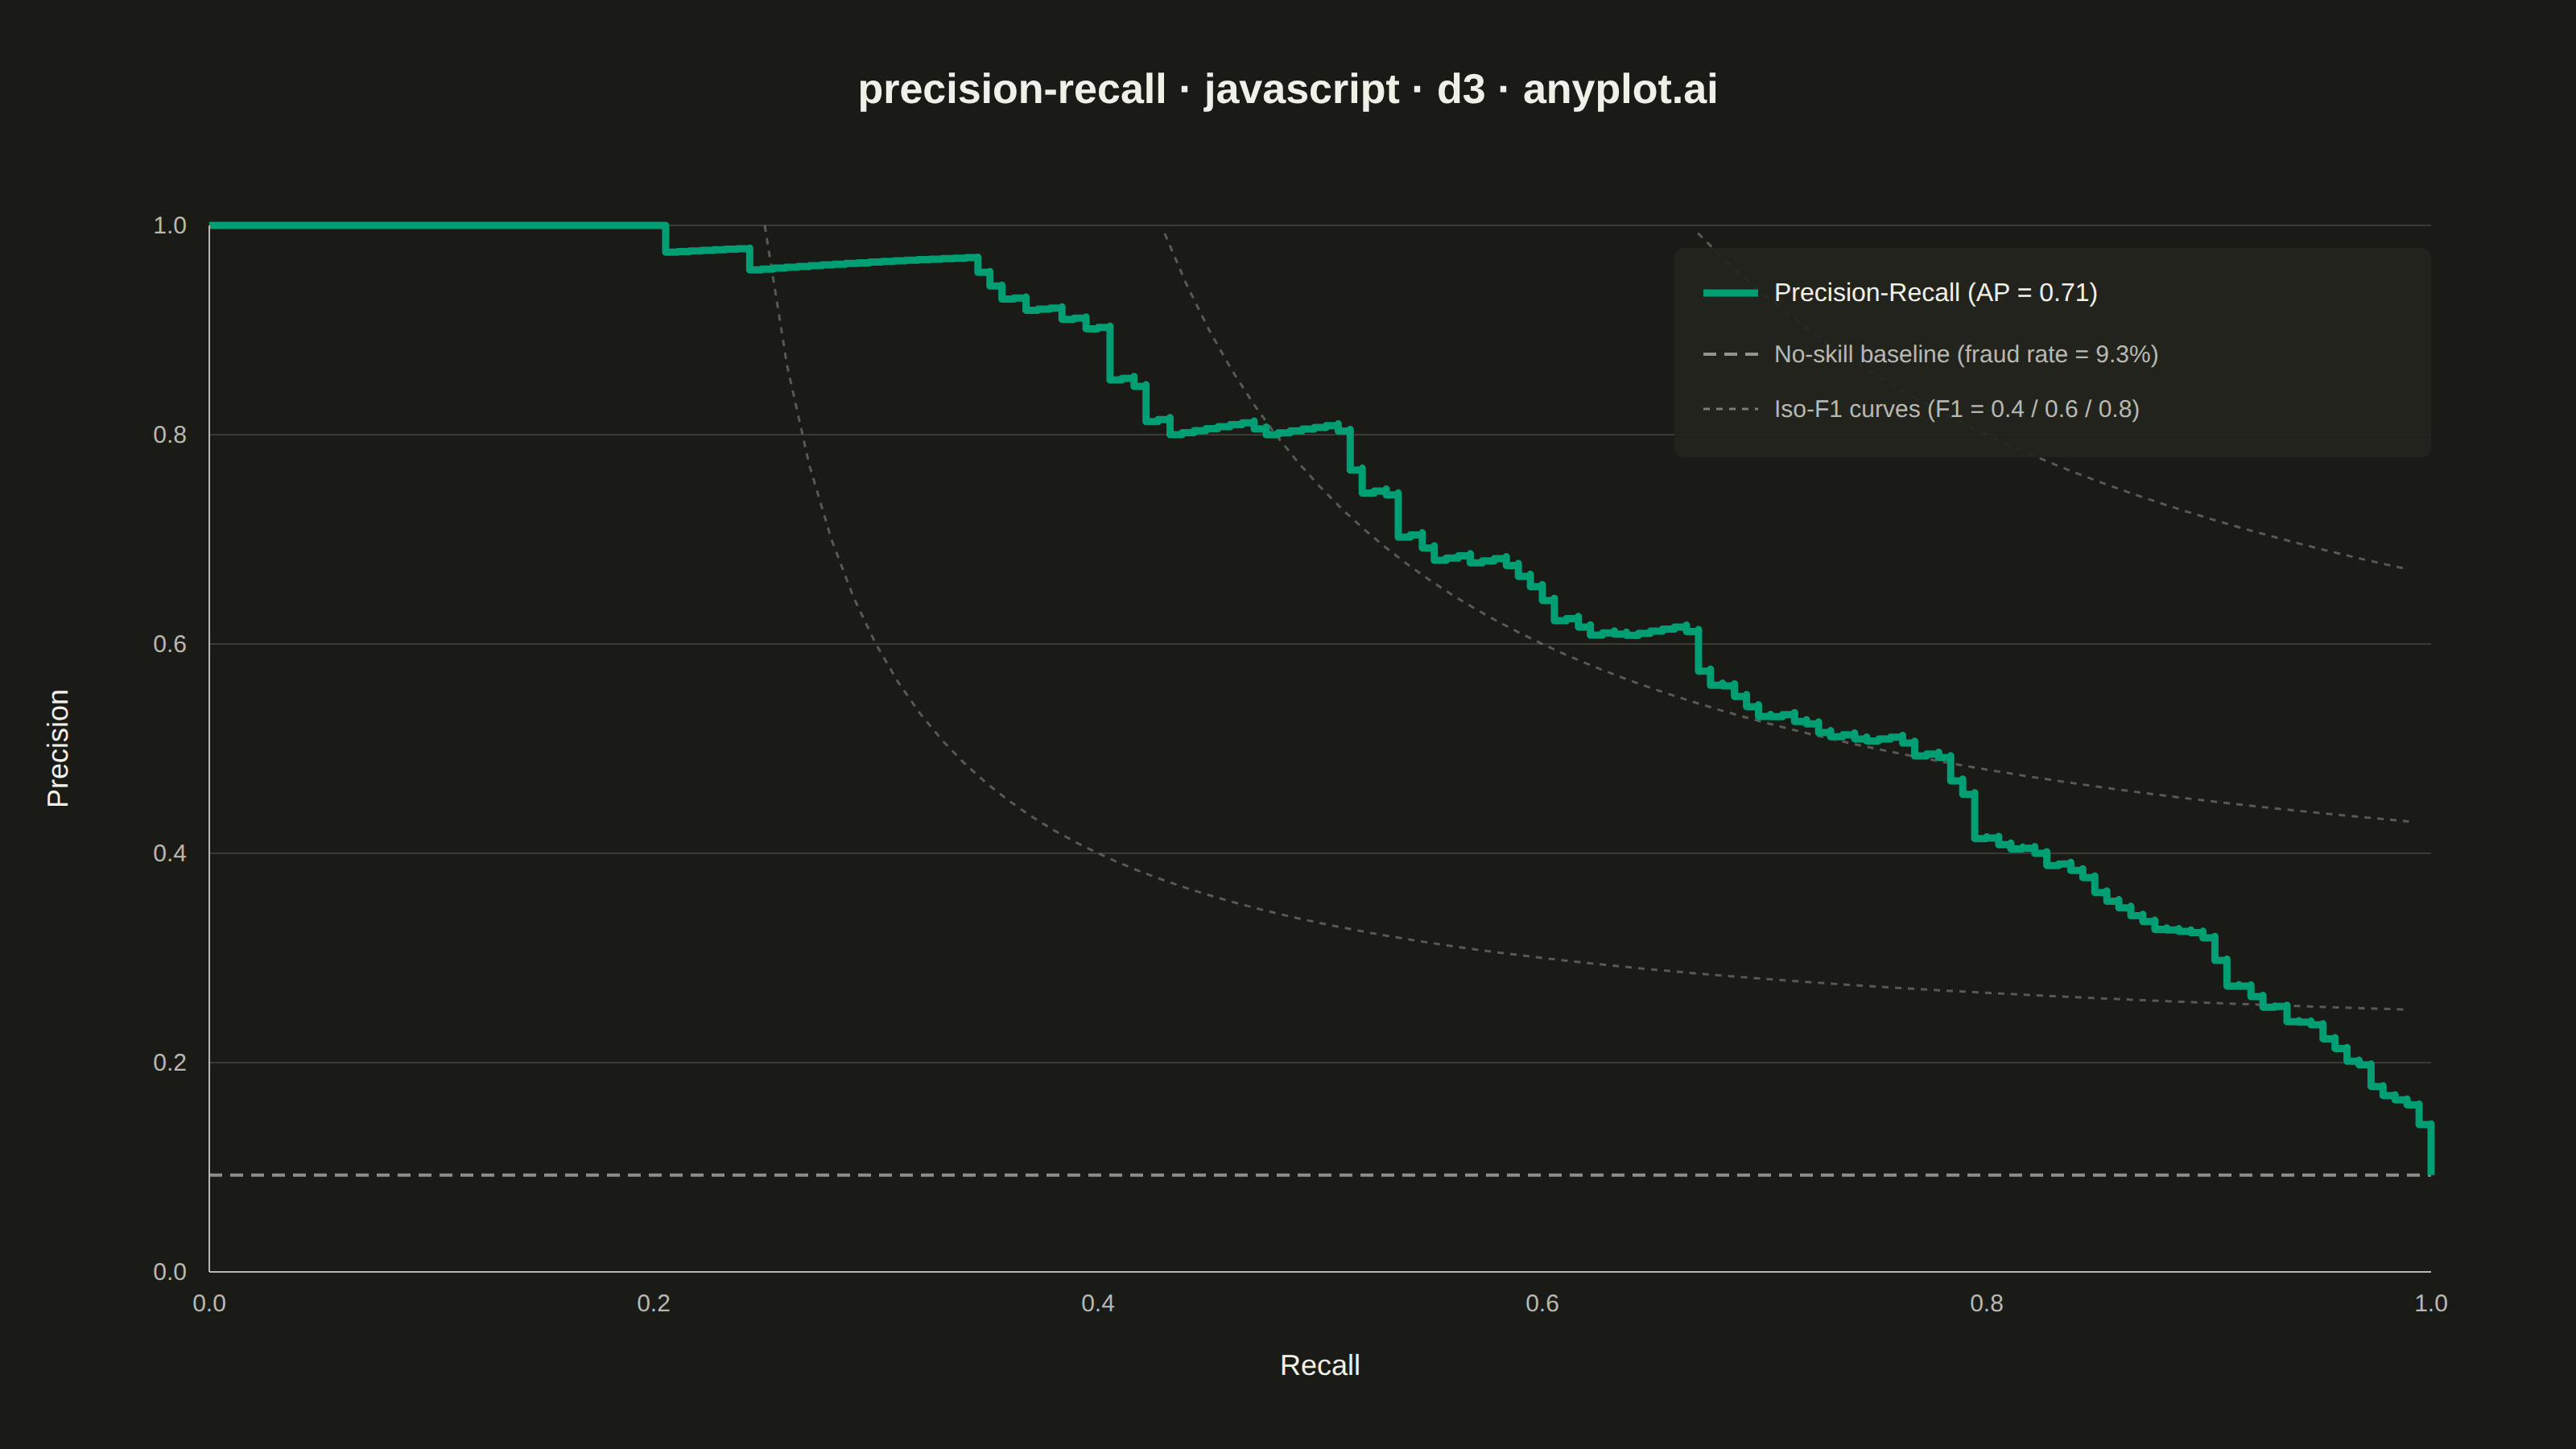
The same plot in 14 other libraries — JavaScript: Chart.js, Apache ECharts, Highcharts, MUI X Charts; Python: Altair, Bokeh, lets-plot, Matplotlib, Plotly, plotnine, Pygal, Seaborn; R: ggplot2; Julia: Makie.jl. Compare all 15 side by side: Precision-Recall Curve in Python, R, Julia and JavaScript.
A Precision-Recall curve plots precision (positive predictive value) against recall (sensitivity) at various classification thresholds. This visualization is essential for evaluating binary classifiers on imbalanced datasets where accuracy alone is misleading. The area under the curve (Average Precision) summarizes classifier performance, with higher values indicating better performance.
// anyplot.ai
// precision-recall: Precision-Recall Curve
// Library: d3 7.9.0 | JavaScript 22.23.2
// Quality: 91/100 | Created: 2026-09-05

const t = window.ANYPLOT_TOKENS;
const { width, height } = window.ANYPLOT_SIZE;
const margin = { top: 140, right: 90, bottom: 110, left: 130 };
const iw = width - margin.left - margin.right;
const ih = height - margin.top - margin.bottom;

// --- Data: fraud-detection classifier scores (in-memory, deterministic) ----
let seed = 42;
function rand() {
  seed = (seed * 1103515245 + 12345) & 0x7fffffff;
  return seed / 0x7fffffff;
}
function gaussian() {
  const u1 = Math.max(rand(), 1e-9);
  const u2 = rand();
  return Math.sqrt(-2 * Math.log(u1)) * Math.cos(2 * Math.PI * u2);
}
function sigmoid(z) {
  return 1 / (1 + Math.exp(-z));
}

const nTransactions = 2000;
const fraudRate = 0.08;
const samples = [];
for (let i = 0; i < nTransactions; i++) {
  const isFraud = rand() < fraudRate ? 1 : 0;
  const logit = isFraud ? gaussian() * 1.05 + 1.9 : gaussian() * 1.05 - 0.4;
  samples.push({ label: isFraud, score: sigmoid(logit) });
}

const positives = samples.reduce((sum, d) => sum + d.label, 0);
const baselinePrecision = positives / nTransactions;

// --- Precision-recall curve (threshold sweep from high score to low) -------
const sorted = samples.slice().sort((a, b) => b.score - a.score);
let tp = 0;
let fp = 0;
const curve = [{ recall: 0, precision: 1 }];
for (const d of sorted) {
  if (d.label === 1) tp++;
  else fp++;
  curve.push({ recall: tp / positives, precision: tp / (tp + fp) });
}

let averagePrecision = 0;
for (let i = 1; i < curve.length; i++) {
  averagePrecision += curve[i].precision * (curve[i].recall - curve[i - 1].recall);
}

// --- Iso-F1 reference curves (P = F1*R / (2R - F1)) -------------------------
const isoF1Levels = [0.4, 0.6, 0.8];
function isoF1Points(f1) {
  const pts = [];
  for (let r = f1 / 2 + 0.01; r <= 1; r += 0.01) {
    const p = (f1 * r) / (2 * r - f1);
    if (p > 0 && p <= 1) pts.push({ recall: r, precision: p });
  }
  return pts;
}

// --- Scales -------------------------------------------------------------------
const x = d3.scaleLinear().domain([0, 1]).range([0, iw]);
const y = d3.scaleLinear().domain([0, 1]).range([ih, 0]);

// --- SVG mount ------------------------------------------------------------
const svg = d3.select("#container").append("svg").attr("width", width).attr("height", height);
const g = svg.append("g").attr("transform", `translate(${margin.left},${margin.top})`);

// --- Y gridlines (line chart: y-axis only) ---------------------------------
g.selectAll(".grid-line")
  .data(y.ticks(5))
  .join("line")
  .attr("class", "grid-line")
  .attr("x1", 0)
  .attr("x2", iw)
  .attr("y1", (d) => y(d))
  .attr("y2", (d) => y(d))
  .attr("stroke", t.grid);

// --- Iso-F1 curves (labeled once in the legend, not on the crowded canvas) --
const isoLine = d3.line().x((d) => x(d.recall)).y((d) => y(d.precision));
for (const f1 of isoF1Levels) {
  g.append("path")
    .datum(isoF1Points(f1))
    .attr("fill", "none")
    .attr("stroke", t.inkSoft)
    .attr("stroke-width", 1.5)
    .attr("stroke-dasharray", "4,4")
    .attr("opacity", 0.4)
    .attr("d", isoLine);
}

// --- Baseline reference line (random / no-skill classifier) -----------------
g.append("line")
  .attr("x1", 0)
  .attr("x2", iw)
  .attr("y1", y(baselinePrecision))
  .attr("y2", y(baselinePrecision))
  .attr("stroke", t.ink)
  .attr("stroke-width", 2)
  .attr("stroke-dasharray", "8,5")
  .attr("opacity", 0.55);

// --- Precision-recall curve (stepped, threshold-accurate) -------------------
const prLine = d3
  .line()
  .x((d) => x(d.recall))
  .y((d) => y(d.precision))
  .curve(d3.curveStepAfter);

g.append("path")
  .datum(curve)
  .attr("fill", "none")
  .attr("stroke", t.palette[0])
  .attr("stroke-width", 4.5)
  .attr("stroke-linejoin", "round")
  .attr("d", prLine);

// --- Axes ---------------------------------------------------------------------
const xAxis = g
  .append("g")
  .attr("transform", `translate(0,${ih})`)
  .call(d3.axisBottom(x).ticks(5).tickFormat(d3.format(".1f")).tickSize(0).tickPadding(14));
const yAxis = g
  .append("g")
  .call(d3.axisLeft(y).ticks(5).tickFormat(d3.format(".1f")).tickSize(0).tickPadding(14));

for (const axis of [xAxis, yAxis]) {
  axis.selectAll("text").attr("fill", t.inkSoft).style("font-size", "15px");
  axis.select(".domain").attr("stroke", t.inkSoft);
}

// --- Axis labels ----------------------------------------------------------
g.append("text")
  .attr("x", iw / 2)
  .attr("y", ih + 64)
  .attr("text-anchor", "middle")
  .attr("fill", t.ink)
  .style("font-size", "18px")
  .text("Recall");

g.append("text")
  .attr("transform", "rotate(-90)")
  .attr("x", -ih / 2)
  .attr("y", -88)
  .attr("text-anchor", "middle")
  .attr("fill", t.ink)
  .style("font-size", "18px")
  .text("Precision");

// --- Legend (top-right — empty region once a classifier's curve decays) -----
const legend = g.append("g").attr("transform", `translate(${iw - 470},14)`);
legend
  .append("rect")
  .attr("width", 470)
  .attr("height", 130)
  .attr("fill", t.elevatedBg)
  .attr("opacity", 0.92)
  .attr("rx", 6);

legend
  .append("line")
  .attr("x1", 18)
  .attr("x2", 52)
  .attr("y1", 28)
  .attr("y2", 28)
  .attr("stroke", t.palette[0])
  .attr("stroke-width", 4.5);
legend
  .append("text")
  .attr("x", 62)
  .attr("y", 33)
  .attr("fill", t.ink)
  .style("font-size", "16px")
  .text(`Precision-Recall (AP = ${averagePrecision.toFixed(2)})`);

legend
  .append("line")
  .attr("x1", 18)
  .attr("x2", 52)
  .attr("y1", 66)
  .attr("y2", 66)
  .attr("stroke", t.ink)
  .attr("stroke-width", 2)
  .attr("stroke-dasharray", "8,5")
  .attr("opacity", 0.55);
legend
  .append("text")
  .attr("x", 62)
  .attr("y", 71)
  .attr("fill", t.inkSoft)
  .style("font-size", "15px")
  .text(`No-skill baseline (fraud rate = ${(baselinePrecision * 100).toFixed(1)}%)`);

legend
  .append("line")
  .attr("x1", 18)
  .attr("x2", 52)
  .attr("y1", 100)
  .attr("y2", 100)
  .attr("stroke", t.inkSoft)
  .attr("stroke-width", 1.5)
  .attr("stroke-dasharray", "4,4")
  .attr("opacity", 0.6);
legend
  .append("text")
  .attr("x", 62)
  .attr("y", 105)
  .attr("fill", t.inkSoft)
  .style("font-size", "15px")
  .text(`Iso-F1 curves (F1 = ${isoF1Levels.join(" / ")})`);

// --- Title --------------------------------------------------------------------
svg
  .append("text")
  .attr("x", width / 2)
  .attr("y", 64)
  .attr("text-anchor", "middle")
  .attr("fill", t.ink)
  .style("font-size", "26px")
  .style("font-weight", "600")
  .text("precision-recall · javascript · d3 · anyplot.ai");
Runnable source as JSON, for any HTTP client: https://api.anyplot.ai/specs/precision-recall/d3/code. Any spec id and library id listed in llms-full.txt fit the same URL shape; every URL below is complete and callable.
{
  "spec_id": "precision-recall",
  "language": "javascript",
  "library": "d3",
  "page": "https://anyplot.ai/precision-recall/javascript/d3",
  "hub": "https://anyplot.ai/precision-recall",
  "code_json": "https://api.anyplot.ai/specs/precision-recall/d3/code",
  "spec_json": "https://api.anyplot.ai/specs/precision-recall",
  "render_light_png": "https://storage.googleapis.com/anyplot-images/plots/precision-recall/javascript/d3/plot-light.png",
  "render_dark_png": "https://storage.googleapis.com/anyplot-images/plots/precision-recall/javascript/d3/plot-dark.png",
  "interactive_light_html": "https://storage.googleapis.com/anyplot-images/plots/precision-recall/javascript/d3/plot-light.html",
  "interactive_dark_html": "https://storage.googleapis.com/anyplot-images/plots/precision-recall/javascript/d3/plot-dark.html",
  "quality_score": 91.0,
  "license": "MIT",
  "guide": "https://anyplot.ai/llms.txt"
}
Part of Precision-Recall Curve on anyplot.ai.