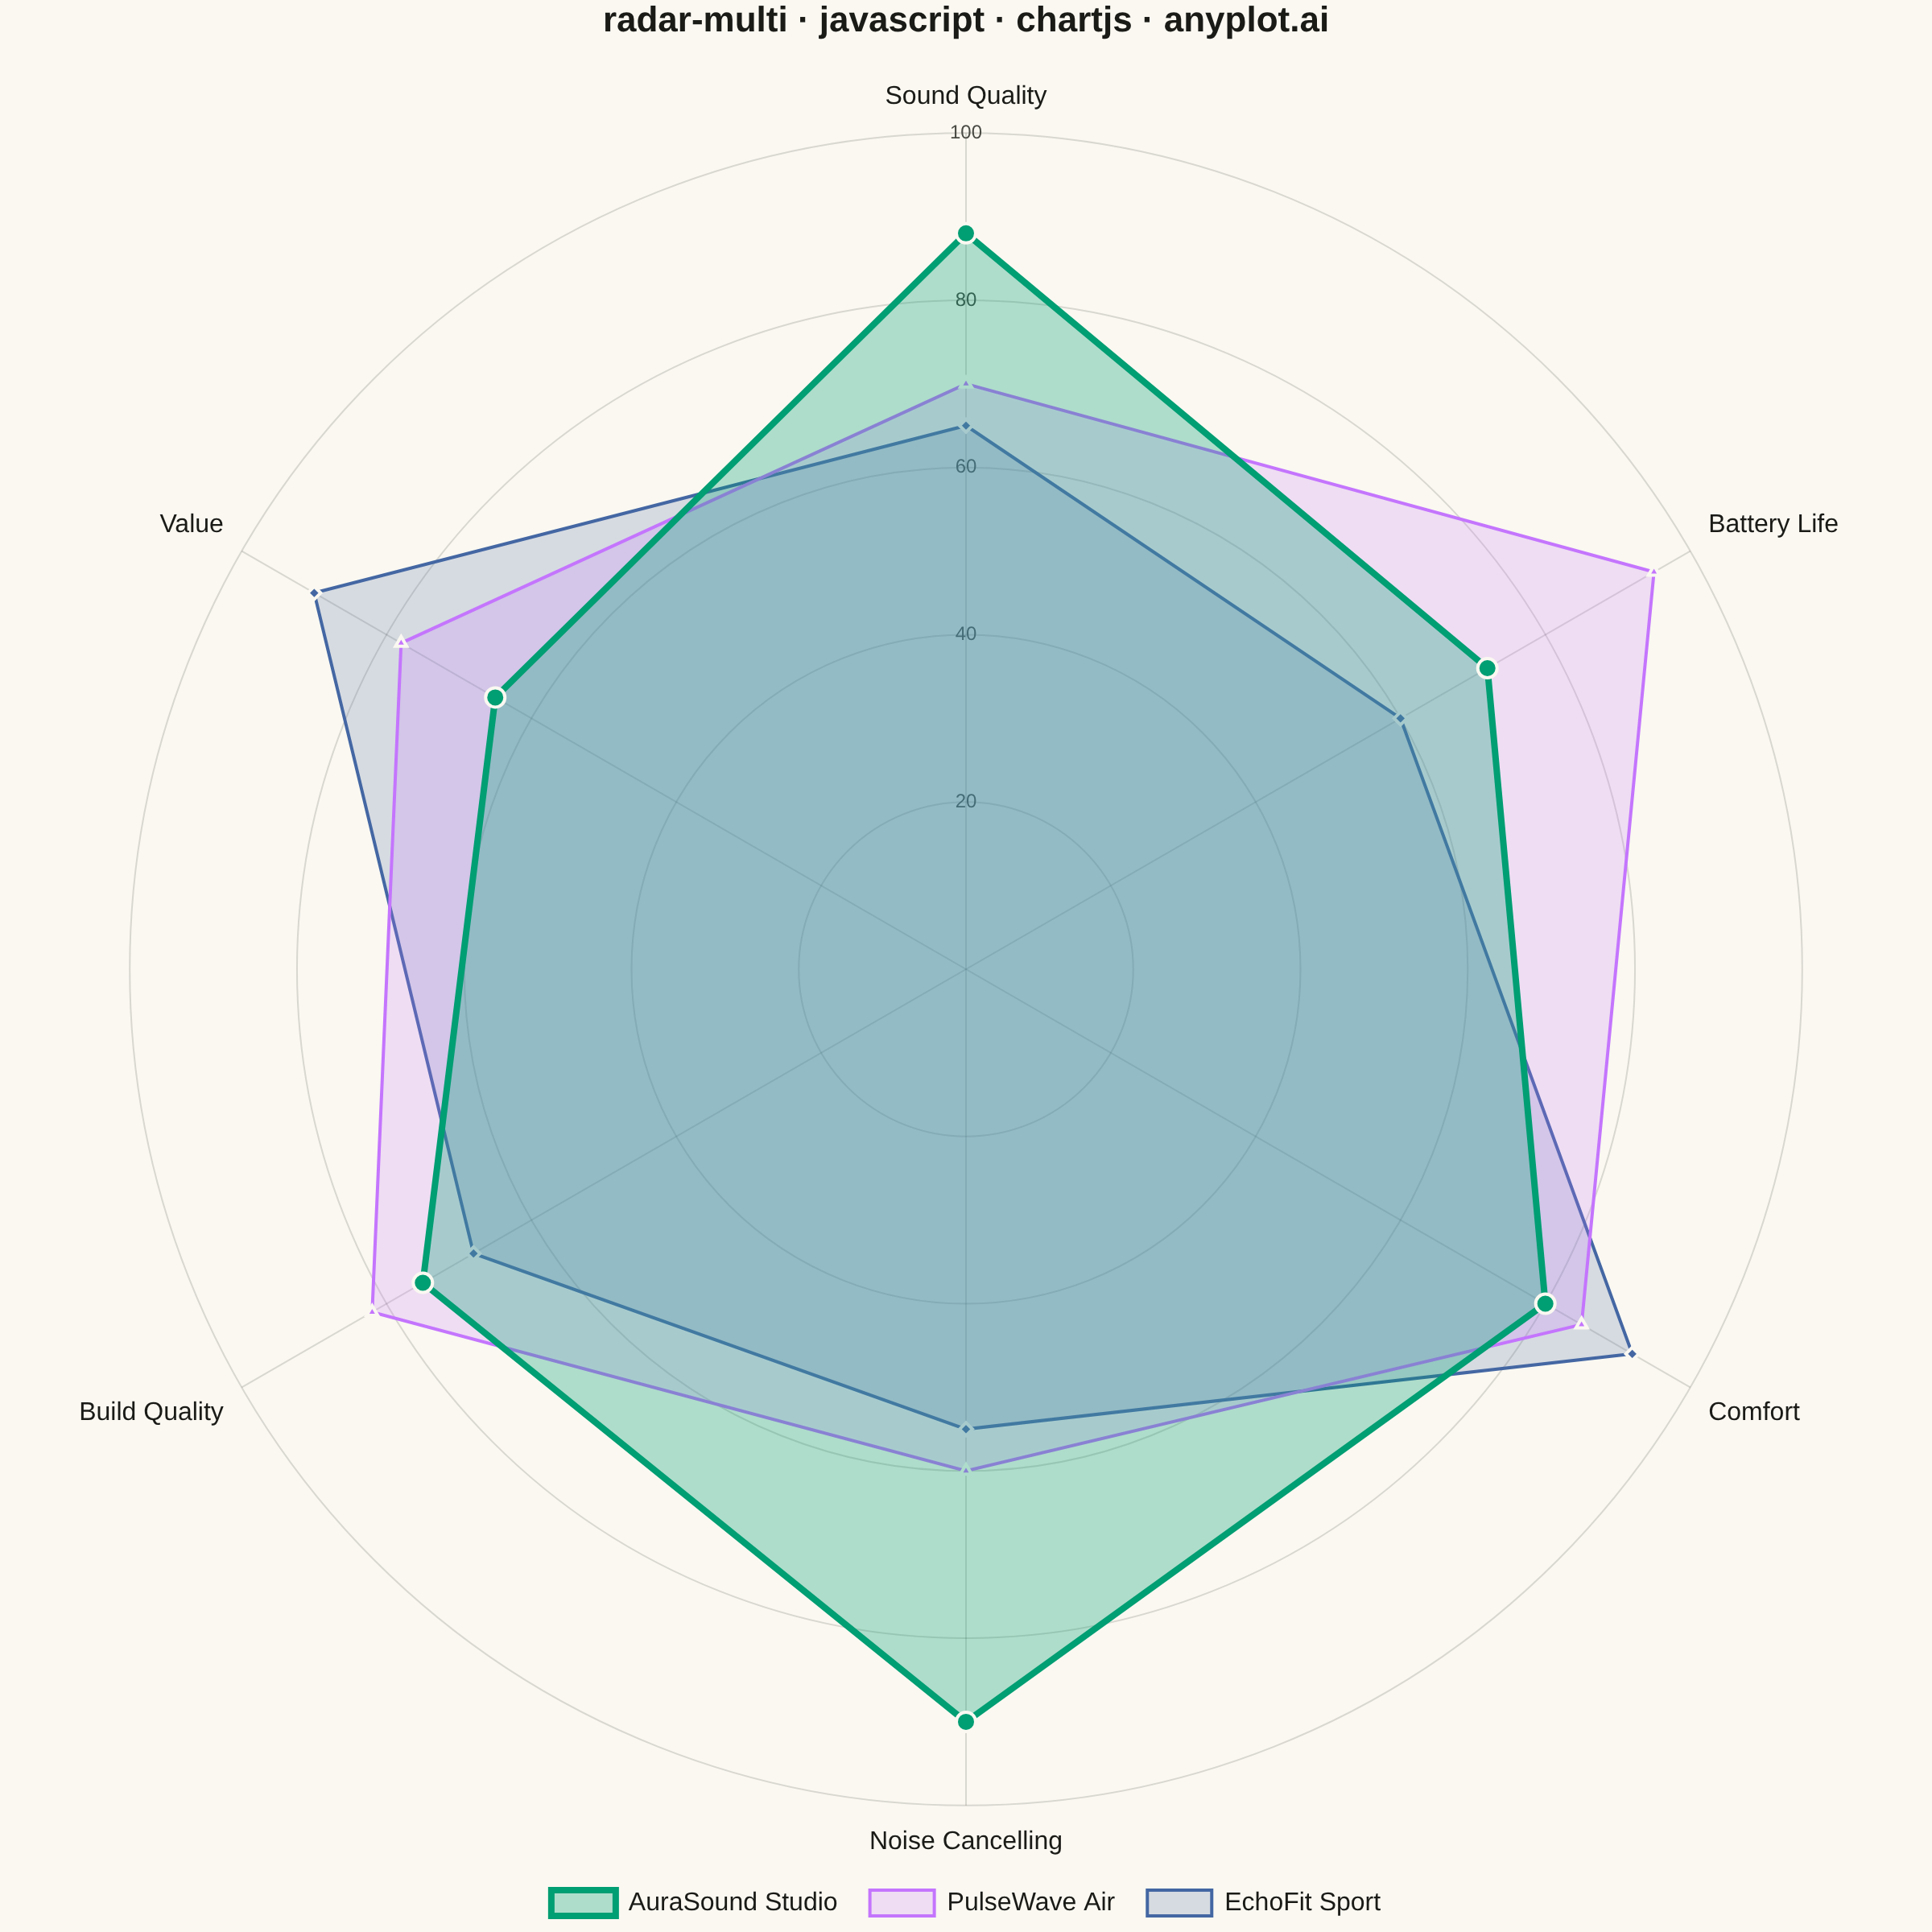
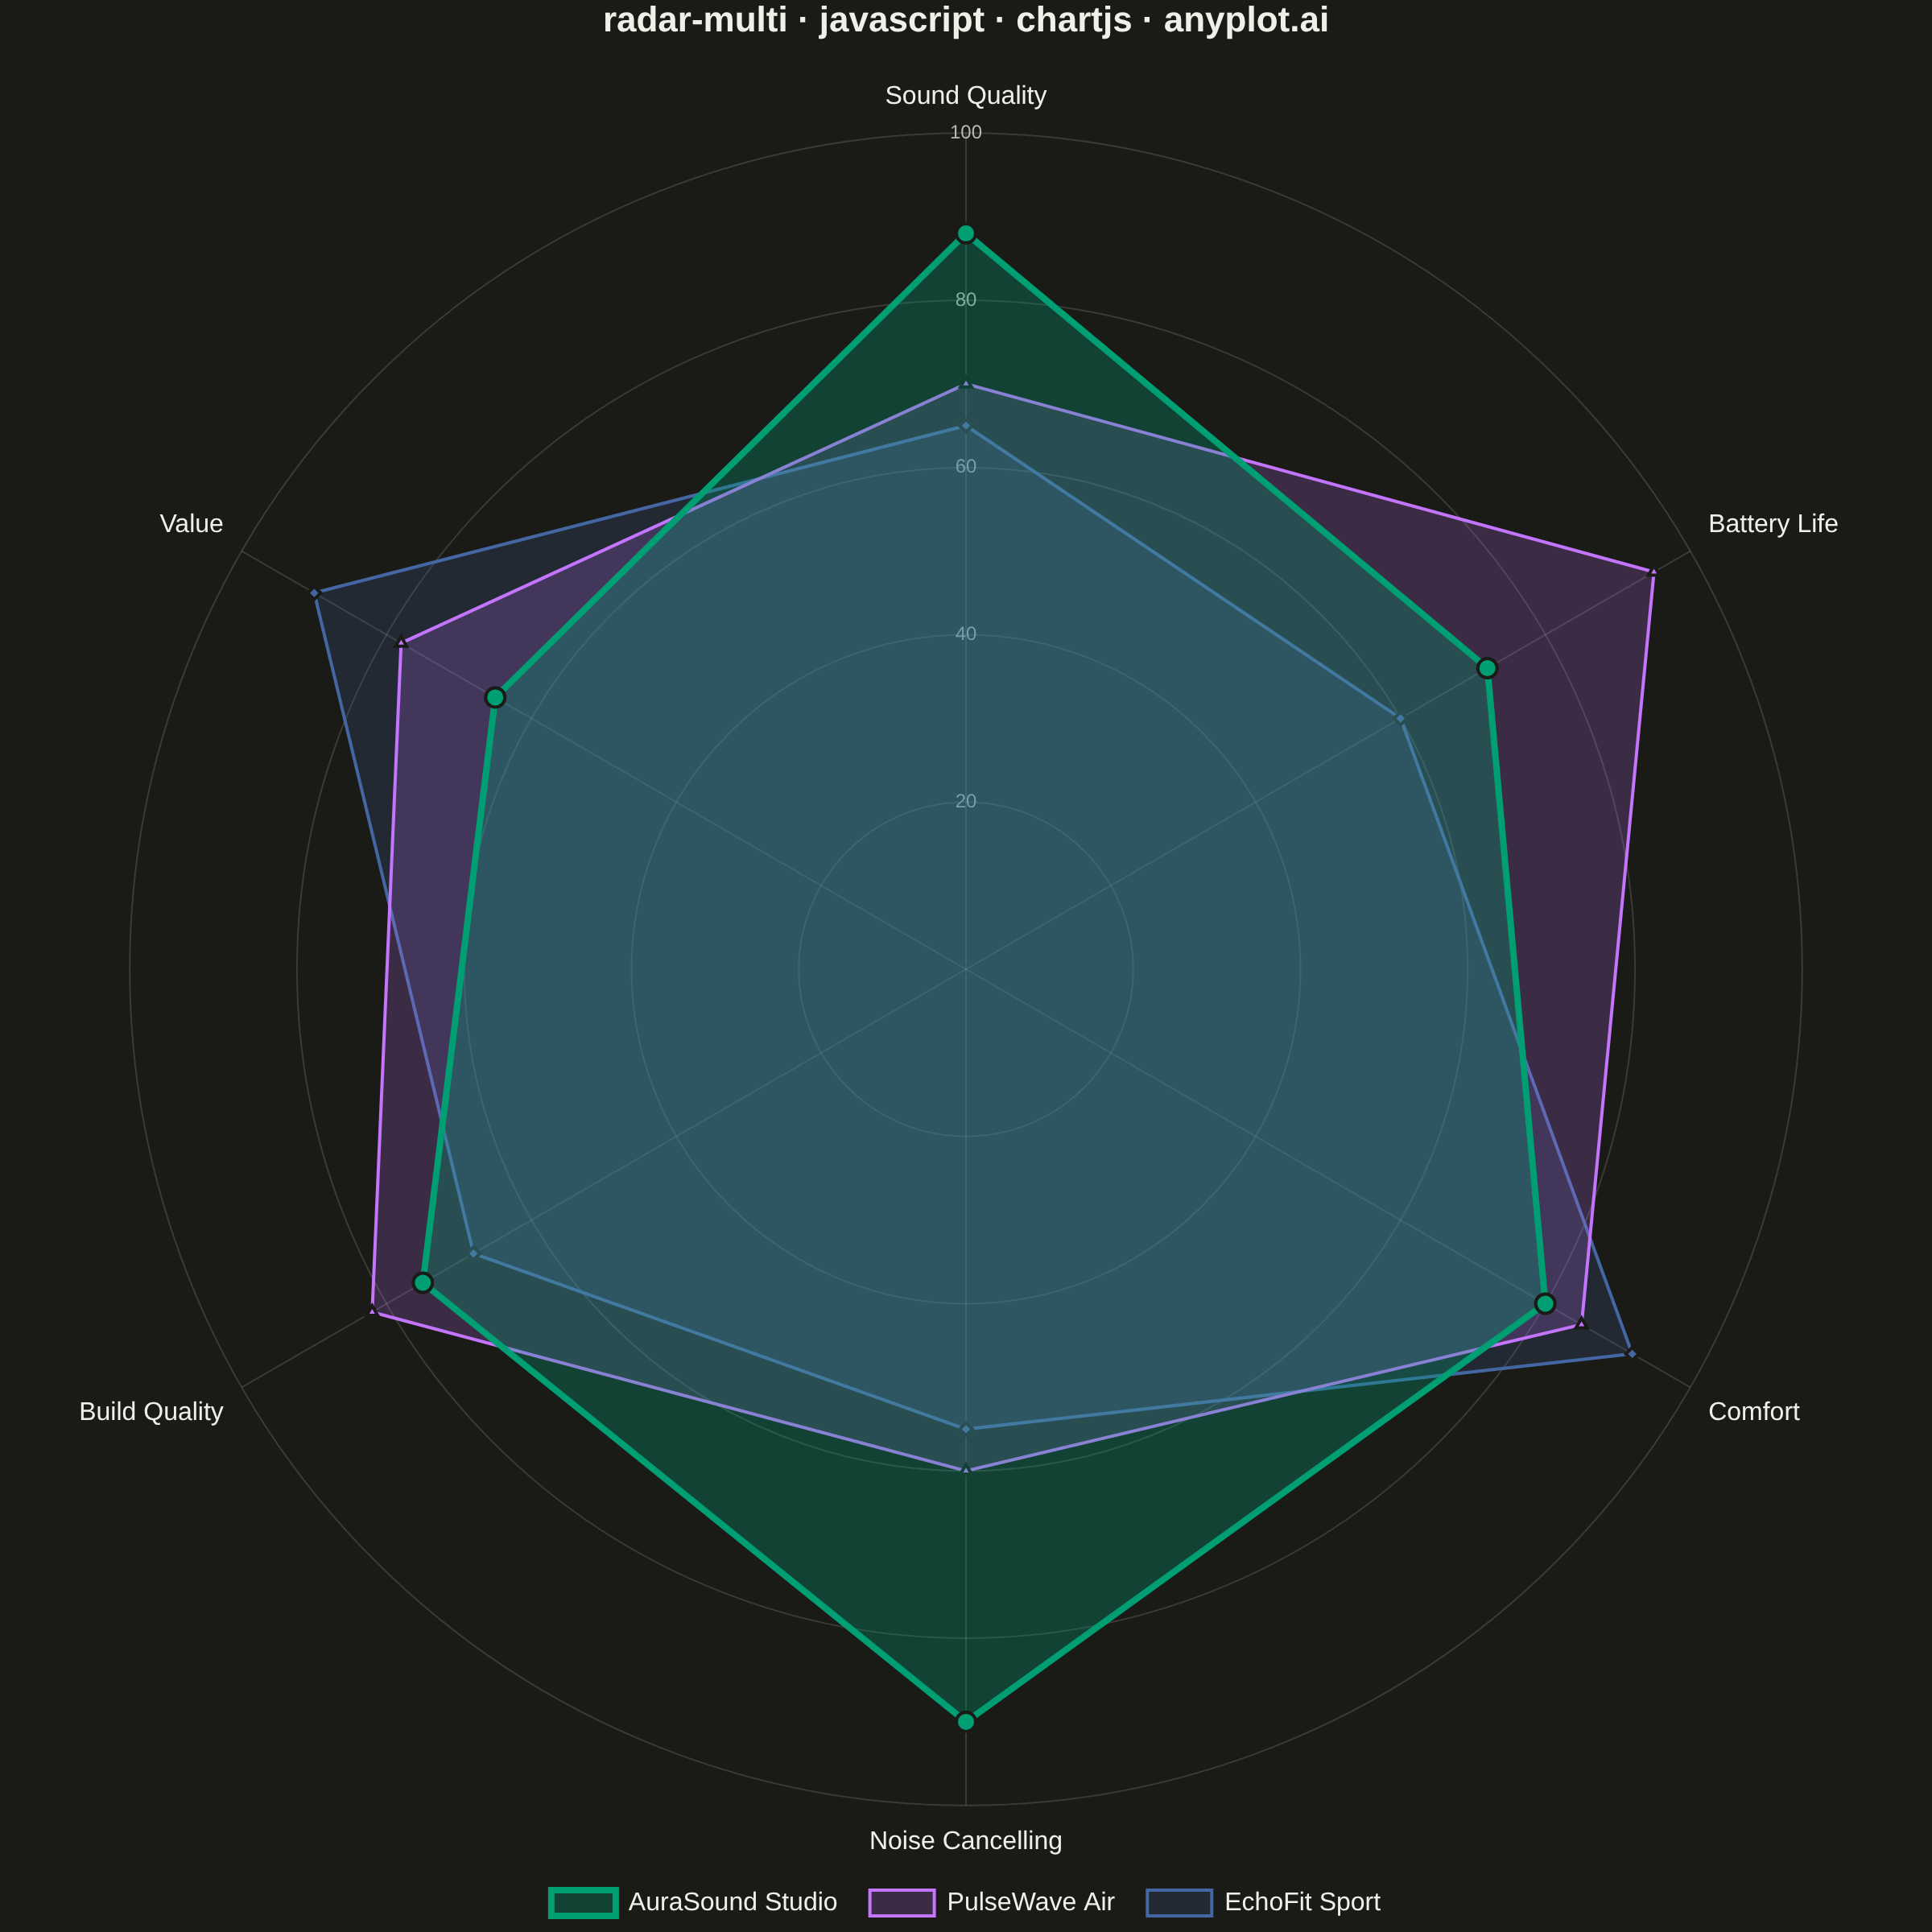
The same plot in 14 other libraries — JavaScript: D3.js, Apache ECharts, Highcharts, MUI X Charts; Python: Altair, Bokeh, lets-plot, Matplotlib, Plotly, plotnine, Pygal, Seaborn; R: ggplot2; Julia: Makie.jl. Compare all 15 side by side: Multi-Series Radar Chart in Python, R, Julia and JavaScript.
A multi-series radar chart overlays multiple data polygons on shared axes radiating from a center point, enabling direct comparison across several entities or categories. Each series is rendered as a distinct colored polygon, making it easy to identify relative strengths and weaknesses at a glance. This visualization excels at comparative analysis where multiple subjects are evaluated across the same set of metrics.
// anyplot.ai
// radar-multi: Multi-Series Radar Chart
// Library: chartjs 4.4.7 | JavaScript 22.23.2
// Quality: 94/100 | Updated: 2026-08-18

//# anyplot-orientation: square
const t = window.ANYPLOT_TOKENS;

// --- Data (in-memory, deterministic) ----------------------------------------
// Wireless headphone models scored on a 0-100 scale across six attributes.
const categories = [
  "Sound Quality",
  "Battery Life",
  "Comfort",
  "Noise Cancelling",
  "Build Quality",
  "Value",
];

// AuraSound Studio leads on the two attributes buyers weigh most (Sound
// Quality, Noise Cancelling), so it is drawn as the featured pick.
const models = [
  {
    name: "AuraSound Studio",
    scores: [88, 72, 80, 90, 75, 65],
    pointStyle: "circle",
    featured: true,
  },
  {
    name: "PulseWave Air",
    scores: [70, 95, 85, 60, 82, 78],
    pointStyle: "triangle",
  },
  {
    name: "EchoFit Sport",
    scores: [65, 60, 92, 55, 68, 90],
    pointStyle: "rectRot",
  },
];

// --- Mount -------------------------------------------------------------------
const canvas = document.createElement("canvas");
document.getElementById("container").appendChild(canvas);

// --- Chart ---------------------------------------------------------------
new Chart(canvas, {
  type: "radar",
  data: {
    labels: categories,
    datasets: models.map((model, i) => {
      const color = t.palette[i % t.palette.length];
      return {
        label: model.name,
        // 8-digit hex appends an alpha channel; keeps the fill in the
        // spec's 0.2-0.3 range without a hex->rgba helper.
        backgroundColor: color + (model.featured ? "4D" : "33"),
        data: model.scores,
        borderColor: color,
        borderWidth: model.featured ? 4 : 2,
        pointStyle: model.pointStyle,
        pointBackgroundColor: color,
        pointBorderColor: t.pageBg,
        pointBorderWidth: 2,
        pointRadius: model.featured ? 6 : 4,
        pointHoverRadius: model.featured ? 8 : 6,
        order: model.featured ? 0 : 1,
      };
    }),
  },
  options: {
    responsive: true,
    maintainAspectRatio: false,
    animation: false,
    plugins: {
      title: {
        display: true,
        text: "radar-multi · javascript · chartjs · anyplot.ai",
        color: t.ink,
        font: { size: 22 },
        padding: { bottom: 24 },
      },
      legend: {
        position: "bottom",
        labels: { color: t.ink, font: { size: 16 }, padding: 20 },
      },
    },
    scales: {
      r: {
        min: 0,
        max: 100,
        ticks: {
          stepSize: 20,
          color: t.inkSoft,
          font: { size: 12 },
          backdropColor: "transparent",
        },
        grid: { color: t.grid, circular: true },
        angleLines: { color: t.grid },
        pointLabels: { color: t.ink, font: { size: 16 } },
      },
    },
  },
});
Runnable source as JSON, for any HTTP client: https://api.anyplot.ai/specs/radar-multi/chartjs/code. Any spec id and library id listed in llms-full.txt fit the same URL shape; every URL below is complete and callable.
{
  "spec_id": "radar-multi",
  "language": "javascript",
  "library": "chartjs",
  "page": "https://anyplot.ai/radar-multi/javascript/chartjs",
  "hub": "https://anyplot.ai/radar-multi",
  "code_json": "https://api.anyplot.ai/specs/radar-multi/chartjs/code",
  "spec_json": "https://api.anyplot.ai/specs/radar-multi",
  "render_light_png": "https://storage.googleapis.com/anyplot-images/plots/radar-multi/javascript/chartjs/plot-light.png",
  "render_dark_png": "https://storage.googleapis.com/anyplot-images/plots/radar-multi/javascript/chartjs/plot-dark.png",
  "interactive_light_html": "https://storage.googleapis.com/anyplot-images/plots/radar-multi/javascript/chartjs/plot-light.html",
  "interactive_dark_html": "https://storage.googleapis.com/anyplot-images/plots/radar-multi/javascript/chartjs/plot-dark.html",
  "quality_score": 94.0,
  "license": "MIT",
  "guide": "https://anyplot.ai/llms.txt"
}
Part of Multi-Series Radar Chart on anyplot.ai.