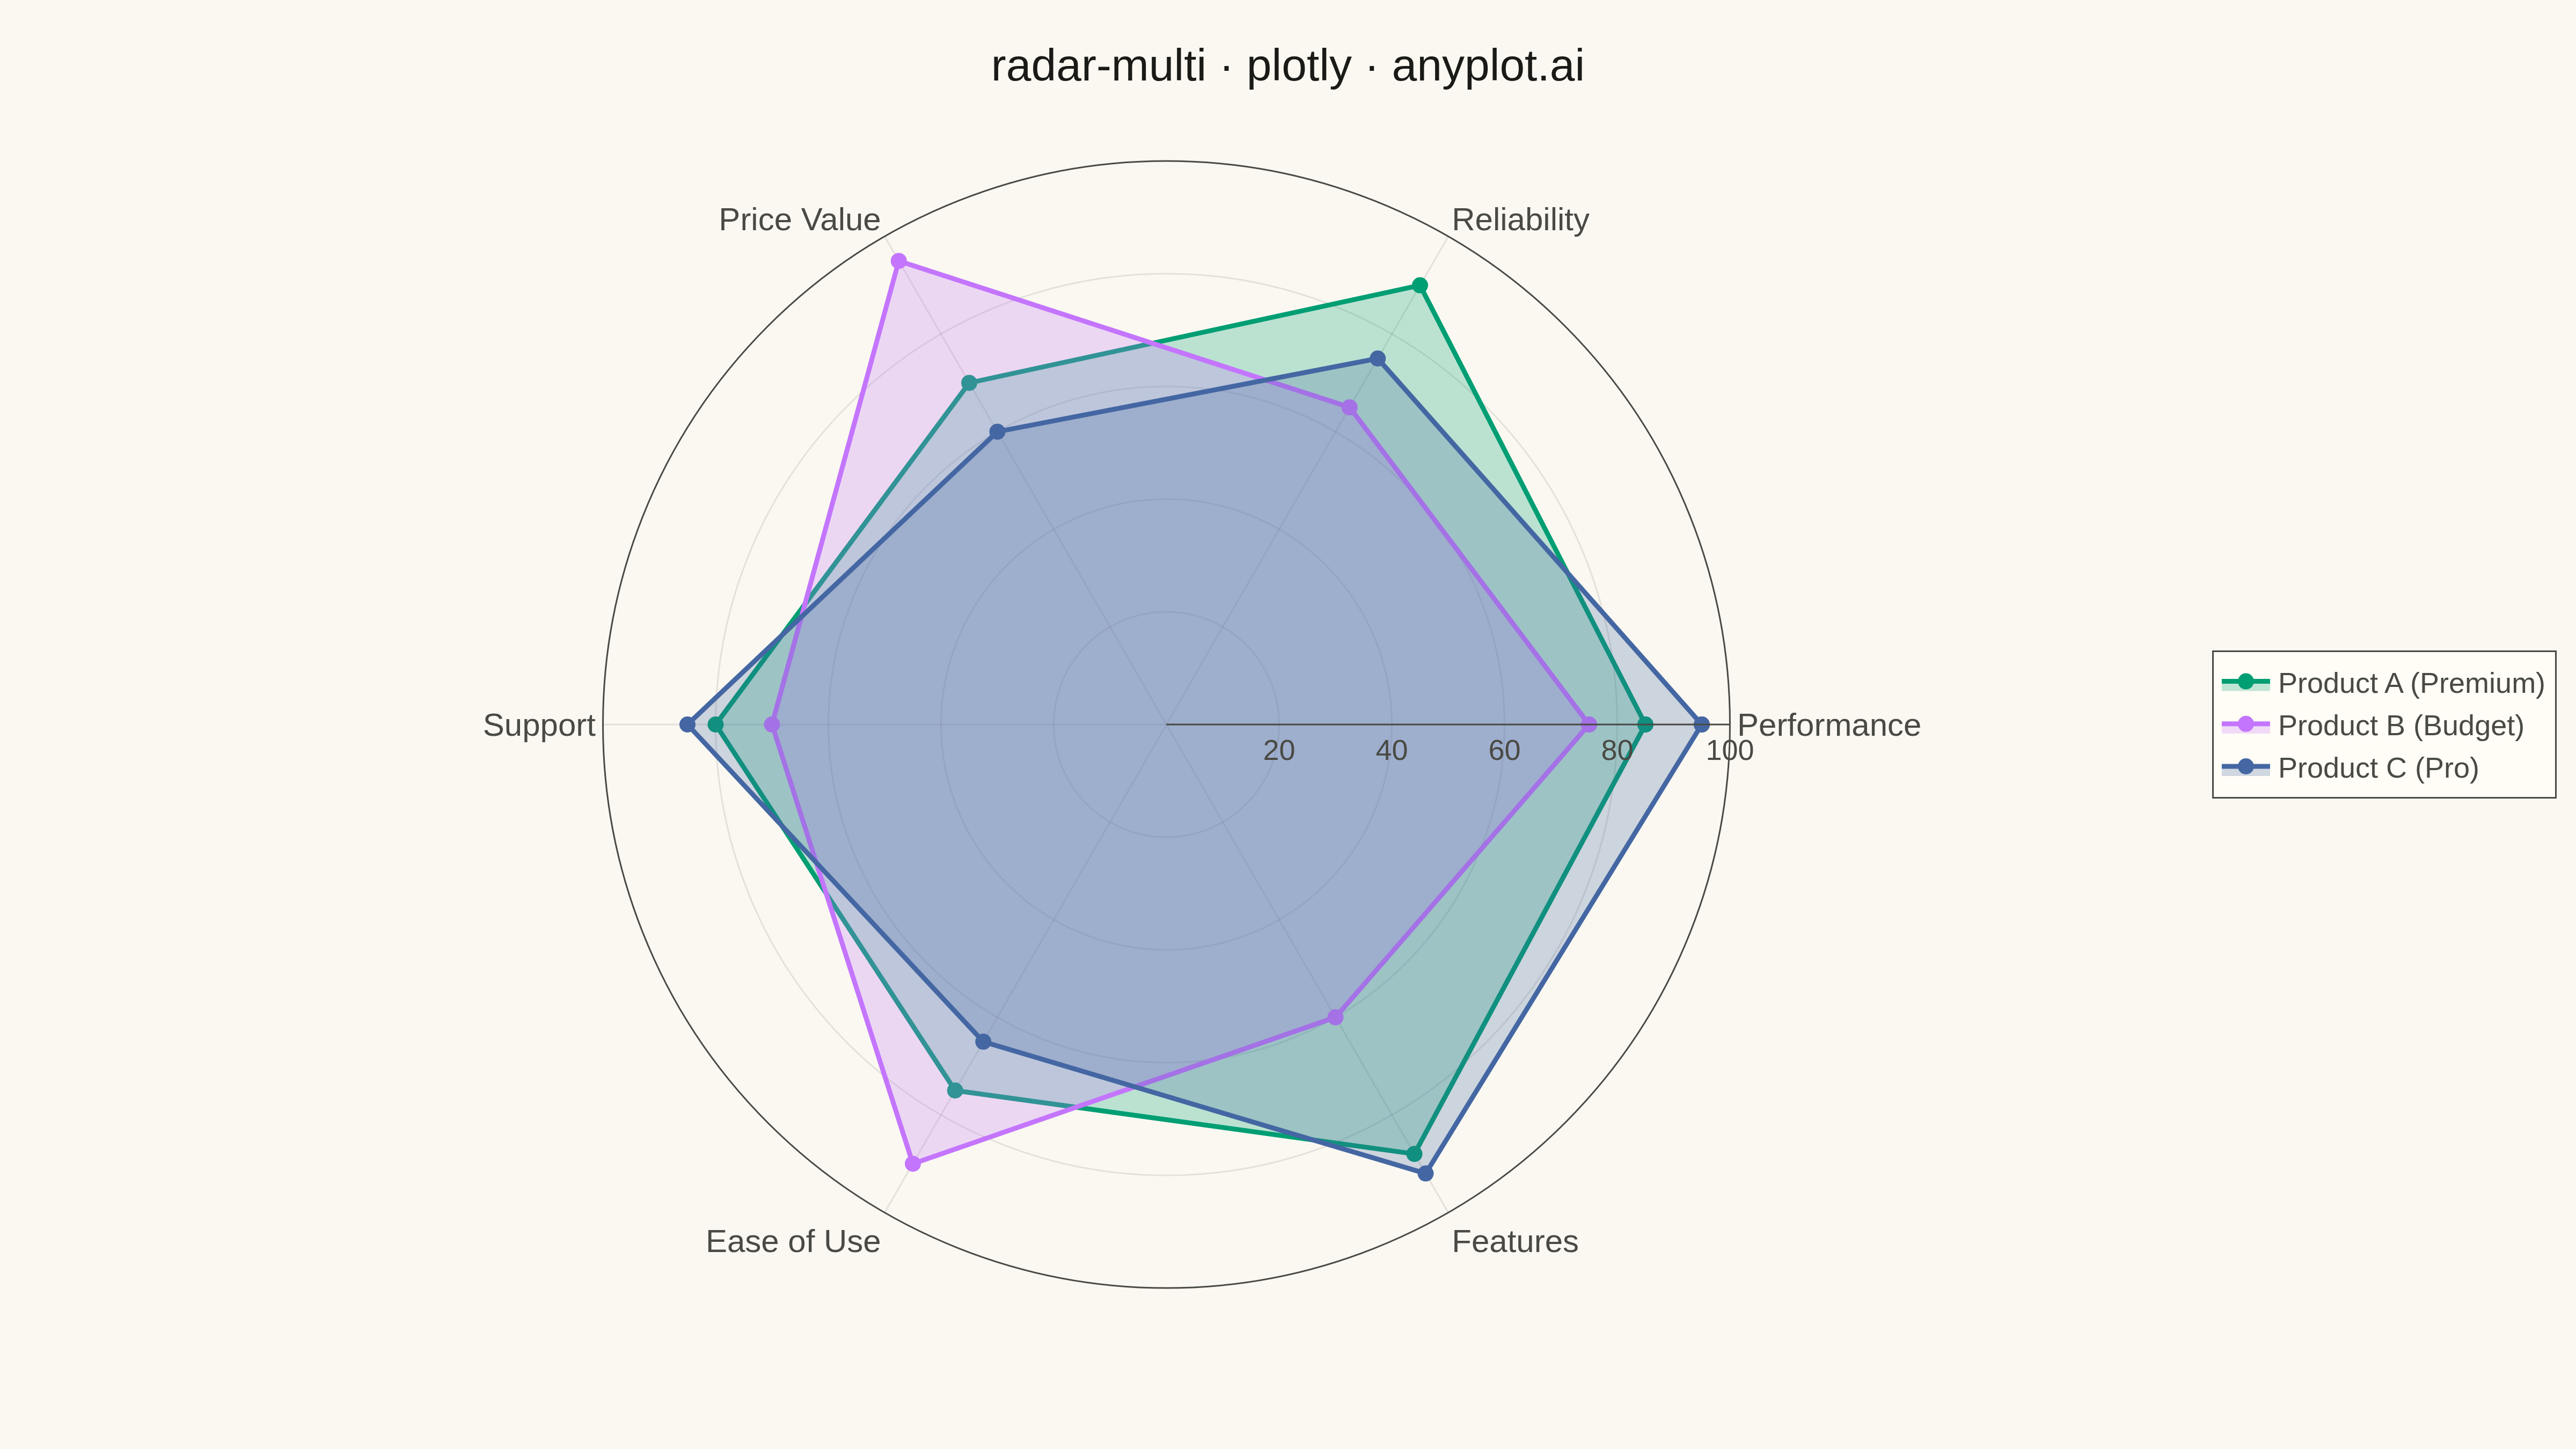
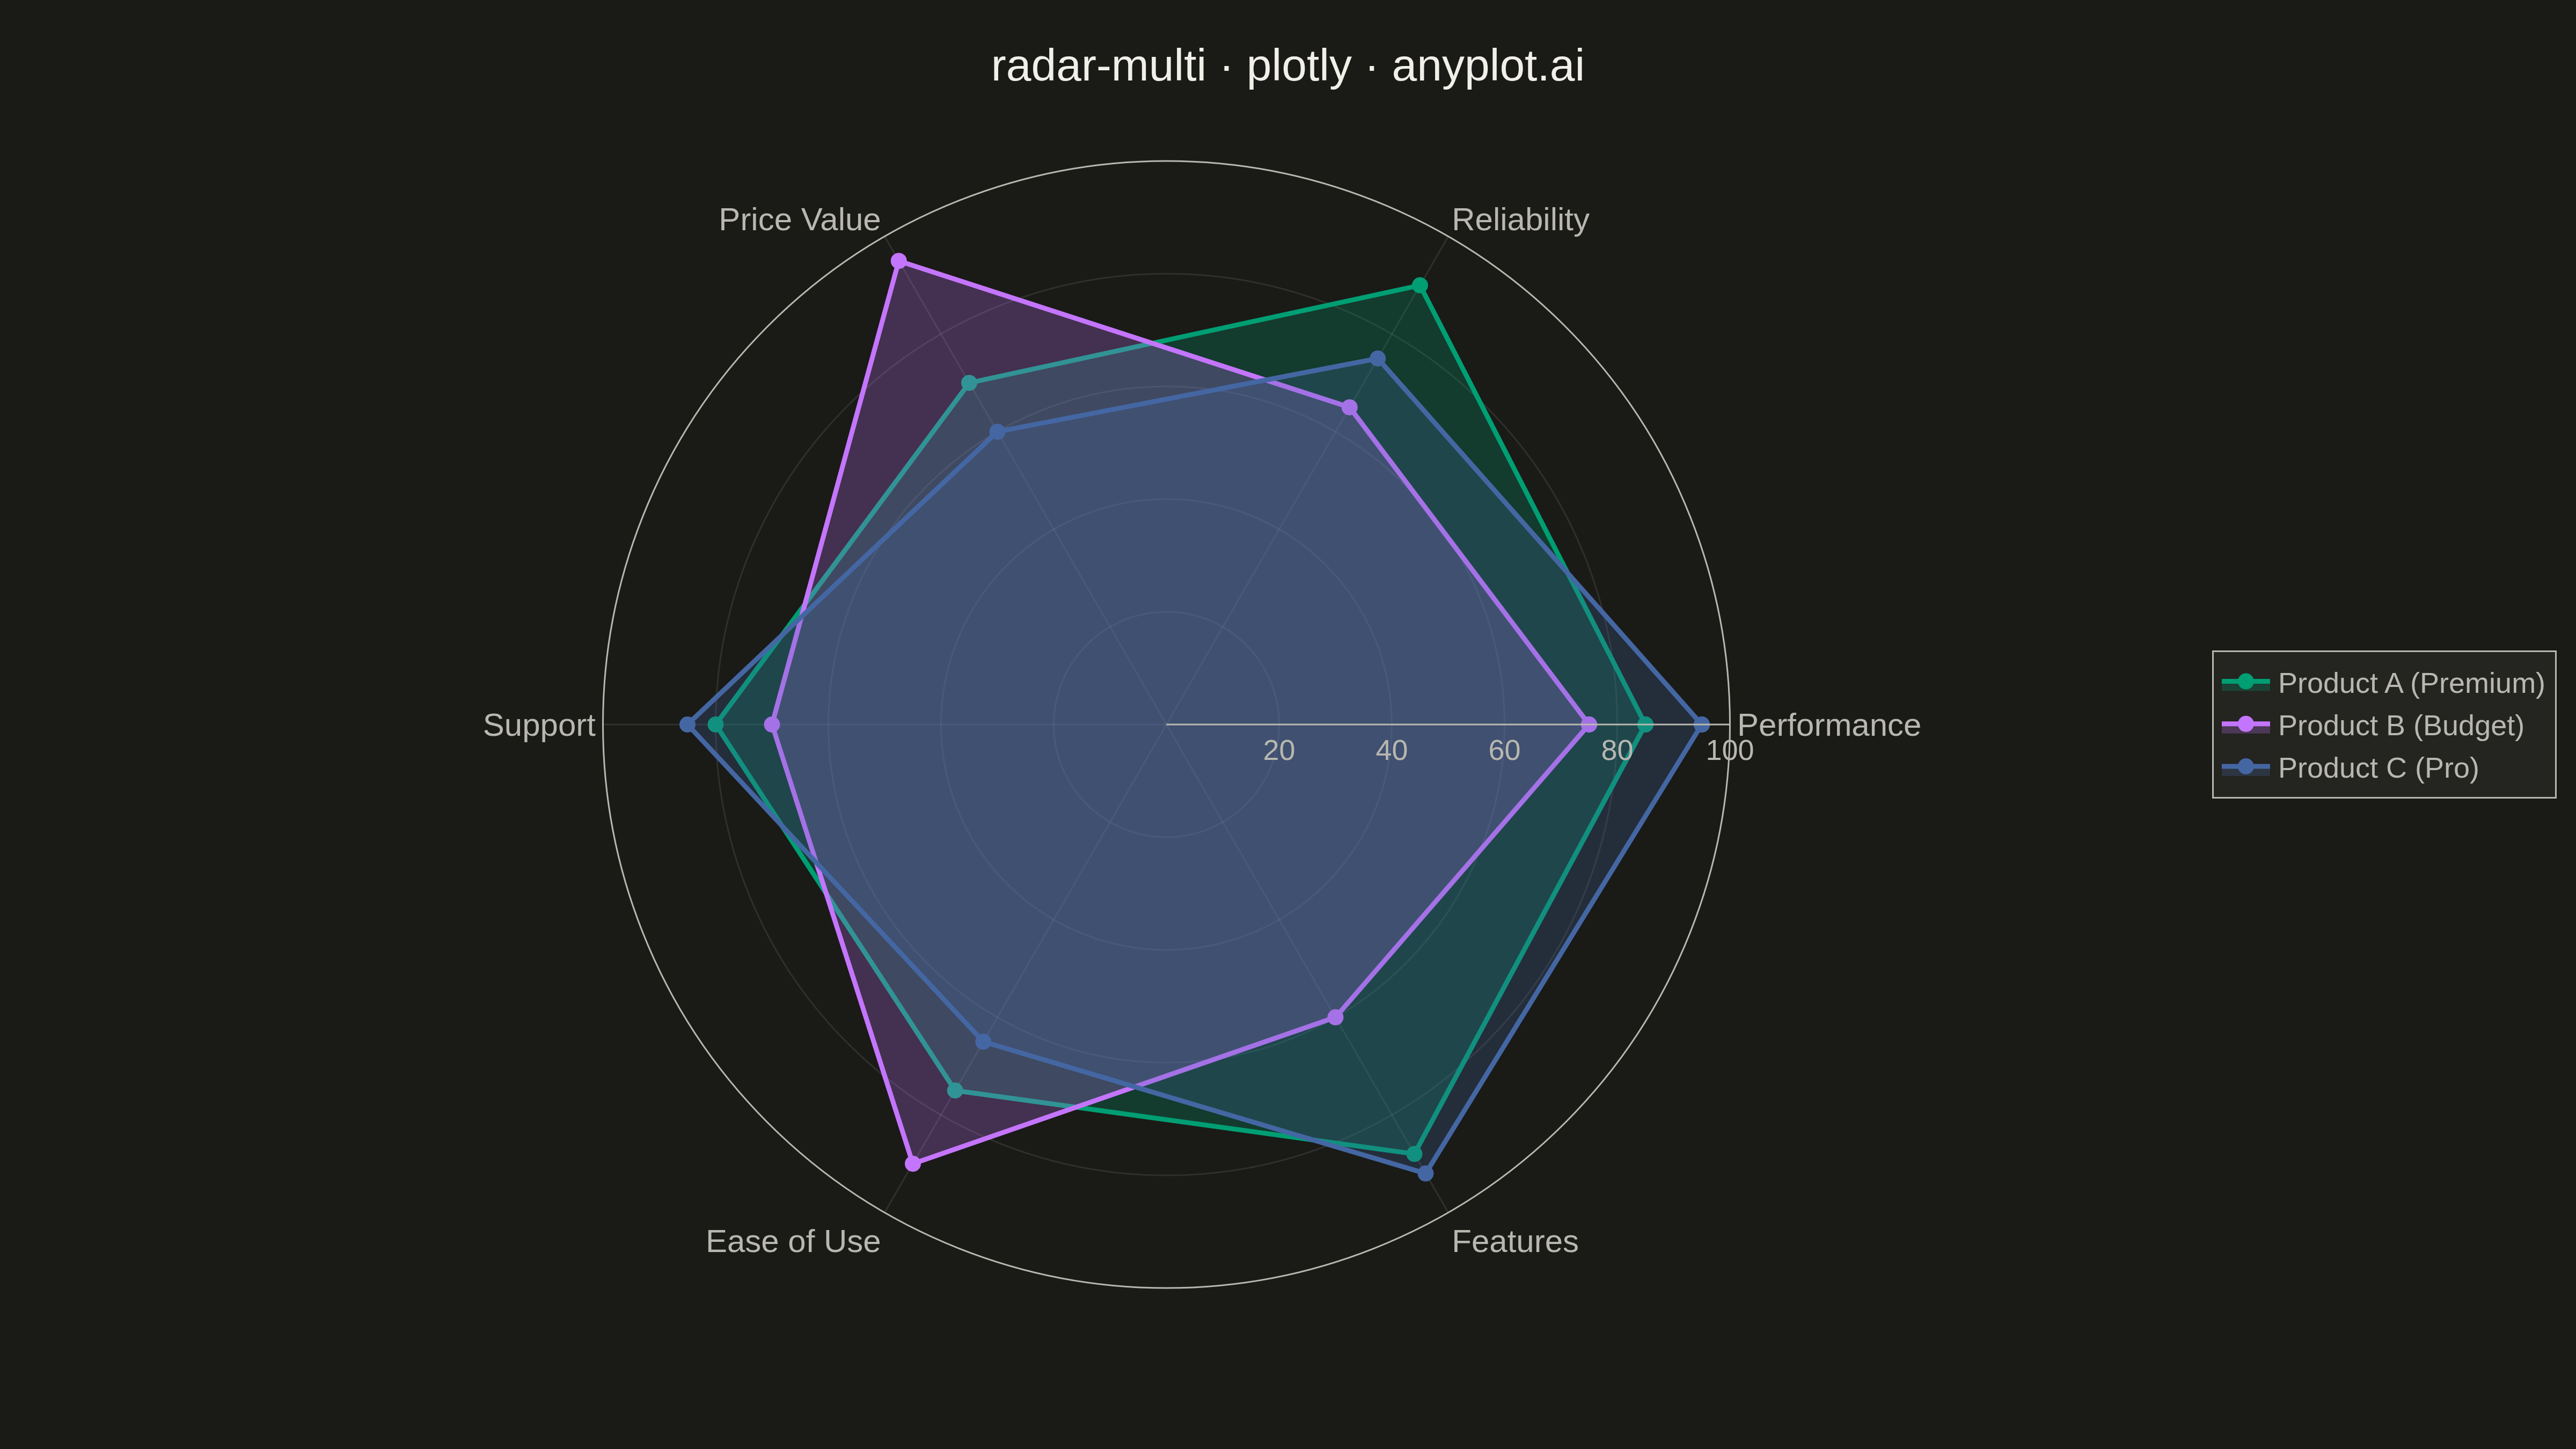
A multi-series radar chart overlays multiple data polygons on shared axes radiating from a center point, enabling direct comparison across several entities or categories. Each series is rendered as a distinct colored polygon, making it easy to identify relative strengths and weaknesses at a glance. This visualization excels at comparative analysis where multiple subjects are evaluated across the same set of metrics.
""" anyplot.ai
radar-multi: Multi-Series Radar Chart
Library: plotly 6.7.0 | Python 3.13.13
Quality: 89/100 | Updated: 2026-05-07
"""

import os

import plotly.graph_objects as go


# Theme tokens
THEME = os.getenv("ANYPLOT_THEME", "light")
PAGE_BG = "#FAF8F1" if THEME == "light" else "#1A1A17"
ELEVATED_BG = "#FFFDF6" if THEME == "light" else "#242420"
INK = "#1A1A17" if THEME == "light" else "#F0EFE8"
INK_SOFT = "#4A4A44" if THEME == "light" else "#B8B7B0"
GRID = "rgba(26, 26, 23, 0.10)" if THEME == "light" else "rgba(240, 239, 232, 0.10)"

# Okabe-Ito palette (first series always #009E73)
IMPRINT = ["#009E73", "#C475FD", "#4467A3"]

# Data - Product comparison across multiple attributes
categories = ["Performance", "Reliability", "Price Value", "Support", "Ease of Use", "Features"]

# Three products with different strengths
product_a = [85, 90, 70, 80, 75, 88]  # Strong overall, premium
product_b = [75, 65, 95, 70, 90, 60]  # Budget-friendly, easy to use
product_c = [95, 75, 60, 85, 65, 92]  # High-performance, feature-rich

# Close the polygon by repeating the first value
categories_closed = categories + [categories[0]]
product_a_closed = product_a + [product_a[0]]
product_b_closed = product_b + [product_b[0]]
product_c_closed = product_c + [product_c[0]]

# Create radar chart
fig = go.Figure()

# Product A - Okabe-Ito green
fig.add_trace(
    go.Scatterpolar(
        r=product_a_closed,
        theta=categories_closed,
        fill="toself",
        fillcolor="rgba(0, 158, 115, 0.25)",
        line={"color": IMPRINT[0], "width": 3},
        name="Product A (Premium)",
        marker={"size": 10},
    )
)

# Product B - Okabe-Ito vermillion
fig.add_trace(
    go.Scatterpolar(
        r=product_b_closed,
        theta=categories_closed,
        fill="toself",
        fillcolor="rgba(196, 117, 253, 0.25)",
        line={"color": IMPRINT[1], "width": 3},
        name="Product B (Budget)",
        marker={"size": 10},
    )
)

# Product C - Okabe-Ito blue
fig.add_trace(
    go.Scatterpolar(
        r=product_c_closed,
        theta=categories_closed,
        fill="toself",
        fillcolor="rgba(68, 103, 163, 0.25)",
        line={"color": IMPRINT[2], "width": 3},
        name="Product C (Pro)",
        marker={"size": 10},
    )
)

# Layout with theme-adaptive styling
fig.update_layout(
    title={
        "text": "radar-multi · plotly · anyplot.ai",
        "font": {"size": 28, "color": INK},
        "x": 0.5,
        "xanchor": "center",
    },
    polar={
        "radialaxis": {
            "visible": True,
            "range": [0, 100],
            "tickfont": {"size": 18, "color": INK_SOFT},
            "tickvals": [20, 40, 60, 80, 100],
            "gridcolor": GRID,
            "linecolor": INK_SOFT,
        },
        "angularaxis": {"tickfont": {"size": 20, "color": INK_SOFT}, "linecolor": INK_SOFT, "gridcolor": GRID},
        "bgcolor": PAGE_BG,
    },
    legend={
        "font": {"size": 18, "color": INK_SOFT},
        "x": 1.02,
        "y": 0.5,
        "xanchor": "left",
        "yanchor": "middle",
        "bgcolor": ELEVATED_BG,
        "bordercolor": INK_SOFT,
        "borderwidth": 1,
    },
    template="plotly_white",
    margin={"l": 100, "r": 120, "t": 100, "b": 100},
    paper_bgcolor=PAGE_BG,
    plot_bgcolor=PAGE_BG,
    font={"color": INK},
)

# Save as PNG and HTML
fig.write_image(f"plot-{THEME}.png", width=1600, height=900, scale=3)
fig.write_html(f"plot-{THEME}.html", include_plotlyjs="cdn")
Runnable source as JSON, for any HTTP client: https://api.anyplot.ai/specs/radar-multi/plotly/code. Any spec id and library id listed in llms-full.txt fit the same URL shape; every URL below is complete and callable.
{
  "spec_id": "radar-multi",
  "language": "python",
  "library": "plotly",
  "page": "https://anyplot.ai/radar-multi/python/plotly",
  "hub": "https://anyplot.ai/radar-multi",
  "code_json": "https://api.anyplot.ai/specs/radar-multi/plotly/code",
  "spec_json": "https://api.anyplot.ai/specs/radar-multi",
  "render_light_png": "https://storage.googleapis.com/anyplot-images/plots/radar-multi/python/plotly/plot-light.png",
  "render_dark_png": "https://storage.googleapis.com/anyplot-images/plots/radar-multi/python/plotly/plot-dark.png",
  "interactive_light_html": "https://storage.googleapis.com/anyplot-images/plots/radar-multi/python/plotly/plot-light.html",
  "interactive_dark_html": "https://storage.googleapis.com/anyplot-images/plots/radar-multi/python/plotly/plot-dark.html",
  "quality_score": 89.0,
  "license": "MIT",
  "guide": "https://anyplot.ai/llms.txt"
}
Part of Multi-Series Radar Chart on anyplot.ai.